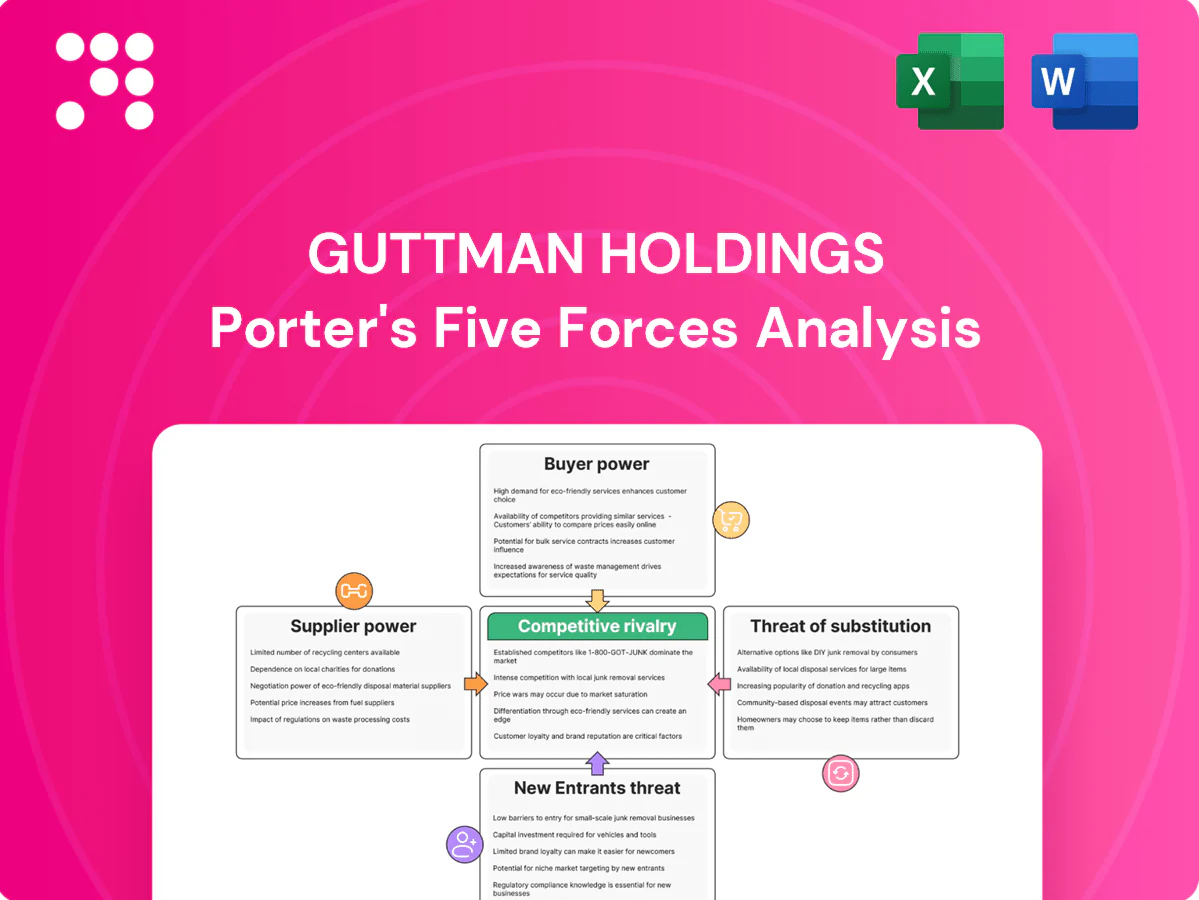
Guttman Holdings Porter's Five Forces Analysis

Don't Miss the Bigger Picture
Guttman Holdings faces moderate competitive rivalry with niche strengths in customer relationships and supply-chain positioning, while buyer power and regulatory pressures shape margins. Threats from new entrants and substitutes are evolving but manageable with strategic moves. This brief snapshot only scratches the surface—unlock the full Porter's Five Forces Analysis for force-by-force ratings and actionable recommendations.
Suppliers Bargaining Power

Upstream crude and refinery concentration
Upstream crude and refinery concentration gives integrated majors and regional refineries moderate-to-high leverage over wholesalers; U.S. operable crude distillation capacity was about 17.7 million bpd in 2024 with average utilization around 92–93% (EIA 2024), so limited regional capacity or outages tighten supply and raise crack spreads. Guttman mitigates via multi-sourcing, a spot/term mix and logistics flexibility, but in dislocations suppliers often prioritize larger offtakers or branded networks.
Pipeline, terminal, and rack access constraints
Access to pipelines, terminals, and rack slots creates bottlenecks that raise supplier power; Colonial Pipeline, for example, has ~2.5 million barrels/day capacity and its 2021 outage showed how allocation systems can force rationing and cap volumes. Long-term terminal agreements secure access but often embed fixed fees and take-or-pay obligations spanning multiple years. Greater logistics optionality and owned/leased storage materially reduce this vulnerability.

Spec product specs and compliance dependence
Reformulated and seasonal fuel specs force strict adherence, tying distributors to qualified suppliers and raising switching costs. Compliance costs and recordkeeping create leverage for upstream counterparties over pricing and contract terms. Guttman’s broad QA programs and certifications can broaden the pool of eligible suppliers and mitigate supplier concentration. Specialized blends or additized fuels, however, can still sharply narrow available sources.

Volatility and basis exposure pass-through
Suppliers can pass through price volatility and basis differentials, shifting risk downstream; in 2024 volatility spikes prompted margin increases (CME reported some commodity margin hikes up to 40%) and wider basis moves in energy and ag markets. Credit and margining terms tightened in stressed windows, while hedging programs and indexed contracts tempered pass-through, yet extreme moves still triggered allocation cuts and widened differentials regardless of hedges.
Credit terms and counterparty thresholds
Large refiners set credit limits and collateral requirements that directly constrain distributor liquidity; in 2024 the top 5 US refiners still control roughly 60% of domestic capacity, amplifying their leverage. In downturns suppliers commonly shorten tenors or require letters of credit, raising working capital needs. A strong balance sheet and committed bank lines materially improve a distributor’s negotiating posture.
- Refinery concentration ~60% (top 5, 2024)
- Shortened tenors/LCs common in stress
- Strong balance sheet = better credit terms
Upstream concentration and 17.7m bpd CDU tightness raise supplier leverage
Upstream refinery concentration and limited US distillation capacity (17.7m bpd, ~92–93% utilization in 2024) give suppliers moderate–high leverage; outages and logistics tightness (Colonial ~2.5m bpd) tighten allocations. Specs and credit terms raise switching costs; top‑5 refiners ~60% capacity in 2024. Guttman mitigates with multi‑sourcing, logistics optionality, hedges and strong liquidity.
| Metric | 2024 | Impact |
|---|---|---|
| US CDU capacity | 17.7m bpd | Tighten spreads |
| Utilization | 92–93% | Low spare |
| Top‑5 refiners | ~60% | Higher supplier power |
What is included in the product
 Detailed Word Document
Uncovers key drivers of competition, customer influence, and market entry risks tailored to Guttman Holdings, with detailed assessment of supplier and buyer power and substitute threats. Identifies disruptive forces and barriers protecting incumbents, delivered in fully editable format for use in investor materials, strategy decks, or academic projects.

 Customizable Excel Spreadsheet
A one-sheet Porter's Five Forces summary for Guttman Holdings that maps competitive pressures and relief points for rapid strategic decisions. Editable pressure sliders and an instant radar chart let you test scenarios, highlight mitigation actions, and produce presentation-ready slides for stakeholders.
Customers Bargaining Power

Large fleets and government buyers leverage scale
Large commercial fleets, industrials and public agencies buy in bulk and negotiate aggressively; the global fleet management market was about $30.9 billion in 2024, underscoring scale-driven bargaining. Their volume and multi-year contracts secure tighter spreads and service-level guarantees, while competitive RFP cycles intensify price pressure. Value-added telematics, maintenance and uptime SLAs help defend margins and improve retention.
Price transparency at racks and indices
Public rack postings and indices such as OPIS/Platts and Brent (Brent averaged about $84/bbl in 2024) make pricing highly visible, enabling buyers to benchmark offers daily and switch suppliers when differentials exceed typical retail-to-rack spreads. Index-linked contracts compressed gross margins by several percentage points in 2024 as sellers ceded pricing power. Differentiation therefore shifts to reliability, delivery windows, and value-added data services.

Switching costs moderate but tangible
Operational switching is feasible given common specs and logistics networks, but cardlock integration, telemetry, and fuel management tie-ins create stickiness; telematics adoption reached about 68% of North American fleets in 2024. Emergency delivery performance and compliance reporting embed relationship value, with on-time emergency fulfillment improving service metrics by roughly 12% in 2024. Buyers still use multi-sourcing to keep pressure on pricing, with surveys showing about 58% maintaining multiple fuel suppliers in 2024.

Demand cyclicality and budget constraints
Economic cycles and public fiscal constraints drive pronounced volume swings for Guttman Holdings, increasing buyer leverage as procurement windows tighten; during slowdowns customers intensify negotiations for price cuts and extended payment terms. Fuel price surges in 2024 heightened demand for hedging and fuel cap structures, with clients willing to trade spot savings for rate predictability. Flexible pricing menus preserve margin while aligning incentives.
- Q1–Q4 2024: higher negotiation intensity
- Fuel hedging uptake rose in 2024
- Flexible menus mitigate margin erosion
ESG and alternative fuel preferences
Customer ESG demands increasingly steer fuel sourcing; many buyers now request low‑carbon fuels or Scope 3 reporting, shifting demand toward biodiesel blends and renewable diesel—US renewable diesel capacity exceeded roughly 3.5 billion gallons/year by 2024, tightening supplier selection.
Distributors that supply audited sustainability data win share, but buyers in regions lacking low‑carbon alternatives retain limited leverage.
Fleet buyers compress margins: market $30.9B, Brent $84/bbl, telematics 68%
Large fleet buyers and public agencies wield high volume leverage (global fleet mgmt ~$30.9B in 2024) and benchmark daily (Brent ~$84/bbl), compressing margins. Telematics adoption ~68% and multi-sourcing ~58% create some stickiness but sustain price pressure. RD demand (US capacity ~3.5 bgy) and ESG/Scope 3 requests increase nonprice bargaining.
| Metric | 2024 |
|---|---|
| Global fleet market | $30.9B |
| Brent | $84/bbl |
| Telematics adoption | 68% |
| Multi-sourcing | 58% |
| US RD capacity | ~3.5 bgy |
Preview the Actual Deliverable
Guttman Holdings Porter's Five Forces Analysis
This preview shows the exact Guttman Holdings Porter’s Five Forces Analysis you’ll receive—no mockups or placeholders. The document displayed is the complete, professionally formatted file, ready for immediate download and use upon purchase. You’re viewing the final deliverable, identical to the one provided after payment.

Don't Miss the Bigger Picture
Guttman Holdings faces moderate competitive rivalry with niche strengths in customer relationships and supply-chain positioning, while buyer power and regulatory pressures shape margins. Threats from new entrants and substitutes are evolving but manageable with strategic moves. This brief snapshot only scratches the surface—unlock the full Porter's Five Forces Analysis for force-by-force ratings and actionable recommendations.
Suppliers Bargaining Power
Upstream crude and refinery concentration
Upstream crude and refinery concentration gives integrated majors and regional refineries moderate-to-high leverage over wholesalers; U.S. operable crude distillation capacity was about 17.7 million bpd in 2024 with average utilization around 92–93% (EIA 2024), so limited regional capacity or outages tighten supply and raise crack spreads. Guttman mitigates via multi-sourcing, a spot/term mix and logistics flexibility, but in dislocations suppliers often prioritize larger offtakers or branded networks.
Pipeline, terminal, and rack access constraints
Access to pipelines, terminals, and rack slots creates bottlenecks that raise supplier power; Colonial Pipeline, for example, has ~2.5 million barrels/day capacity and its 2021 outage showed how allocation systems can force rationing and cap volumes. Long-term terminal agreements secure access but often embed fixed fees and take-or-pay obligations spanning multiple years. Greater logistics optionality and owned/leased storage materially reduce this vulnerability.
Spec product specs and compliance dependence
Reformulated and seasonal fuel specs force strict adherence, tying distributors to qualified suppliers and raising switching costs. Compliance costs and recordkeeping create leverage for upstream counterparties over pricing and contract terms. Guttman’s broad QA programs and certifications can broaden the pool of eligible suppliers and mitigate supplier concentration. Specialized blends or additized fuels, however, can still sharply narrow available sources.
Volatility and basis exposure pass-through
Suppliers can pass through price volatility and basis differentials, shifting risk downstream; in 2024 volatility spikes prompted margin increases (CME reported some commodity margin hikes up to 40%) and wider basis moves in energy and ag markets. Credit and margining terms tightened in stressed windows, while hedging programs and indexed contracts tempered pass-through, yet extreme moves still triggered allocation cuts and widened differentials regardless of hedges.
Credit terms and counterparty thresholds
Large refiners set credit limits and collateral requirements that directly constrain distributor liquidity; in 2024 the top 5 US refiners still control roughly 60% of domestic capacity, amplifying their leverage. In downturns suppliers commonly shorten tenors or require letters of credit, raising working capital needs. A strong balance sheet and committed bank lines materially improve a distributor’s negotiating posture.
- Refinery concentration ~60% (top 5, 2024)
- Shortened tenors/LCs common in stress
- Strong balance sheet = better credit terms
Upstream concentration and 17.7m bpd CDU tightness raise supplier leverage
Upstream refinery concentration and limited US distillation capacity (17.7m bpd, ~92–93% utilization in 2024) give suppliers moderate–high leverage; outages and logistics tightness (Colonial ~2.5m bpd) tighten allocations. Specs and credit terms raise switching costs; top‑5 refiners ~60% capacity in 2024. Guttman mitigates with multi‑sourcing, logistics optionality, hedges and strong liquidity.
| Metric | 2024 | Impact |
|---|---|---|
| US CDU capacity | 17.7m bpd | Tighten spreads |
| Utilization | 92–93% | Low spare |
| Top‑5 refiners | ~60% | Higher supplier power |
What is included in the product
Detailed Word Document
Uncovers key drivers of competition, customer influence, and market entry risks tailored to Guttman Holdings, with detailed assessment of supplier and buyer power and substitute threats. Identifies disruptive forces and barriers protecting incumbents, delivered in fully editable format for use in investor materials, strategy decks, or academic projects.
Customizable Excel Spreadsheet
A one-sheet Porter's Five Forces summary for Guttman Holdings that maps competitive pressures and relief points for rapid strategic decisions. Editable pressure sliders and an instant radar chart let you test scenarios, highlight mitigation actions, and produce presentation-ready slides for stakeholders.
Customers Bargaining Power
Large fleets and government buyers leverage scale
Large commercial fleets, industrials and public agencies buy in bulk and negotiate aggressively; the global fleet management market was about $30.9 billion in 2024, underscoring scale-driven bargaining. Their volume and multi-year contracts secure tighter spreads and service-level guarantees, while competitive RFP cycles intensify price pressure. Value-added telematics, maintenance and uptime SLAs help defend margins and improve retention.
Price transparency at racks and indices
Public rack postings and indices such as OPIS/Platts and Brent (Brent averaged about $84/bbl in 2024) make pricing highly visible, enabling buyers to benchmark offers daily and switch suppliers when differentials exceed typical retail-to-rack spreads. Index-linked contracts compressed gross margins by several percentage points in 2024 as sellers ceded pricing power. Differentiation therefore shifts to reliability, delivery windows, and value-added data services.
Switching costs moderate but tangible
Operational switching is feasible given common specs and logistics networks, but cardlock integration, telemetry, and fuel management tie-ins create stickiness; telematics adoption reached about 68% of North American fleets in 2024. Emergency delivery performance and compliance reporting embed relationship value, with on-time emergency fulfillment improving service metrics by roughly 12% in 2024. Buyers still use multi-sourcing to keep pressure on pricing, with surveys showing about 58% maintaining multiple fuel suppliers in 2024.
Demand cyclicality and budget constraints
Economic cycles and public fiscal constraints drive pronounced volume swings for Guttman Holdings, increasing buyer leverage as procurement windows tighten; during slowdowns customers intensify negotiations for price cuts and extended payment terms. Fuel price surges in 2024 heightened demand for hedging and fuel cap structures, with clients willing to trade spot savings for rate predictability. Flexible pricing menus preserve margin while aligning incentives.
- Q1–Q4 2024: higher negotiation intensity
- Fuel hedging uptake rose in 2024
- Flexible menus mitigate margin erosion
ESG and alternative fuel preferences
Customer ESG demands increasingly steer fuel sourcing; many buyers now request low‑carbon fuels or Scope 3 reporting, shifting demand toward biodiesel blends and renewable diesel—US renewable diesel capacity exceeded roughly 3.5 billion gallons/year by 2024, tightening supplier selection.
Distributors that supply audited sustainability data win share, but buyers in regions lacking low‑carbon alternatives retain limited leverage.
Fleet buyers compress margins: market $30.9B, Brent $84/bbl, telematics 68%
Large fleet buyers and public agencies wield high volume leverage (global fleet mgmt ~$30.9B in 2024) and benchmark daily (Brent ~$84/bbl), compressing margins. Telematics adoption ~68% and multi-sourcing ~58% create some stickiness but sustain price pressure. RD demand (US capacity ~3.5 bgy) and ESG/Scope 3 requests increase nonprice bargaining.
| Metric | 2024 |
|---|---|
| Global fleet market | $30.9B |
| Brent | $84/bbl |
| Telematics adoption | 68% |
| Multi-sourcing | 58% |
| US RD capacity | ~3.5 bgy |
Preview the Actual Deliverable
Guttman Holdings Porter's Five Forces Analysis
This preview shows the exact Guttman Holdings Porter’s Five Forces Analysis you’ll receive—no mockups or placeholders. The document displayed is the complete, professionally formatted file, ready for immediate download and use upon purchase. You’re viewing the final deliverable, identical to the one provided after payment.
Original: $10.00
-65%$10.00
$3.50Description
Don't Miss the Bigger Picture
Guttman Holdings faces moderate competitive rivalry with niche strengths in customer relationships and supply-chain positioning, while buyer power and regulatory pressures shape margins. Threats from new entrants and substitutes are evolving but manageable with strategic moves. This brief snapshot only scratches the surface—unlock the full Porter's Five Forces Analysis for force-by-force ratings and actionable recommendations.
Suppliers Bargaining Power
Upstream crude and refinery concentration
Upstream crude and refinery concentration gives integrated majors and regional refineries moderate-to-high leverage over wholesalers; U.S. operable crude distillation capacity was about 17.7 million bpd in 2024 with average utilization around 92–93% (EIA 2024), so limited regional capacity or outages tighten supply and raise crack spreads. Guttman mitigates via multi-sourcing, a spot/term mix and logistics flexibility, but in dislocations suppliers often prioritize larger offtakers or branded networks.
Pipeline, terminal, and rack access constraints
Access to pipelines, terminals, and rack slots creates bottlenecks that raise supplier power; Colonial Pipeline, for example, has ~2.5 million barrels/day capacity and its 2021 outage showed how allocation systems can force rationing and cap volumes. Long-term terminal agreements secure access but often embed fixed fees and take-or-pay obligations spanning multiple years. Greater logistics optionality and owned/leased storage materially reduce this vulnerability.
Spec product specs and compliance dependence
Reformulated and seasonal fuel specs force strict adherence, tying distributors to qualified suppliers and raising switching costs. Compliance costs and recordkeeping create leverage for upstream counterparties over pricing and contract terms. Guttman’s broad QA programs and certifications can broaden the pool of eligible suppliers and mitigate supplier concentration. Specialized blends or additized fuels, however, can still sharply narrow available sources.
Volatility and basis exposure pass-through
Suppliers can pass through price volatility and basis differentials, shifting risk downstream; in 2024 volatility spikes prompted margin increases (CME reported some commodity margin hikes up to 40%) and wider basis moves in energy and ag markets. Credit and margining terms tightened in stressed windows, while hedging programs and indexed contracts tempered pass-through, yet extreme moves still triggered allocation cuts and widened differentials regardless of hedges.
Credit terms and counterparty thresholds
Large refiners set credit limits and collateral requirements that directly constrain distributor liquidity; in 2024 the top 5 US refiners still control roughly 60% of domestic capacity, amplifying their leverage. In downturns suppliers commonly shorten tenors or require letters of credit, raising working capital needs. A strong balance sheet and committed bank lines materially improve a distributor’s negotiating posture.
- Refinery concentration ~60% (top 5, 2024)
- Shortened tenors/LCs common in stress
- Strong balance sheet = better credit terms
Upstream concentration and 17.7m bpd CDU tightness raise supplier leverage
Upstream refinery concentration and limited US distillation capacity (17.7m bpd, ~92–93% utilization in 2024) give suppliers moderate–high leverage; outages and logistics tightness (Colonial ~2.5m bpd) tighten allocations. Specs and credit terms raise switching costs; top‑5 refiners ~60% capacity in 2024. Guttman mitigates with multi‑sourcing, logistics optionality, hedges and strong liquidity.
| Metric | 2024 | Impact |
|---|---|---|
| US CDU capacity | 17.7m bpd | Tighten spreads |
| Utilization | 92–93% | Low spare |
| Top‑5 refiners | ~60% | Higher supplier power |
What is included in the product
Detailed Word Document
Uncovers key drivers of competition, customer influence, and market entry risks tailored to Guttman Holdings, with detailed assessment of supplier and buyer power and substitute threats. Identifies disruptive forces and barriers protecting incumbents, delivered in fully editable format for use in investor materials, strategy decks, or academic projects.
Customizable Excel Spreadsheet
A one-sheet Porter's Five Forces summary for Guttman Holdings that maps competitive pressures and relief points for rapid strategic decisions. Editable pressure sliders and an instant radar chart let you test scenarios, highlight mitigation actions, and produce presentation-ready slides for stakeholders.
Customers Bargaining Power
Large fleets and government buyers leverage scale
Large commercial fleets, industrials and public agencies buy in bulk and negotiate aggressively; the global fleet management market was about $30.9 billion in 2024, underscoring scale-driven bargaining. Their volume and multi-year contracts secure tighter spreads and service-level guarantees, while competitive RFP cycles intensify price pressure. Value-added telematics, maintenance and uptime SLAs help defend margins and improve retention.
Price transparency at racks and indices
Public rack postings and indices such as OPIS/Platts and Brent (Brent averaged about $84/bbl in 2024) make pricing highly visible, enabling buyers to benchmark offers daily and switch suppliers when differentials exceed typical retail-to-rack spreads. Index-linked contracts compressed gross margins by several percentage points in 2024 as sellers ceded pricing power. Differentiation therefore shifts to reliability, delivery windows, and value-added data services.
Switching costs moderate but tangible
Operational switching is feasible given common specs and logistics networks, but cardlock integration, telemetry, and fuel management tie-ins create stickiness; telematics adoption reached about 68% of North American fleets in 2024. Emergency delivery performance and compliance reporting embed relationship value, with on-time emergency fulfillment improving service metrics by roughly 12% in 2024. Buyers still use multi-sourcing to keep pressure on pricing, with surveys showing about 58% maintaining multiple fuel suppliers in 2024.
Demand cyclicality and budget constraints
Economic cycles and public fiscal constraints drive pronounced volume swings for Guttman Holdings, increasing buyer leverage as procurement windows tighten; during slowdowns customers intensify negotiations for price cuts and extended payment terms. Fuel price surges in 2024 heightened demand for hedging and fuel cap structures, with clients willing to trade spot savings for rate predictability. Flexible pricing menus preserve margin while aligning incentives.
- Q1–Q4 2024: higher negotiation intensity
- Fuel hedging uptake rose in 2024
- Flexible menus mitigate margin erosion
ESG and alternative fuel preferences
Customer ESG demands increasingly steer fuel sourcing; many buyers now request low‑carbon fuels or Scope 3 reporting, shifting demand toward biodiesel blends and renewable diesel—US renewable diesel capacity exceeded roughly 3.5 billion gallons/year by 2024, tightening supplier selection.
Distributors that supply audited sustainability data win share, but buyers in regions lacking low‑carbon alternatives retain limited leverage.
Fleet buyers compress margins: market $30.9B, Brent $84/bbl, telematics 68%
Large fleet buyers and public agencies wield high volume leverage (global fleet mgmt ~$30.9B in 2024) and benchmark daily (Brent ~$84/bbl), compressing margins. Telematics adoption ~68% and multi-sourcing ~58% create some stickiness but sustain price pressure. RD demand (US capacity ~3.5 bgy) and ESG/Scope 3 requests increase nonprice bargaining.
| Metric | 2024 |
|---|---|
| Global fleet market | $30.9B |
| Brent | $84/bbl |
| Telematics adoption | 68% |
| Multi-sourcing | 58% |
| US RD capacity | ~3.5 bgy |
Preview the Actual Deliverable
Guttman Holdings Porter's Five Forces Analysis
This preview shows the exact Guttman Holdings Porter’s Five Forces Analysis you’ll receive—no mockups or placeholders. The document displayed is the complete, professionally formatted file, ready for immediate download and use upon purchase. You’re viewing the final deliverable, identical to the one provided after payment.











