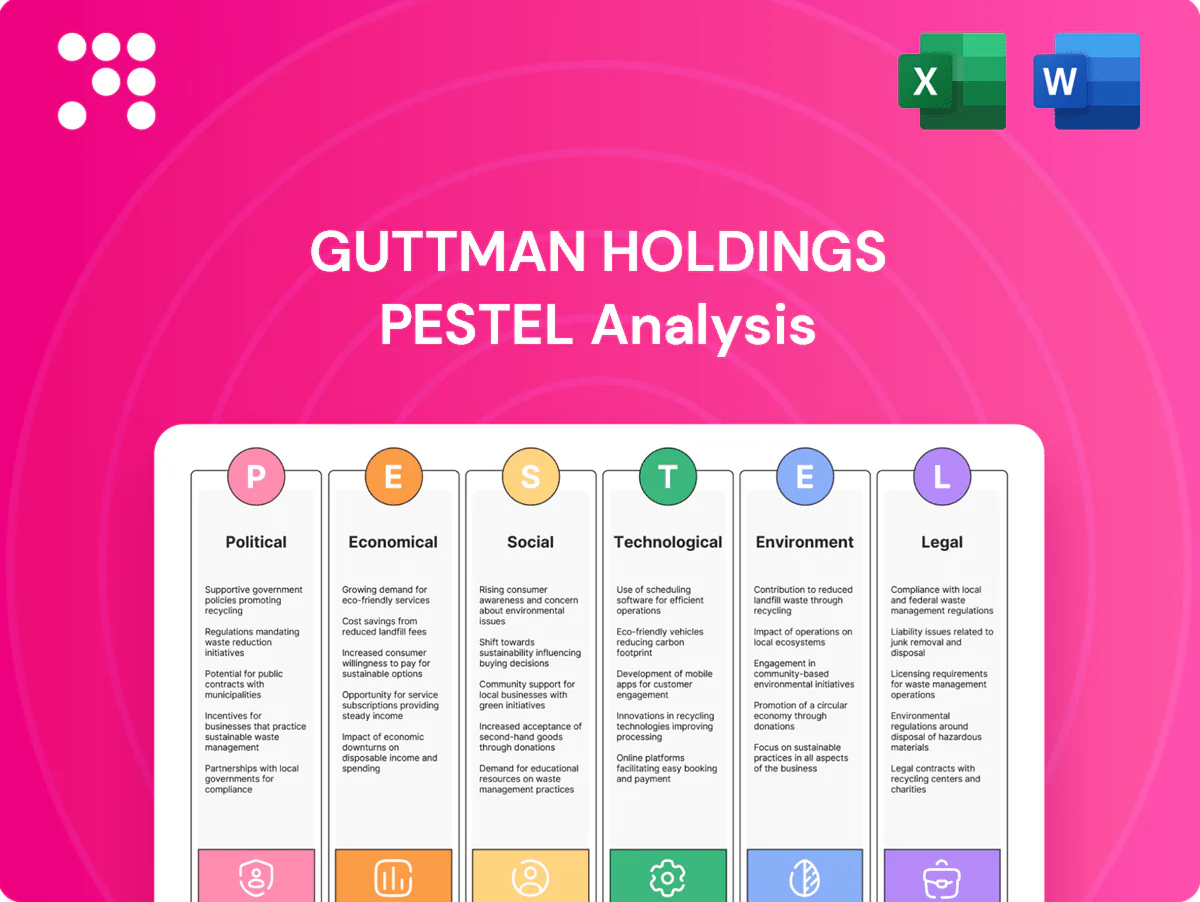
Guttman Holdings PESTLE Analysis

Your Competitive Advantage Starts with This Report
Unlock strategic clarity with our PESTLE Analysis of Guttman Holdings—three to five concise sentences that map political, economic, social, technological, legal, and environmental forces shaping the company. Use these insights to anticipate risks and spot growth levers for investment or strategy. Purchase the full report to access the complete, actionable breakdown instantly.
Political factors

Energy policy and fuel standards
Changes in federal and state energy policies can shift demand for gasoline (~8.8 million b/d US, 2024 EIA), diesel (~3.7 million b/d) and heating oil, affecting Guttman Holdings volume mix. Stricter fuel standards (EPA Tier 3, state LCFS) and RFS biodiesel volumes (biomass-based diesel ~2.76 bn gal 2024) drive blending, sourcing and logistics changes. Policy shifts alter customer mix across commercial, industrial and government accounts. Proactive compliance preserves contract stability and margins, and LCFS credit prices (~$120/ton in 2024) materially affect profitability.
Infrastructure and transportation funding
Public investment shapes freight flows and diesel use: the 2021 Infrastructure Investment and Jobs Act commits about 550 billion USD in new spending, including roughly 110 billion for roads and bridges, directly supporting construction fuel demand. Funding cycles produce regional spikes tied to project timelines, while designated 7.5 billion for EV charging and growing rail grants can shift long-term volumes, so aligning capacity with funded projects reduces volatility.

Geopolitics and supply security
Global tensions can sharply disrupt crude and refined supply chains: OPEC and allies account for roughly 40% of world oil production, while chokepoints like the Suez Canal carry about 12% of global trade, amplifying rack-price volatility. Sanctions and shipping constraints raise availability risks and can widen regional rack spreads. Diversified suppliers and on-site or third-party storage — noting US SPR capacity of 714 million barrels — improve resilience. Transparent, timely communication with customers preserves trust during dislocations.

Government procurement dynamics
Winning public-sector fuel contracts hinges on strict compliance, competitive pricing and proven delivery reliability; public procurement accounts for about 12% of GDP across OECD countries, shaping sizable demand. Budget cycles and appropriations drive volumes and timing, while preference programs and local content rules redirect awards; a strong performance history materially improves renewal odds.
- compliance
- pricing
- reliability
- budget cycles
- local content
- performance history
Subsidies and incentives for alternatives
Incentives from the Inflation Reduction Act (about $369 billion in clean energy tax credits) and state programs are shifting demand toward renewable diesel, SAF and electrification; California LCFS credits averaged roughly $150/MT in 2024, materially improving blended fuel economics. Credits and grants at fleet level can cut operating costs and accelerate conversions, while clear policy timelines let Guttman sell compliant blends and advisory services. Active monitoring of incentive sunsets is required to avoid stranded inventory and margin erosion.
- Incentive scale: IRA $369B
- LCFS signal: ~$150/MT (2024)
- Fleet impact: lower TCO via credits/grants
- Risk: monitor sunsets to prevent stranded stock
LCFS $120–150/MT and IRA $369B accelerate renewable diesel and SAF adoption
Federal/state energy rules, LCFS (~$120–150/MT 2024) and RFS (~2.76 bn gal biodiesel 2024) shift fuel mix and margins; public contracts (≈12% GDP OECD) and IIJA roads funding (~$110B) drive diesel demand timing. Sanctions/OPEC and Suez chokepoint risks raise rack volatility; SPR ≈714M bbl buffers supply. IRA ~$369B speeds renewable diesel/SAF adoption; monitor credit sunsets.
| Metric | Value (2024/2025) |
|---|---|
| Gasoline US | 8.8M b/d (2024) |
| LCFS price | $120–150/MT (2024) |
| SPR | 714M bbl |
| IRA | $369B |
What is included in the product
 Detailed Word Document
Explores how macro-environmental factors uniquely affect Guttman Holdings across Political, Economic, Social, Technological, Environmental and Legal dimensions, with region- and industry-specific data and trends. Designed for executives and investors, the analysis offers detailed sub-points, forward-looking insights and clean formatting ready for business plans, pitch decks or scenario planning.

 Customizable Excel Spreadsheet
A concise, visually segmented PESTLE summary of Guttman Holdings that streamlines external risk assessment for meetings, is easily editable with region- or business-specific notes, and can be dropped into presentations or shared across teams for rapid alignment.
Economic factors

Price volatility and hedging
Crude and refined-product volatility materially affects customer budgets and margins: WTI traded roughly $60–95/barrel in 2024 and Brent averaged about $85/barrel, driving margin swings for downstream buyers. Robust risk-management and pricing strategies (fixed-price contracts, collars) increase customer stickiness by stabilizing costs. Basis and rack differentials—often moving roughly $2–10/barrel regionally—require dynamic sourcing. Hedging execution quality directly alters realized profitability and cash‑flow timing.
Interest rates and working capital
Higher rates (US fed funds 5.25–5.50% in July 2025) raise inventory and receivables carrying costs and have pushed corporate borrowing roughly 300 bps above 2021 levels, tightening credit terms and collateral requirements.
Shorter payment windows and stricter covenants force Guttman to accelerate cash conversion to maintain competitive bid pricing. Liquidity planning—holding committed lines and cash buffers—mitigates rapid raw-material price swings.

Freight, industrial, and construction cycles
Diesel demand tracks trucking, manufacturing and construction; US distillate consumption averaged about 3.6 million barrels per day in 2024 (EIA), reflecting freight and industrial activity. Regional economic disparities (Midwest vs Gulf/West) create uneven volume patterns, so scenario planning aligns fleet fueling capacity with cyclical sectors. Diversification across industries smooths revenue.

Credit risk and customer solvency
Economic downturns can lift default risk among small fleets and contractors, with industry reports in 2024 indicating contingent default spikes of roughly 30%–50% in stressed segments; rigorous credit screening and trade-credit insurance cap losses and preserve liquidity.
Flexible pricing, volume commitments and early warning fuel-management telematics (uptime/fuel anomalies) enable targeted interventions to retain at-risk accounts and reduce recovery costs.
- Default spike: ~30%–50% in stressed SMEs (2024)
- Mitigation: credit screening + trade-credit insurance
- Retention: flexible pricing & volume commitments
- Signal: fuel-management telematics for early warning
Competition and margin compression
Wholesale fuel is highly competitive with 2024 spot margins often under $0.05 per gallon; Guttman competes on reliability, logistics efficiency and data-driven services to reduce churn. Value-added fuel management can lift client margins 10–30%, offsetting price-driven losses, while continuous cost optimization preserved spreads through the 2023–24 downcycle.
- Thin spot margins: ~<$0.05/gal in 2024
- Diff: reliability, logistics, data
- Value-added: +10–30% client margin uplift
- Cost optimization: preserves spread in downturns
LCFS $120–150/MT and IRA $369B accelerate renewable diesel and SAF adoption
Energy price swings (WTI $60–95/bbl in 2024; Brent ≈$85) and Fed funds at 5.25–5.50% (Jul 2025) raise carrying costs and margin volatility. Distillate demand ~3.6 mbd (2024) links to freight/construction cycles; regional spreads drive sourcing. SME default spikes ~30–50% in stressed segments; flexible pricing, hedging and credit controls preserve liquidity and retention.
| Metric | Value |
|---|---|
| WTI (2024) | $60–95/bbl |
| Brent (2024) | $85/bbl |
| Fed funds (Jul 2025) | 5.25–5.50% |
| Distillate demand (2024) | 3.6 mbd |
| SME default spike (2024) | 30–50% |
| Spot margins (2024) | <$0.05/gal |
| Client uplift | +10–30% |
Same Document Delivered
Guttman Holdings PESTLE Analysis
The Guttman Holdings PESTLE Analysis preview shown here is the exact document you’ll receive after purchase—fully formatted and ready to use. This is a real snapshot of the product, delivered exactly as displayed with no placeholders or surprises. The layout, content, and structure visible here are what you’ll download immediately after buying.

Your Competitive Advantage Starts with This Report
Unlock strategic clarity with our PESTLE Analysis of Guttman Holdings—three to five concise sentences that map political, economic, social, technological, legal, and environmental forces shaping the company. Use these insights to anticipate risks and spot growth levers for investment or strategy. Purchase the full report to access the complete, actionable breakdown instantly.
Political factors
Energy policy and fuel standards
Changes in federal and state energy policies can shift demand for gasoline (~8.8 million b/d US, 2024 EIA), diesel (~3.7 million b/d) and heating oil, affecting Guttman Holdings volume mix. Stricter fuel standards (EPA Tier 3, state LCFS) and RFS biodiesel volumes (biomass-based diesel ~2.76 bn gal 2024) drive blending, sourcing and logistics changes. Policy shifts alter customer mix across commercial, industrial and government accounts. Proactive compliance preserves contract stability and margins, and LCFS credit prices (~$120/ton in 2024) materially affect profitability.
Infrastructure and transportation funding
Public investment shapes freight flows and diesel use: the 2021 Infrastructure Investment and Jobs Act commits about 550 billion USD in new spending, including roughly 110 billion for roads and bridges, directly supporting construction fuel demand. Funding cycles produce regional spikes tied to project timelines, while designated 7.5 billion for EV charging and growing rail grants can shift long-term volumes, so aligning capacity with funded projects reduces volatility.
Geopolitics and supply security
Global tensions can sharply disrupt crude and refined supply chains: OPEC and allies account for roughly 40% of world oil production, while chokepoints like the Suez Canal carry about 12% of global trade, amplifying rack-price volatility. Sanctions and shipping constraints raise availability risks and can widen regional rack spreads. Diversified suppliers and on-site or third-party storage — noting US SPR capacity of 714 million barrels — improve resilience. Transparent, timely communication with customers preserves trust during dislocations.
Government procurement dynamics
Winning public-sector fuel contracts hinges on strict compliance, competitive pricing and proven delivery reliability; public procurement accounts for about 12% of GDP across OECD countries, shaping sizable demand. Budget cycles and appropriations drive volumes and timing, while preference programs and local content rules redirect awards; a strong performance history materially improves renewal odds.
- compliance
- pricing
- reliability
- budget cycles
- local content
- performance history
Subsidies and incentives for alternatives
Incentives from the Inflation Reduction Act (about $369 billion in clean energy tax credits) and state programs are shifting demand toward renewable diesel, SAF and electrification; California LCFS credits averaged roughly $150/MT in 2024, materially improving blended fuel economics. Credits and grants at fleet level can cut operating costs and accelerate conversions, while clear policy timelines let Guttman sell compliant blends and advisory services. Active monitoring of incentive sunsets is required to avoid stranded inventory and margin erosion.
- Incentive scale: IRA $369B
- LCFS signal: ~$150/MT (2024)
- Fleet impact: lower TCO via credits/grants
- Risk: monitor sunsets to prevent stranded stock
LCFS $120–150/MT and IRA $369B accelerate renewable diesel and SAF adoption
Federal/state energy rules, LCFS (~$120–150/MT 2024) and RFS (~2.76 bn gal biodiesel 2024) shift fuel mix and margins; public contracts (≈12% GDP OECD) and IIJA roads funding (~$110B) drive diesel demand timing. Sanctions/OPEC and Suez chokepoint risks raise rack volatility; SPR ≈714M bbl buffers supply. IRA ~$369B speeds renewable diesel/SAF adoption; monitor credit sunsets.
| Metric | Value (2024/2025) |
|---|---|
| Gasoline US | 8.8M b/d (2024) |
| LCFS price | $120–150/MT (2024) |
| SPR | 714M bbl |
| IRA | $369B |
What is included in the product
Detailed Word Document
Explores how macro-environmental factors uniquely affect Guttman Holdings across Political, Economic, Social, Technological, Environmental and Legal dimensions, with region- and industry-specific data and trends. Designed for executives and investors, the analysis offers detailed sub-points, forward-looking insights and clean formatting ready for business plans, pitch decks or scenario planning.
Customizable Excel Spreadsheet
A concise, visually segmented PESTLE summary of Guttman Holdings that streamlines external risk assessment for meetings, is easily editable with region- or business-specific notes, and can be dropped into presentations or shared across teams for rapid alignment.
Economic factors
Price volatility and hedging
Crude and refined-product volatility materially affects customer budgets and margins: WTI traded roughly $60–95/barrel in 2024 and Brent averaged about $85/barrel, driving margin swings for downstream buyers. Robust risk-management and pricing strategies (fixed-price contracts, collars) increase customer stickiness by stabilizing costs. Basis and rack differentials—often moving roughly $2–10/barrel regionally—require dynamic sourcing. Hedging execution quality directly alters realized profitability and cash‑flow timing.
Interest rates and working capital
Higher rates (US fed funds 5.25–5.50% in July 2025) raise inventory and receivables carrying costs and have pushed corporate borrowing roughly 300 bps above 2021 levels, tightening credit terms and collateral requirements.
Shorter payment windows and stricter covenants force Guttman to accelerate cash conversion to maintain competitive bid pricing. Liquidity planning—holding committed lines and cash buffers—mitigates rapid raw-material price swings.
Freight, industrial, and construction cycles
Diesel demand tracks trucking, manufacturing and construction; US distillate consumption averaged about 3.6 million barrels per day in 2024 (EIA), reflecting freight and industrial activity. Regional economic disparities (Midwest vs Gulf/West) create uneven volume patterns, so scenario planning aligns fleet fueling capacity with cyclical sectors. Diversification across industries smooths revenue.
Credit risk and customer solvency
Economic downturns can lift default risk among small fleets and contractors, with industry reports in 2024 indicating contingent default spikes of roughly 30%–50% in stressed segments; rigorous credit screening and trade-credit insurance cap losses and preserve liquidity.
Flexible pricing, volume commitments and early warning fuel-management telematics (uptime/fuel anomalies) enable targeted interventions to retain at-risk accounts and reduce recovery costs.
- Default spike: ~30%–50% in stressed SMEs (2024)
- Mitigation: credit screening + trade-credit insurance
- Retention: flexible pricing & volume commitments
- Signal: fuel-management telematics for early warning
Competition and margin compression
Wholesale fuel is highly competitive with 2024 spot margins often under $0.05 per gallon; Guttman competes on reliability, logistics efficiency and data-driven services to reduce churn. Value-added fuel management can lift client margins 10–30%, offsetting price-driven losses, while continuous cost optimization preserved spreads through the 2023–24 downcycle.
- Thin spot margins: ~<$0.05/gal in 2024
- Diff: reliability, logistics, data
- Value-added: +10–30% client margin uplift
- Cost optimization: preserves spread in downturns
LCFS $120–150/MT and IRA $369B accelerate renewable diesel and SAF adoption
Energy price swings (WTI $60–95/bbl in 2024; Brent ≈$85) and Fed funds at 5.25–5.50% (Jul 2025) raise carrying costs and margin volatility. Distillate demand ~3.6 mbd (2024) links to freight/construction cycles; regional spreads drive sourcing. SME default spikes ~30–50% in stressed segments; flexible pricing, hedging and credit controls preserve liquidity and retention.
| Metric | Value |
|---|---|
| WTI (2024) | $60–95/bbl |
| Brent (2024) | $85/bbl |
| Fed funds (Jul 2025) | 5.25–5.50% |
| Distillate demand (2024) | 3.6 mbd |
| SME default spike (2024) | 30–50% |
| Spot margins (2024) | <$0.05/gal |
| Client uplift | +10–30% |
Same Document Delivered
Guttman Holdings PESTLE Analysis
The Guttman Holdings PESTLE Analysis preview shown here is the exact document you’ll receive after purchase—fully formatted and ready to use. This is a real snapshot of the product, delivered exactly as displayed with no placeholders or surprises. The layout, content, and structure visible here are what you’ll download immediately after buying.
Original: $10.00
-65%$10.00
$3.50Description
Your Competitive Advantage Starts with This Report
Unlock strategic clarity with our PESTLE Analysis of Guttman Holdings—three to five concise sentences that map political, economic, social, technological, legal, and environmental forces shaping the company. Use these insights to anticipate risks and spot growth levers for investment or strategy. Purchase the full report to access the complete, actionable breakdown instantly.
Political factors
Energy policy and fuel standards
Changes in federal and state energy policies can shift demand for gasoline (~8.8 million b/d US, 2024 EIA), diesel (~3.7 million b/d) and heating oil, affecting Guttman Holdings volume mix. Stricter fuel standards (EPA Tier 3, state LCFS) and RFS biodiesel volumes (biomass-based diesel ~2.76 bn gal 2024) drive blending, sourcing and logistics changes. Policy shifts alter customer mix across commercial, industrial and government accounts. Proactive compliance preserves contract stability and margins, and LCFS credit prices (~$120/ton in 2024) materially affect profitability.
Infrastructure and transportation funding
Public investment shapes freight flows and diesel use: the 2021 Infrastructure Investment and Jobs Act commits about 550 billion USD in new spending, including roughly 110 billion for roads and bridges, directly supporting construction fuel demand. Funding cycles produce regional spikes tied to project timelines, while designated 7.5 billion for EV charging and growing rail grants can shift long-term volumes, so aligning capacity with funded projects reduces volatility.
Geopolitics and supply security
Global tensions can sharply disrupt crude and refined supply chains: OPEC and allies account for roughly 40% of world oil production, while chokepoints like the Suez Canal carry about 12% of global trade, amplifying rack-price volatility. Sanctions and shipping constraints raise availability risks and can widen regional rack spreads. Diversified suppliers and on-site or third-party storage — noting US SPR capacity of 714 million barrels — improve resilience. Transparent, timely communication with customers preserves trust during dislocations.
Government procurement dynamics
Winning public-sector fuel contracts hinges on strict compliance, competitive pricing and proven delivery reliability; public procurement accounts for about 12% of GDP across OECD countries, shaping sizable demand. Budget cycles and appropriations drive volumes and timing, while preference programs and local content rules redirect awards; a strong performance history materially improves renewal odds.
- compliance
- pricing
- reliability
- budget cycles
- local content
- performance history
Subsidies and incentives for alternatives
Incentives from the Inflation Reduction Act (about $369 billion in clean energy tax credits) and state programs are shifting demand toward renewable diesel, SAF and electrification; California LCFS credits averaged roughly $150/MT in 2024, materially improving blended fuel economics. Credits and grants at fleet level can cut operating costs and accelerate conversions, while clear policy timelines let Guttman sell compliant blends and advisory services. Active monitoring of incentive sunsets is required to avoid stranded inventory and margin erosion.
- Incentive scale: IRA $369B
- LCFS signal: ~$150/MT (2024)
- Fleet impact: lower TCO via credits/grants
- Risk: monitor sunsets to prevent stranded stock
LCFS $120–150/MT and IRA $369B accelerate renewable diesel and SAF adoption
Federal/state energy rules, LCFS (~$120–150/MT 2024) and RFS (~2.76 bn gal biodiesel 2024) shift fuel mix and margins; public contracts (≈12% GDP OECD) and IIJA roads funding (~$110B) drive diesel demand timing. Sanctions/OPEC and Suez chokepoint risks raise rack volatility; SPR ≈714M bbl buffers supply. IRA ~$369B speeds renewable diesel/SAF adoption; monitor credit sunsets.
| Metric | Value (2024/2025) |
|---|---|
| Gasoline US | 8.8M b/d (2024) |
| LCFS price | $120–150/MT (2024) |
| SPR | 714M bbl |
| IRA | $369B |
What is included in the product
Detailed Word Document
Explores how macro-environmental factors uniquely affect Guttman Holdings across Political, Economic, Social, Technological, Environmental and Legal dimensions, with region- and industry-specific data and trends. Designed for executives and investors, the analysis offers detailed sub-points, forward-looking insights and clean formatting ready for business plans, pitch decks or scenario planning.
Customizable Excel Spreadsheet
A concise, visually segmented PESTLE summary of Guttman Holdings that streamlines external risk assessment for meetings, is easily editable with region- or business-specific notes, and can be dropped into presentations or shared across teams for rapid alignment.
Economic factors
Price volatility and hedging
Crude and refined-product volatility materially affects customer budgets and margins: WTI traded roughly $60–95/barrel in 2024 and Brent averaged about $85/barrel, driving margin swings for downstream buyers. Robust risk-management and pricing strategies (fixed-price contracts, collars) increase customer stickiness by stabilizing costs. Basis and rack differentials—often moving roughly $2–10/barrel regionally—require dynamic sourcing. Hedging execution quality directly alters realized profitability and cash‑flow timing.
Interest rates and working capital
Higher rates (US fed funds 5.25–5.50% in July 2025) raise inventory and receivables carrying costs and have pushed corporate borrowing roughly 300 bps above 2021 levels, tightening credit terms and collateral requirements.
Shorter payment windows and stricter covenants force Guttman to accelerate cash conversion to maintain competitive bid pricing. Liquidity planning—holding committed lines and cash buffers—mitigates rapid raw-material price swings.
Freight, industrial, and construction cycles
Diesel demand tracks trucking, manufacturing and construction; US distillate consumption averaged about 3.6 million barrels per day in 2024 (EIA), reflecting freight and industrial activity. Regional economic disparities (Midwest vs Gulf/West) create uneven volume patterns, so scenario planning aligns fleet fueling capacity with cyclical sectors. Diversification across industries smooths revenue.
Credit risk and customer solvency
Economic downturns can lift default risk among small fleets and contractors, with industry reports in 2024 indicating contingent default spikes of roughly 30%–50% in stressed segments; rigorous credit screening and trade-credit insurance cap losses and preserve liquidity.
Flexible pricing, volume commitments and early warning fuel-management telematics (uptime/fuel anomalies) enable targeted interventions to retain at-risk accounts and reduce recovery costs.
- Default spike: ~30%–50% in stressed SMEs (2024)
- Mitigation: credit screening + trade-credit insurance
- Retention: flexible pricing & volume commitments
- Signal: fuel-management telematics for early warning
Competition and margin compression
Wholesale fuel is highly competitive with 2024 spot margins often under $0.05 per gallon; Guttman competes on reliability, logistics efficiency and data-driven services to reduce churn. Value-added fuel management can lift client margins 10–30%, offsetting price-driven losses, while continuous cost optimization preserved spreads through the 2023–24 downcycle.
- Thin spot margins: ~<$0.05/gal in 2024
- Diff: reliability, logistics, data
- Value-added: +10–30% client margin uplift
- Cost optimization: preserves spread in downturns
LCFS $120–150/MT and IRA $369B accelerate renewable diesel and SAF adoption
Energy price swings (WTI $60–95/bbl in 2024; Brent ≈$85) and Fed funds at 5.25–5.50% (Jul 2025) raise carrying costs and margin volatility. Distillate demand ~3.6 mbd (2024) links to freight/construction cycles; regional spreads drive sourcing. SME default spikes ~30–50% in stressed segments; flexible pricing, hedging and credit controls preserve liquidity and retention.
| Metric | Value |
|---|---|
| WTI (2024) | $60–95/bbl |
| Brent (2024) | $85/bbl |
| Fed funds (Jul 2025) | 5.25–5.50% |
| Distillate demand (2024) | 3.6 mbd |
| SME default spike (2024) | 30–50% |
| Spot margins (2024) | <$0.05/gal |
| Client uplift | +10–30% |
Same Document Delivered
Guttman Holdings PESTLE Analysis
The Guttman Holdings PESTLE Analysis preview shown here is the exact document you’ll receive after purchase—fully formatted and ready to use. This is a real snapshot of the product, delivered exactly as displayed with no placeholders or surprises. The layout, content, and structure visible here are what you’ll download immediately after buying.











