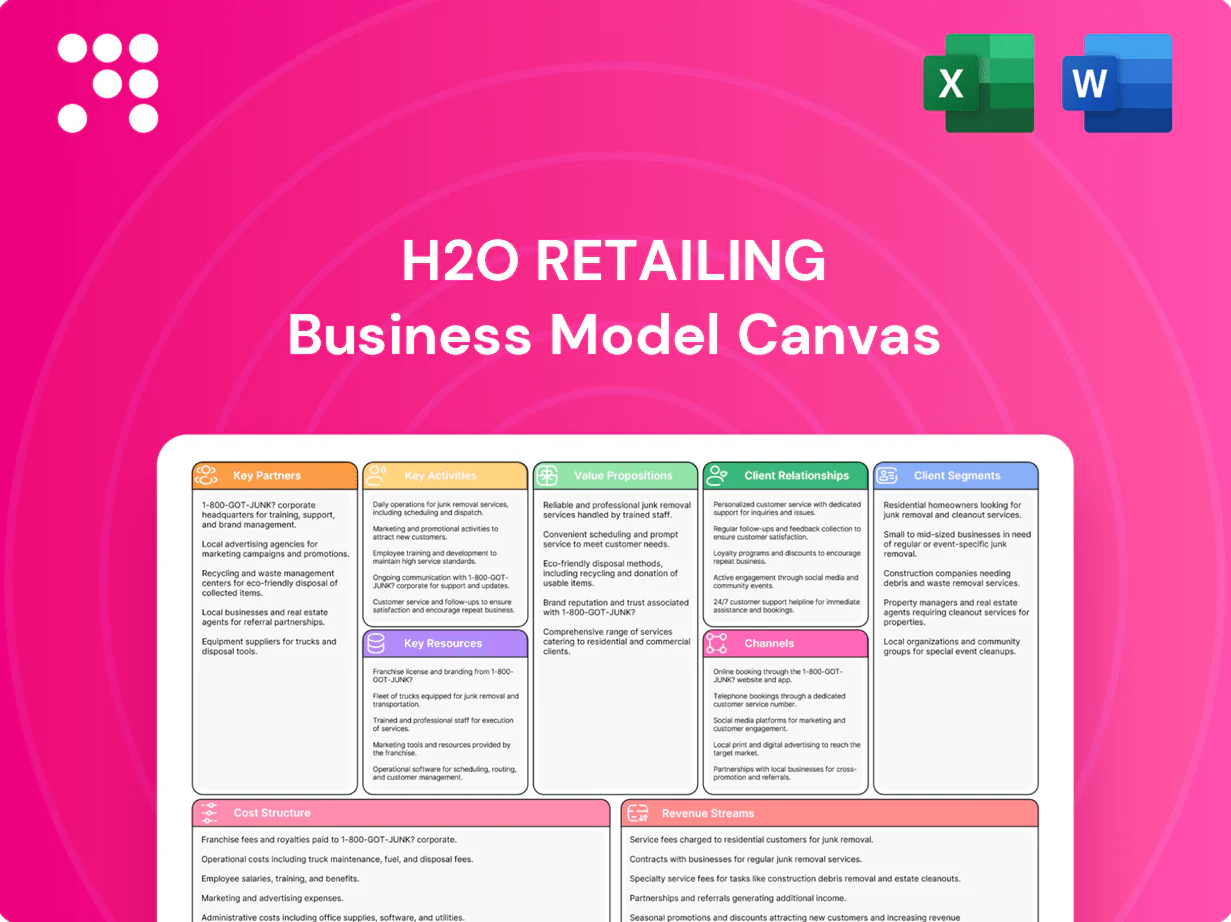
H2o Retailing Business Model Canvas

Business Model Canvas: Retail strategy, partners, value props and revenue in one view
Unlock H2o Retailing’s strategic blueprint with our concise Business Model Canvas that maps customer segments, value propositions, key partners and revenue streams in one clear view. Explore how operational strengths and growth levers combine to drive market share and margins. Purchase the full, editable Canvas to access deep, company-specific insights and a ready-to-use tool for benchmarking, planning, or investor decks.
Partnerships

Regional suppliers and premium domestic brands
Collaborations with Kansai-based producers and established Japanese brands secure fresh food, seasonal goods, and exclusive lines for H2O Retailing, leveraging a Kansai consumer base of about 22 million (2024). These partners enable distinctive assortments tailored to local tastes, boosting footfall in Hankyu and Hanshin locations. Long-term contracts improve supply stability and margin control. Joint planning drives limited editions and event-driven sales.
Global luxury and lifestyle brand principals
Direct relationships with international maisons underpin flagship shop-in-shops, leveraging the €338bn global personal luxury goods market (Bain 2024) to drive traffic. Exclusive distribution and co-marketing elevate department store prestige and ASPs. Joint merchandising calendars synchronize product launches and events for peak sell-through. Brand-led training programs ensure service standards match principal expectations.

Logistics, cold-chain, and last-mile providers
Third-party logistics partners deliver 95%+ on-time replenishment across H2o department stores and supermarkets, supporting inventory turns and 15% YoY growth in e-commerce fulfillment (2024). Cold-chain services cut perishables spoilage roughly 25%, preserving margin on fresh categories. Last-mile networks, which constitute about 50% of shipping cost, enable reliable home delivery. Seasonal surge capacity is scaled 2–3x for holidays and promotions.

Payment networks, credit issuers, and fintechs
Ties with major card networks (Visa/Mastercard account for roughly 80% of cross-border card volume) and co-branded credit partners streamline checkout and embed loyalty data, while risk analytics and underwriting bolster the in-house credit arm. BNPL and mobile wallet collaborations—with ~4.4 billion mobile wallet users in 2024—improve conversion and AOV. Data-sharing across partners reduces fraud and enables targeted offers.
- Card-networks ~80% share
- Mobile-wallet users 4.4B (2024)
- BNPL partnerships boost conversion
- Data-sharing cuts fraud, enables targeting
Property owners, railways, and tourism agencies
Alliances with property developers and rail operators secure station-adjacent sites that capture elevated commuter flows, while partnerships with tourism boards and DMOs tap inbound demand—Japan saw about 28.7 million international visitors in 2023 (JNTO), boosting tourist-led retail spend. Co-promotions bundle shopping with travel and dining; event hosting at venue partners raised seasonal footfall by double-digit percentages in comparable retail precincts.
- Station-linked locations: higher commuter footfall
- JNTO 2023: ~28.7 million international visitors
- Co-promotions: integrated travel + retail campaigns
- Event hosting: double-digit seasonal footfall lifts
Kansai supply ties and global luxury shop-ins boost traffic, ASPs and e-commerce growth
H2O Retailing secures Kansai supply ties (22M regional consumers, 2024) and global luxe shop-in-shops (€338bn market, Bain 2024) to drive traffic and ASPs. 3PL and cold-chain partners enable 95%+ on-time replenishment, 15% e-commerce fulfillment growth (2024) and ~25% spoilage reduction. Payments, BNPL and co-brands (card ~80% share; 4.4B mobile-wallet users, 2024) and station/developer deals tap tourism (28.7M visitors, JNTO 2023).
| Partner Type | KPI | Value |
|---|---|---|
| Regional suppliers | Consumer base | 22M (2024) |
| Luxury brands | Market size | €338bn (Bain 2024) |
| Logistics | On-time / e-com growth | 95%+ / 15% (2024) |
| Payments | Card / wallets | ~80% / 4.4B (2024) |
| Tourism partners | Visitors | 28.7M (JNTO 2023) |
What is included in the product
 Detailed Word Document
Comprehensive H2o Retailing Business Model Canvas detailing customer segments, channels, value propositions, key activities, resources, partners, revenue streams and cost structure, plus linked SWOT and competitive-advantage analysis for presentation and funding use.

 Customizable Excel Spreadsheet
Condenses H2O Retailing’s strategy into a digestible one-page canvas to relieve the pain of scattered planning; editable cells save hours of formatting and enable quick team collaboration for boardroom-ready deliverables.
Activities

Assortment planning and merchandising
Category management balances luxury (≈25%), lifestyle (≈35%) and daily essentials (≈40%) to match H2O Retailing shopper segments. Seasonal curation tied to local festivals and gifting occasions drives up to 20% sales uplift in peak weeks. Vendor negotiations focus on margin and exclusivity gains of 150–300 bps. Data-driven space allocation using POS analytics has improved sell-through by ≈10%.
Omnichannel retail operations
Store operations, e-commerce and click-and-collect are synchronized to streamline customer journeys, with click-and-collect adoption up 12% in 2024 supporting same-day pickup; inventory visibility and ship-from-store reduce stockouts and boost SKU availability across channels. Consistent service standards and visual merchandising protect brand equity, while peak management aligns staffing to traffic patterns to contain labor costs and preserve conversion rates.

Loyalty, CRM, and data analytics
Unified IDs and point programs link department stores, supermarkets and restaurants, driving cross-channel spend and supporting a loyalty base of over 100 million program memberships in Japan (2023). Segmentation enables personalized offers and events, boosting redemption rates and engagement. Analytics inform pricing, promotions and assortment while churn prevention and lifetime-value tracking guide targeted investment and retention spend.

In-house credit and payments
In-house credit issues and billing drive customer spend and retention; in 2024 H2O Retailing reported a double-digit increase in card-led transactions, supporting a growing receivables book while collections kept delinquencies low.
Risk scoring and compliance preserve portfolio quality; co-branded campaigns lifted in-store and online usage, and robust dispute resolution sustained trust and satisfaction.
- Credit issuance
- Billing & collections
- Risk scoring & compliance
- Co-branded campaigns
- Dispute resolution
Tenant and F&B concept management
Leasing and revenue-sharing models are used to optimize tenant mix and maximize per-sqm yields, while restaurant concepts and rotating food halls are refreshed to match 2024 consumer trends toward experiential dining. Regular operational audits enforce quality and hygiene standards, and targeted event programming raises dwell time and basket size.
- Leasing + rev-share: tenant mix, yield focus
- Food halls: trend-driven refreshes
- Operational audits: quality & hygiene
- Events: increase dwell time & spend
Omnichannel boost: click-and-collect +12%, loyalty 100M+, vendor lift 150–300 bps
Category mix: luxury 25%, lifestyle 35%, essentials 40%; seasonal curation drives ≈20% peak-week uplift. Omnichannel ops: click-and-collect +12% (2024), ship-from-store cuts stockouts; POS analytics lifted sell-through ≈10%. Loyalty >100M members (2023); card-led transactions rose double-digit (2024); vendor deals add 150–300 bps margin.
| Metric | 2023/24 |
|---|---|
| Loyalty | 100M+ |
| Click-&-Collect | +12% (2024) |
| Sell-through | +≈10% |
| Vendor margin lift | 150–300 bps |
Delivered as Displayed
Business Model Canvas
The Business Model Canvas previewed here for H2o Retailing is the exact document you’ll receive—no mockups or samples. Upon purchase you’ll get the full, editable file formatted identically for immediate use in presentations and planning. What you see is what you’ll own.

Business Model Canvas: Retail strategy, partners, value props and revenue in one view
Unlock H2o Retailing’s strategic blueprint with our concise Business Model Canvas that maps customer segments, value propositions, key partners and revenue streams in one clear view. Explore how operational strengths and growth levers combine to drive market share and margins. Purchase the full, editable Canvas to access deep, company-specific insights and a ready-to-use tool for benchmarking, planning, or investor decks.
Partnerships
Regional suppliers and premium domestic brands
Collaborations with Kansai-based producers and established Japanese brands secure fresh food, seasonal goods, and exclusive lines for H2O Retailing, leveraging a Kansai consumer base of about 22 million (2024). These partners enable distinctive assortments tailored to local tastes, boosting footfall in Hankyu and Hanshin locations. Long-term contracts improve supply stability and margin control. Joint planning drives limited editions and event-driven sales.
Global luxury and lifestyle brand principals
Direct relationships with international maisons underpin flagship shop-in-shops, leveraging the €338bn global personal luxury goods market (Bain 2024) to drive traffic. Exclusive distribution and co-marketing elevate department store prestige and ASPs. Joint merchandising calendars synchronize product launches and events for peak sell-through. Brand-led training programs ensure service standards match principal expectations.
Logistics, cold-chain, and last-mile providers
Third-party logistics partners deliver 95%+ on-time replenishment across H2o department stores and supermarkets, supporting inventory turns and 15% YoY growth in e-commerce fulfillment (2024). Cold-chain services cut perishables spoilage roughly 25%, preserving margin on fresh categories. Last-mile networks, which constitute about 50% of shipping cost, enable reliable home delivery. Seasonal surge capacity is scaled 2–3x for holidays and promotions.
Payment networks, credit issuers, and fintechs
Ties with major card networks (Visa/Mastercard account for roughly 80% of cross-border card volume) and co-branded credit partners streamline checkout and embed loyalty data, while risk analytics and underwriting bolster the in-house credit arm. BNPL and mobile wallet collaborations—with ~4.4 billion mobile wallet users in 2024—improve conversion and AOV. Data-sharing across partners reduces fraud and enables targeted offers.
- Card-networks ~80% share
- Mobile-wallet users 4.4B (2024)
- BNPL partnerships boost conversion
- Data-sharing cuts fraud, enables targeting
Property owners, railways, and tourism agencies
Alliances with property developers and rail operators secure station-adjacent sites that capture elevated commuter flows, while partnerships with tourism boards and DMOs tap inbound demand—Japan saw about 28.7 million international visitors in 2023 (JNTO), boosting tourist-led retail spend. Co-promotions bundle shopping with travel and dining; event hosting at venue partners raised seasonal footfall by double-digit percentages in comparable retail precincts.
- Station-linked locations: higher commuter footfall
- JNTO 2023: ~28.7 million international visitors
- Co-promotions: integrated travel + retail campaigns
- Event hosting: double-digit seasonal footfall lifts
Kansai supply ties and global luxury shop-ins boost traffic, ASPs and e-commerce growth
H2O Retailing secures Kansai supply ties (22M regional consumers, 2024) and global luxe shop-in-shops (€338bn market, Bain 2024) to drive traffic and ASPs. 3PL and cold-chain partners enable 95%+ on-time replenishment, 15% e-commerce fulfillment growth (2024) and ~25% spoilage reduction. Payments, BNPL and co-brands (card ~80% share; 4.4B mobile-wallet users, 2024) and station/developer deals tap tourism (28.7M visitors, JNTO 2023).
| Partner Type | KPI | Value |
|---|---|---|
| Regional suppliers | Consumer base | 22M (2024) |
| Luxury brands | Market size | €338bn (Bain 2024) |
| Logistics | On-time / e-com growth | 95%+ / 15% (2024) |
| Payments | Card / wallets | ~80% / 4.4B (2024) |
| Tourism partners | Visitors | 28.7M (JNTO 2023) |
What is included in the product
Detailed Word Document
Comprehensive H2o Retailing Business Model Canvas detailing customer segments, channels, value propositions, key activities, resources, partners, revenue streams and cost structure, plus linked SWOT and competitive-advantage analysis for presentation and funding use.
Customizable Excel Spreadsheet
Condenses H2O Retailing’s strategy into a digestible one-page canvas to relieve the pain of scattered planning; editable cells save hours of formatting and enable quick team collaboration for boardroom-ready deliverables.
Activities
Assortment planning and merchandising
Category management balances luxury (≈25%), lifestyle (≈35%) and daily essentials (≈40%) to match H2O Retailing shopper segments. Seasonal curation tied to local festivals and gifting occasions drives up to 20% sales uplift in peak weeks. Vendor negotiations focus on margin and exclusivity gains of 150–300 bps. Data-driven space allocation using POS analytics has improved sell-through by ≈10%.
Omnichannel retail operations
Store operations, e-commerce and click-and-collect are synchronized to streamline customer journeys, with click-and-collect adoption up 12% in 2024 supporting same-day pickup; inventory visibility and ship-from-store reduce stockouts and boost SKU availability across channels. Consistent service standards and visual merchandising protect brand equity, while peak management aligns staffing to traffic patterns to contain labor costs and preserve conversion rates.
Loyalty, CRM, and data analytics
Unified IDs and point programs link department stores, supermarkets and restaurants, driving cross-channel spend and supporting a loyalty base of over 100 million program memberships in Japan (2023). Segmentation enables personalized offers and events, boosting redemption rates and engagement. Analytics inform pricing, promotions and assortment while churn prevention and lifetime-value tracking guide targeted investment and retention spend.
In-house credit and payments
In-house credit issues and billing drive customer spend and retention; in 2024 H2O Retailing reported a double-digit increase in card-led transactions, supporting a growing receivables book while collections kept delinquencies low.
Risk scoring and compliance preserve portfolio quality; co-branded campaigns lifted in-store and online usage, and robust dispute resolution sustained trust and satisfaction.
- Credit issuance
- Billing & collections
- Risk scoring & compliance
- Co-branded campaigns
- Dispute resolution
Tenant and F&B concept management
Leasing and revenue-sharing models are used to optimize tenant mix and maximize per-sqm yields, while restaurant concepts and rotating food halls are refreshed to match 2024 consumer trends toward experiential dining. Regular operational audits enforce quality and hygiene standards, and targeted event programming raises dwell time and basket size.
- Leasing + rev-share: tenant mix, yield focus
- Food halls: trend-driven refreshes
- Operational audits: quality & hygiene
- Events: increase dwell time & spend
Omnichannel boost: click-and-collect +12%, loyalty 100M+, vendor lift 150–300 bps
Category mix: luxury 25%, lifestyle 35%, essentials 40%; seasonal curation drives ≈20% peak-week uplift. Omnichannel ops: click-and-collect +12% (2024), ship-from-store cuts stockouts; POS analytics lifted sell-through ≈10%. Loyalty >100M members (2023); card-led transactions rose double-digit (2024); vendor deals add 150–300 bps margin.
| Metric | 2023/24 |
|---|---|
| Loyalty | 100M+ |
| Click-&-Collect | +12% (2024) |
| Sell-through | +≈10% |
| Vendor margin lift | 150–300 bps |
Delivered as Displayed
Business Model Canvas
The Business Model Canvas previewed here for H2o Retailing is the exact document you’ll receive—no mockups or samples. Upon purchase you’ll get the full, editable file formatted identically for immediate use in presentations and planning. What you see is what you’ll own.
Original: $10.00
-65%$10.00
$3.50Description
Business Model Canvas: Retail strategy, partners, value props and revenue in one view
Unlock H2o Retailing’s strategic blueprint with our concise Business Model Canvas that maps customer segments, value propositions, key partners and revenue streams in one clear view. Explore how operational strengths and growth levers combine to drive market share and margins. Purchase the full, editable Canvas to access deep, company-specific insights and a ready-to-use tool for benchmarking, planning, or investor decks.
Partnerships
Regional suppliers and premium domestic brands
Collaborations with Kansai-based producers and established Japanese brands secure fresh food, seasonal goods, and exclusive lines for H2O Retailing, leveraging a Kansai consumer base of about 22 million (2024). These partners enable distinctive assortments tailored to local tastes, boosting footfall in Hankyu and Hanshin locations. Long-term contracts improve supply stability and margin control. Joint planning drives limited editions and event-driven sales.
Global luxury and lifestyle brand principals
Direct relationships with international maisons underpin flagship shop-in-shops, leveraging the €338bn global personal luxury goods market (Bain 2024) to drive traffic. Exclusive distribution and co-marketing elevate department store prestige and ASPs. Joint merchandising calendars synchronize product launches and events for peak sell-through. Brand-led training programs ensure service standards match principal expectations.
Logistics, cold-chain, and last-mile providers
Third-party logistics partners deliver 95%+ on-time replenishment across H2o department stores and supermarkets, supporting inventory turns and 15% YoY growth in e-commerce fulfillment (2024). Cold-chain services cut perishables spoilage roughly 25%, preserving margin on fresh categories. Last-mile networks, which constitute about 50% of shipping cost, enable reliable home delivery. Seasonal surge capacity is scaled 2–3x for holidays and promotions.
Payment networks, credit issuers, and fintechs
Ties with major card networks (Visa/Mastercard account for roughly 80% of cross-border card volume) and co-branded credit partners streamline checkout and embed loyalty data, while risk analytics and underwriting bolster the in-house credit arm. BNPL and mobile wallet collaborations—with ~4.4 billion mobile wallet users in 2024—improve conversion and AOV. Data-sharing across partners reduces fraud and enables targeted offers.
- Card-networks ~80% share
- Mobile-wallet users 4.4B (2024)
- BNPL partnerships boost conversion
- Data-sharing cuts fraud, enables targeting
Property owners, railways, and tourism agencies
Alliances with property developers and rail operators secure station-adjacent sites that capture elevated commuter flows, while partnerships with tourism boards and DMOs tap inbound demand—Japan saw about 28.7 million international visitors in 2023 (JNTO), boosting tourist-led retail spend. Co-promotions bundle shopping with travel and dining; event hosting at venue partners raised seasonal footfall by double-digit percentages in comparable retail precincts.
- Station-linked locations: higher commuter footfall
- JNTO 2023: ~28.7 million international visitors
- Co-promotions: integrated travel + retail campaigns
- Event hosting: double-digit seasonal footfall lifts
Kansai supply ties and global luxury shop-ins boost traffic, ASPs and e-commerce growth
H2O Retailing secures Kansai supply ties (22M regional consumers, 2024) and global luxe shop-in-shops (€338bn market, Bain 2024) to drive traffic and ASPs. 3PL and cold-chain partners enable 95%+ on-time replenishment, 15% e-commerce fulfillment growth (2024) and ~25% spoilage reduction. Payments, BNPL and co-brands (card ~80% share; 4.4B mobile-wallet users, 2024) and station/developer deals tap tourism (28.7M visitors, JNTO 2023).
| Partner Type | KPI | Value |
|---|---|---|
| Regional suppliers | Consumer base | 22M (2024) |
| Luxury brands | Market size | €338bn (Bain 2024) |
| Logistics | On-time / e-com growth | 95%+ / 15% (2024) |
| Payments | Card / wallets | ~80% / 4.4B (2024) |
| Tourism partners | Visitors | 28.7M (JNTO 2023) |
What is included in the product
Detailed Word Document
Comprehensive H2o Retailing Business Model Canvas detailing customer segments, channels, value propositions, key activities, resources, partners, revenue streams and cost structure, plus linked SWOT and competitive-advantage analysis for presentation and funding use.
Customizable Excel Spreadsheet
Condenses H2O Retailing’s strategy into a digestible one-page canvas to relieve the pain of scattered planning; editable cells save hours of formatting and enable quick team collaboration for boardroom-ready deliverables.
Activities
Assortment planning and merchandising
Category management balances luxury (≈25%), lifestyle (≈35%) and daily essentials (≈40%) to match H2O Retailing shopper segments. Seasonal curation tied to local festivals and gifting occasions drives up to 20% sales uplift in peak weeks. Vendor negotiations focus on margin and exclusivity gains of 150–300 bps. Data-driven space allocation using POS analytics has improved sell-through by ≈10%.
Omnichannel retail operations
Store operations, e-commerce and click-and-collect are synchronized to streamline customer journeys, with click-and-collect adoption up 12% in 2024 supporting same-day pickup; inventory visibility and ship-from-store reduce stockouts and boost SKU availability across channels. Consistent service standards and visual merchandising protect brand equity, while peak management aligns staffing to traffic patterns to contain labor costs and preserve conversion rates.
Loyalty, CRM, and data analytics
Unified IDs and point programs link department stores, supermarkets and restaurants, driving cross-channel spend and supporting a loyalty base of over 100 million program memberships in Japan (2023). Segmentation enables personalized offers and events, boosting redemption rates and engagement. Analytics inform pricing, promotions and assortment while churn prevention and lifetime-value tracking guide targeted investment and retention spend.
In-house credit and payments
In-house credit issues and billing drive customer spend and retention; in 2024 H2O Retailing reported a double-digit increase in card-led transactions, supporting a growing receivables book while collections kept delinquencies low.
Risk scoring and compliance preserve portfolio quality; co-branded campaigns lifted in-store and online usage, and robust dispute resolution sustained trust and satisfaction.
- Credit issuance
- Billing & collections
- Risk scoring & compliance
- Co-branded campaigns
- Dispute resolution
Tenant and F&B concept management
Leasing and revenue-sharing models are used to optimize tenant mix and maximize per-sqm yields, while restaurant concepts and rotating food halls are refreshed to match 2024 consumer trends toward experiential dining. Regular operational audits enforce quality and hygiene standards, and targeted event programming raises dwell time and basket size.
- Leasing + rev-share: tenant mix, yield focus
- Food halls: trend-driven refreshes
- Operational audits: quality & hygiene
- Events: increase dwell time & spend
Omnichannel boost: click-and-collect +12%, loyalty 100M+, vendor lift 150–300 bps
Category mix: luxury 25%, lifestyle 35%, essentials 40%; seasonal curation drives ≈20% peak-week uplift. Omnichannel ops: click-and-collect +12% (2024), ship-from-store cuts stockouts; POS analytics lifted sell-through ≈10%. Loyalty >100M members (2023); card-led transactions rose double-digit (2024); vendor deals add 150–300 bps margin.
| Metric | 2023/24 |
|---|---|
| Loyalty | 100M+ |
| Click-&-Collect | +12% (2024) |
| Sell-through | +≈10% |
| Vendor margin lift | 150–300 bps |
Delivered as Displayed
Business Model Canvas
The Business Model Canvas previewed here for H2o Retailing is the exact document you’ll receive—no mockups or samples. Upon purchase you’ll get the full, editable file formatted identically for immediate use in presentations and planning. What you see is what you’ll own.











