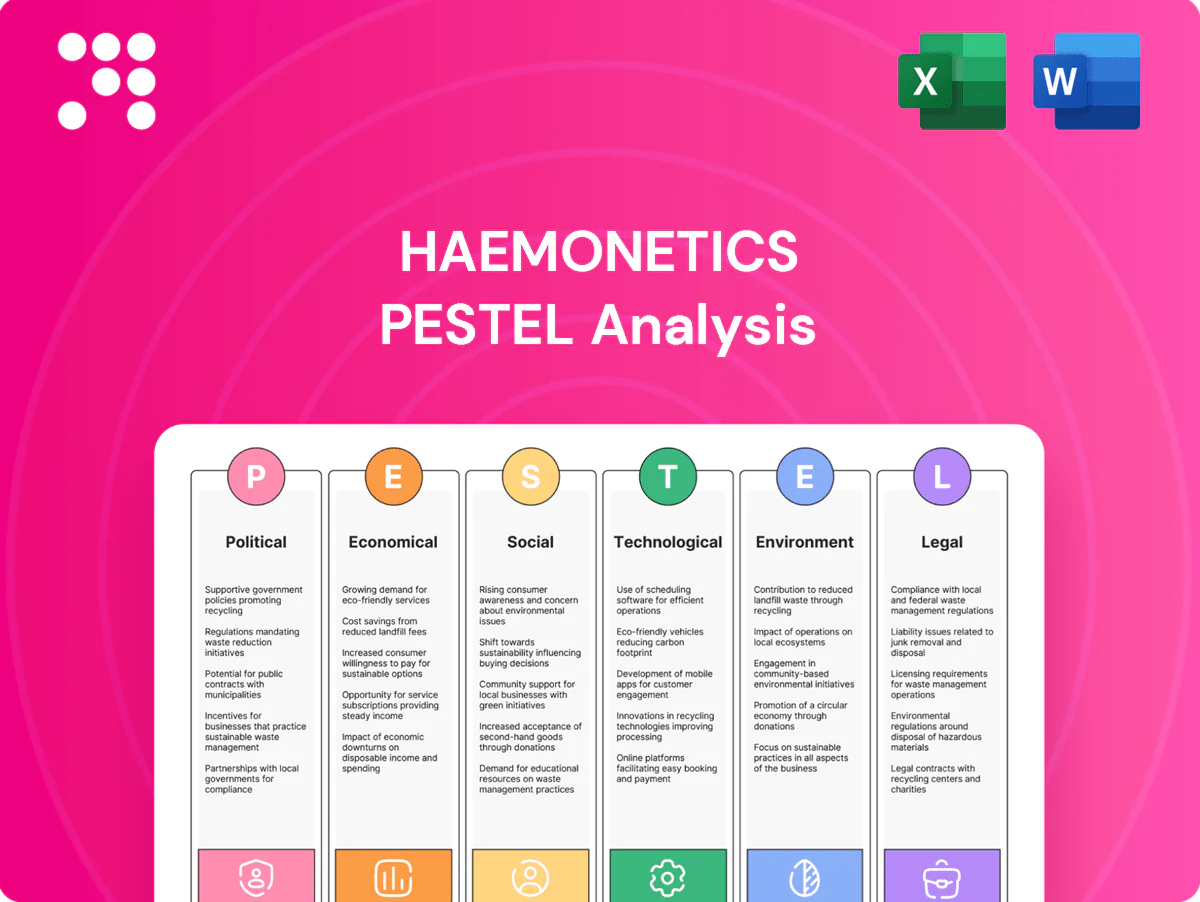
Haemonetics PESTLE Analysis

Your Competitive Advantage Starts with This Report
Gain a strategic advantage with our PESTLE analysis of Haemonetics — concise, actionable insights on political, economic, social, technological, legal and environmental forces shaping its growth. Ideal for investors and strategists, this report highlights risks and opportunities. Purchase the full analysis to download the complete, editable dossier instantly.
Political factors

Healthcare policy shifts
Shifts in national health priorities affect funding for blood and plasma services; US national health expenditures reached about 4.5 trillion USD in 2023, influencing public budgets for transfusion infrastructure. Policy emphasis on value-based care and cost-outcome metrics favors technologies that reduce waste and improve outcomes. Haemonetics, with roughly 1.14 billion USD revenue in 2024, must align products to the ~36 billion USD global plasma market to sustain demand.
Reimbursement and coverage
Public and private payer decisions shape uptake of Haemonetics collection and processing technologies, with US Medicare covering about 65 million beneficiaries in 2024 so payer policy changes affect large volumes of care. Adjustments to procedure codes or tariffs (eg CPT/DRG updates) can materially accelerate or hinder device sales by changing hospital reimbursement economics. Close engagement with HTA bodies (NICE, IQWiG) and major payers reduces reimbursement uncertainty and shortens time to market adoption.

Regulatory oversight of blood safety
Tighter government standards for donor screening and pathogen-reduction technologies are increasing, driven by global blood volumes of 118.5 million donations (WHO) and about 21 million transfusions annually in the US (AABB), boosting demand for advanced safety systems. Higher safety requirements enlarge addressable markets for devices but raise compliance and capital costs for suppliers and blood centers. Vendors that proactively meet new regulatory benchmarks are often chosen as preferred solutions by hospitals and national blood services.

Government procurement and tenders
Many blood centers and hospitals procure devices and services through public tenders, and public procurement accounts for approximately 15% of global GDP according to World Bank estimates; criteria such as cost, local content requirements and total lifecycle value strongly influence competitiveness. Building local partnerships and supplying evidence of total cost savings and lower lifecycle costs improves tender success for suppliers like Haemonetics. Increasingly, tenders prioritize demonstrable long-term value over upfront price.
Trade, tariffs, and geopolitical risk
Cross-border supply of Haemonetics devices and disposables faces variable tariffs and customs procedures; US Section 301 tariffs affecting roughly 370 billion USD of Chinese goods persist, creating tariff risk. Geopolitical tensions (US-China, Russia-Ukraine) disrupt logistics and raise freight/insurance costs. Diversified manufacturing and regional inventories cut exposure and shorten lead times.
- Tariff exposure: US Section 301 ~370B USD
- Logistics risk: geopolitical disruptions raise freight/insurance
- Mitigant: diversified manufacturing
- Mitigant: regional inventories
Value-based care and donor-safety drive blood services; US spend 4.5T USD
Shifts in national health priorities and value-based care reshape funding for blood services; US health spend was ~4.5 trillion USD in 2023, affecting budgets. Payer and HTA decisions (Medicare ~65M enrollees in 2024) drive device uptake and reimbursement. Tighter donor-screening and safety rules (WHO 118.5M donations) expand demand but raise compliance costs.
| Metric | Value |
|---|---|
| Haemonetics revenue 2024 | 1.14B USD |
| Global plasma market | ~36B USD |
| WHO blood donations | 118.5M |
What is included in the product
 Detailed Word Document
Explores how external macro-environmental factors uniquely affect Haemonetics across Political, Economic, Social, Technological, Environmental and Legal dimensions. Each section is data-backed with forward-looking insights tailored to help executives, consultants and investors identify risks, opportunities and actionable strategic responses.

 Customizable Excel Spreadsheet
Condenses Haemonetics' PESTLE into a clean, visually segmented brief that teams can drop into presentations or share for quick alignment, helping stakeholders rapidly assess external risks and strategic positioning.
Economic factors

Healthcare budget cycles
Capital equipment purchases at Haemonetics hinge on hospital and blood center budget cycles, with fiscal constraints commonly delaying upgrades while stimulus funding can trigger modernization—eg, the 2020 CARES Act allocated about 175 billion for provider relief. Flexible financing options and clear ROI evidence help smooth demand timing. Vendors showing payback timelines accelerate procurement decisions in constrained cycles.
Macroeconomic volatility
Macroeconomic volatility pressures Haemonetics as 2024 US CPI averaged 3.4%, raising raw-material and logistics costs and testing pricing power in sensitive markets. FX swings, notably a stronger dollar in 2024, compress international revenue on repatriation and raise costs for imported components. Hedging strategies and increased localized sourcing across Europe and APAC are deployed to protect margins and stabilize input costs.

Plasma industry growth dynamics
Plasma collection volumes directly drive consumables demand, supporting a global plasma-derived therapeutics market that exceeded $30 billion in 2024. US donors supply roughly 60% of global plasma (PPTA 2023), so donor compensation economics and center expansion cycles materially affect throughput. Scalable collection systems that raise yield per session enable faster capture of growth phases and higher consumable utilization.

Industry consolidation
Industry consolidation centralizes purchasing: large hospital systems and GPOs (Vizient reports >3,500 member organizations as of 2024) drive platform selection, enabling negotiation of lower unit prices but favoring standardized devices and supply chains. Haemonetics that demonstrate measurable efficiency and cost-per-procedure savings can secure system-wide contracts across consolidated networks. Consolidation in plasma and hospital networks increases contract size and switching costs, raising the value of platform-level wins.
- Consolidation effect: centralized purchasing, higher bargaining power
- Key fact: Vizient >3,500 members (2024)
- Win condition: proven efficiency → system-wide contracts
- Risk: higher switching costs; preference for preferred platforms
Interest rates and capital access
Higher benchmark rates (Federal funds 5.25–5.50% as of July 2025) increase customer cost of capital and can delay capital expenditure, while vendor financing and subscription models help preserve device adoption and recurring revenue. Haemonetics’ strong balance sheet enables continued R&D spend and strategic M&A even as borrowing costs remain elevated.
- Higher rates: Fed 5.25–5.50% (Jul 2025)
- Mitigants: vendor finance, subscription models
- Advantage: strong balance sheet funds R&D/M&A
Value-based care and donor-safety drive blood services; US spend 4.5T USD
Hospital capital cycles and higher rates slow device upgrades, while vendor financing and subscription models sustain adoption; Fed funds 5.25–5.50% (Jul 2025). Inflation (US CPI 2024 3.4%) and FX volatility pressure margins; hedging and local sourcing mitigate. Plasma volumes drive consumable revenue—global plasma market >$30B (2024); US supplies ~60% of plasma.
| Metric | Value |
|---|---|
| Fed funds (Jul 2025) | 5.25–5.50% |
| US CPI (2024) | 3.4% |
| Global plasma market (2024) | >$30B |
| US share of plasma (PPTA 2023) | ~60% |
| Vizient members (2024) | >3,500 |
Full Version Awaits
Haemonetics PESTLE Analysis
The Haemonetics PESTLE Analysis preview shown here is the exact document you’ll receive after purchase—fully formatted and ready to use. The layout, content, and structure visible in this sample match the final file you’ll download immediately after payment. No placeholders or teasers—this is the real, professionally structured report you’ll own upon checkout.

Your Competitive Advantage Starts with This Report
Gain a strategic advantage with our PESTLE analysis of Haemonetics — concise, actionable insights on political, economic, social, technological, legal and environmental forces shaping its growth. Ideal for investors and strategists, this report highlights risks and opportunities. Purchase the full analysis to download the complete, editable dossier instantly.
Political factors
Healthcare policy shifts
Shifts in national health priorities affect funding for blood and plasma services; US national health expenditures reached about 4.5 trillion USD in 2023, influencing public budgets for transfusion infrastructure. Policy emphasis on value-based care and cost-outcome metrics favors technologies that reduce waste and improve outcomes. Haemonetics, with roughly 1.14 billion USD revenue in 2024, must align products to the ~36 billion USD global plasma market to sustain demand.
Reimbursement and coverage
Public and private payer decisions shape uptake of Haemonetics collection and processing technologies, with US Medicare covering about 65 million beneficiaries in 2024 so payer policy changes affect large volumes of care. Adjustments to procedure codes or tariffs (eg CPT/DRG updates) can materially accelerate or hinder device sales by changing hospital reimbursement economics. Close engagement with HTA bodies (NICE, IQWiG) and major payers reduces reimbursement uncertainty and shortens time to market adoption.
Regulatory oversight of blood safety
Tighter government standards for donor screening and pathogen-reduction technologies are increasing, driven by global blood volumes of 118.5 million donations (WHO) and about 21 million transfusions annually in the US (AABB), boosting demand for advanced safety systems. Higher safety requirements enlarge addressable markets for devices but raise compliance and capital costs for suppliers and blood centers. Vendors that proactively meet new regulatory benchmarks are often chosen as preferred solutions by hospitals and national blood services.
Government procurement and tenders
Many blood centers and hospitals procure devices and services through public tenders, and public procurement accounts for approximately 15% of global GDP according to World Bank estimates; criteria such as cost, local content requirements and total lifecycle value strongly influence competitiveness. Building local partnerships and supplying evidence of total cost savings and lower lifecycle costs improves tender success for suppliers like Haemonetics. Increasingly, tenders prioritize demonstrable long-term value over upfront price.
Trade, tariffs, and geopolitical risk
Cross-border supply of Haemonetics devices and disposables faces variable tariffs and customs procedures; US Section 301 tariffs affecting roughly 370 billion USD of Chinese goods persist, creating tariff risk. Geopolitical tensions (US-China, Russia-Ukraine) disrupt logistics and raise freight/insurance costs. Diversified manufacturing and regional inventories cut exposure and shorten lead times.
- Tariff exposure: US Section 301 ~370B USD
- Logistics risk: geopolitical disruptions raise freight/insurance
- Mitigant: diversified manufacturing
- Mitigant: regional inventories
Value-based care and donor-safety drive blood services; US spend 4.5T USD
Shifts in national health priorities and value-based care reshape funding for blood services; US health spend was ~4.5 trillion USD in 2023, affecting budgets. Payer and HTA decisions (Medicare ~65M enrollees in 2024) drive device uptake and reimbursement. Tighter donor-screening and safety rules (WHO 118.5M donations) expand demand but raise compliance costs.
| Metric | Value |
|---|---|
| Haemonetics revenue 2024 | 1.14B USD |
| Global plasma market | ~36B USD |
| WHO blood donations | 118.5M |
What is included in the product
Detailed Word Document
Explores how external macro-environmental factors uniquely affect Haemonetics across Political, Economic, Social, Technological, Environmental and Legal dimensions. Each section is data-backed with forward-looking insights tailored to help executives, consultants and investors identify risks, opportunities and actionable strategic responses.
Customizable Excel Spreadsheet
Condenses Haemonetics' PESTLE into a clean, visually segmented brief that teams can drop into presentations or share for quick alignment, helping stakeholders rapidly assess external risks and strategic positioning.
Economic factors
Healthcare budget cycles
Capital equipment purchases at Haemonetics hinge on hospital and blood center budget cycles, with fiscal constraints commonly delaying upgrades while stimulus funding can trigger modernization—eg, the 2020 CARES Act allocated about 175 billion for provider relief. Flexible financing options and clear ROI evidence help smooth demand timing. Vendors showing payback timelines accelerate procurement decisions in constrained cycles.
Macroeconomic volatility
Macroeconomic volatility pressures Haemonetics as 2024 US CPI averaged 3.4%, raising raw-material and logistics costs and testing pricing power in sensitive markets. FX swings, notably a stronger dollar in 2024, compress international revenue on repatriation and raise costs for imported components. Hedging strategies and increased localized sourcing across Europe and APAC are deployed to protect margins and stabilize input costs.
Plasma industry growth dynamics
Plasma collection volumes directly drive consumables demand, supporting a global plasma-derived therapeutics market that exceeded $30 billion in 2024. US donors supply roughly 60% of global plasma (PPTA 2023), so donor compensation economics and center expansion cycles materially affect throughput. Scalable collection systems that raise yield per session enable faster capture of growth phases and higher consumable utilization.
Industry consolidation
Industry consolidation centralizes purchasing: large hospital systems and GPOs (Vizient reports >3,500 member organizations as of 2024) drive platform selection, enabling negotiation of lower unit prices but favoring standardized devices and supply chains. Haemonetics that demonstrate measurable efficiency and cost-per-procedure savings can secure system-wide contracts across consolidated networks. Consolidation in plasma and hospital networks increases contract size and switching costs, raising the value of platform-level wins.
- Consolidation effect: centralized purchasing, higher bargaining power
- Key fact: Vizient >3,500 members (2024)
- Win condition: proven efficiency → system-wide contracts
- Risk: higher switching costs; preference for preferred platforms
Interest rates and capital access
Higher benchmark rates (Federal funds 5.25–5.50% as of July 2025) increase customer cost of capital and can delay capital expenditure, while vendor financing and subscription models help preserve device adoption and recurring revenue. Haemonetics’ strong balance sheet enables continued R&D spend and strategic M&A even as borrowing costs remain elevated.
- Higher rates: Fed 5.25–5.50% (Jul 2025)
- Mitigants: vendor finance, subscription models
- Advantage: strong balance sheet funds R&D/M&A
Value-based care and donor-safety drive blood services; US spend 4.5T USD
Hospital capital cycles and higher rates slow device upgrades, while vendor financing and subscription models sustain adoption; Fed funds 5.25–5.50% (Jul 2025). Inflation (US CPI 2024 3.4%) and FX volatility pressure margins; hedging and local sourcing mitigate. Plasma volumes drive consumable revenue—global plasma market >$30B (2024); US supplies ~60% of plasma.
| Metric | Value |
|---|---|
| Fed funds (Jul 2025) | 5.25–5.50% |
| US CPI (2024) | 3.4% |
| Global plasma market (2024) | >$30B |
| US share of plasma (PPTA 2023) | ~60% |
| Vizient members (2024) | >3,500 |
Full Version Awaits
Haemonetics PESTLE Analysis
The Haemonetics PESTLE Analysis preview shown here is the exact document you’ll receive after purchase—fully formatted and ready to use. The layout, content, and structure visible in this sample match the final file you’ll download immediately after payment. No placeholders or teasers—this is the real, professionally structured report you’ll own upon checkout.
Description
Your Competitive Advantage Starts with This Report
Gain a strategic advantage with our PESTLE analysis of Haemonetics — concise, actionable insights on political, economic, social, technological, legal and environmental forces shaping its growth. Ideal for investors and strategists, this report highlights risks and opportunities. Purchase the full analysis to download the complete, editable dossier instantly.
Political factors
Healthcare policy shifts
Shifts in national health priorities affect funding for blood and plasma services; US national health expenditures reached about 4.5 trillion USD in 2023, influencing public budgets for transfusion infrastructure. Policy emphasis on value-based care and cost-outcome metrics favors technologies that reduce waste and improve outcomes. Haemonetics, with roughly 1.14 billion USD revenue in 2024, must align products to the ~36 billion USD global plasma market to sustain demand.
Reimbursement and coverage
Public and private payer decisions shape uptake of Haemonetics collection and processing technologies, with US Medicare covering about 65 million beneficiaries in 2024 so payer policy changes affect large volumes of care. Adjustments to procedure codes or tariffs (eg CPT/DRG updates) can materially accelerate or hinder device sales by changing hospital reimbursement economics. Close engagement with HTA bodies (NICE, IQWiG) and major payers reduces reimbursement uncertainty and shortens time to market adoption.
Regulatory oversight of blood safety
Tighter government standards for donor screening and pathogen-reduction technologies are increasing, driven by global blood volumes of 118.5 million donations (WHO) and about 21 million transfusions annually in the US (AABB), boosting demand for advanced safety systems. Higher safety requirements enlarge addressable markets for devices but raise compliance and capital costs for suppliers and blood centers. Vendors that proactively meet new regulatory benchmarks are often chosen as preferred solutions by hospitals and national blood services.
Government procurement and tenders
Many blood centers and hospitals procure devices and services through public tenders, and public procurement accounts for approximately 15% of global GDP according to World Bank estimates; criteria such as cost, local content requirements and total lifecycle value strongly influence competitiveness. Building local partnerships and supplying evidence of total cost savings and lower lifecycle costs improves tender success for suppliers like Haemonetics. Increasingly, tenders prioritize demonstrable long-term value over upfront price.
Trade, tariffs, and geopolitical risk
Cross-border supply of Haemonetics devices and disposables faces variable tariffs and customs procedures; US Section 301 tariffs affecting roughly 370 billion USD of Chinese goods persist, creating tariff risk. Geopolitical tensions (US-China, Russia-Ukraine) disrupt logistics and raise freight/insurance costs. Diversified manufacturing and regional inventories cut exposure and shorten lead times.
- Tariff exposure: US Section 301 ~370B USD
- Logistics risk: geopolitical disruptions raise freight/insurance
- Mitigant: diversified manufacturing
- Mitigant: regional inventories
Value-based care and donor-safety drive blood services; US spend 4.5T USD
Shifts in national health priorities and value-based care reshape funding for blood services; US health spend was ~4.5 trillion USD in 2023, affecting budgets. Payer and HTA decisions (Medicare ~65M enrollees in 2024) drive device uptake and reimbursement. Tighter donor-screening and safety rules (WHO 118.5M donations) expand demand but raise compliance costs.
| Metric | Value |
|---|---|
| Haemonetics revenue 2024 | 1.14B USD |
| Global plasma market | ~36B USD |
| WHO blood donations | 118.5M |
What is included in the product
Detailed Word Document
Explores how external macro-environmental factors uniquely affect Haemonetics across Political, Economic, Social, Technological, Environmental and Legal dimensions. Each section is data-backed with forward-looking insights tailored to help executives, consultants and investors identify risks, opportunities and actionable strategic responses.
Customizable Excel Spreadsheet
Condenses Haemonetics' PESTLE into a clean, visually segmented brief that teams can drop into presentations or share for quick alignment, helping stakeholders rapidly assess external risks and strategic positioning.
Economic factors
Healthcare budget cycles
Capital equipment purchases at Haemonetics hinge on hospital and blood center budget cycles, with fiscal constraints commonly delaying upgrades while stimulus funding can trigger modernization—eg, the 2020 CARES Act allocated about 175 billion for provider relief. Flexible financing options and clear ROI evidence help smooth demand timing. Vendors showing payback timelines accelerate procurement decisions in constrained cycles.
Macroeconomic volatility
Macroeconomic volatility pressures Haemonetics as 2024 US CPI averaged 3.4%, raising raw-material and logistics costs and testing pricing power in sensitive markets. FX swings, notably a stronger dollar in 2024, compress international revenue on repatriation and raise costs for imported components. Hedging strategies and increased localized sourcing across Europe and APAC are deployed to protect margins and stabilize input costs.
Plasma industry growth dynamics
Plasma collection volumes directly drive consumables demand, supporting a global plasma-derived therapeutics market that exceeded $30 billion in 2024. US donors supply roughly 60% of global plasma (PPTA 2023), so donor compensation economics and center expansion cycles materially affect throughput. Scalable collection systems that raise yield per session enable faster capture of growth phases and higher consumable utilization.
Industry consolidation
Industry consolidation centralizes purchasing: large hospital systems and GPOs (Vizient reports >3,500 member organizations as of 2024) drive platform selection, enabling negotiation of lower unit prices but favoring standardized devices and supply chains. Haemonetics that demonstrate measurable efficiency and cost-per-procedure savings can secure system-wide contracts across consolidated networks. Consolidation in plasma and hospital networks increases contract size and switching costs, raising the value of platform-level wins.
- Consolidation effect: centralized purchasing, higher bargaining power
- Key fact: Vizient >3,500 members (2024)
- Win condition: proven efficiency → system-wide contracts
- Risk: higher switching costs; preference for preferred platforms
Interest rates and capital access
Higher benchmark rates (Federal funds 5.25–5.50% as of July 2025) increase customer cost of capital and can delay capital expenditure, while vendor financing and subscription models help preserve device adoption and recurring revenue. Haemonetics’ strong balance sheet enables continued R&D spend and strategic M&A even as borrowing costs remain elevated.
- Higher rates: Fed 5.25–5.50% (Jul 2025)
- Mitigants: vendor finance, subscription models
- Advantage: strong balance sheet funds R&D/M&A
Value-based care and donor-safety drive blood services; US spend 4.5T USD
Hospital capital cycles and higher rates slow device upgrades, while vendor financing and subscription models sustain adoption; Fed funds 5.25–5.50% (Jul 2025). Inflation (US CPI 2024 3.4%) and FX volatility pressure margins; hedging and local sourcing mitigate. Plasma volumes drive consumable revenue—global plasma market >$30B (2024); US supplies ~60% of plasma.
| Metric | Value |
|---|---|
| Fed funds (Jul 2025) | 5.25–5.50% |
| US CPI (2024) | 3.4% |
| Global plasma market (2024) | >$30B |
| US share of plasma (PPTA 2023) | ~60% |
| Vizient members (2024) | >3,500 |
Full Version Awaits
Haemonetics PESTLE Analysis
The Haemonetics PESTLE Analysis preview shown here is the exact document you’ll receive after purchase—fully formatted and ready to use. The layout, content, and structure visible in this sample match the final file you’ll download immediately after payment. No placeholders or teasers—this is the real, professionally structured report you’ll own upon checkout.











