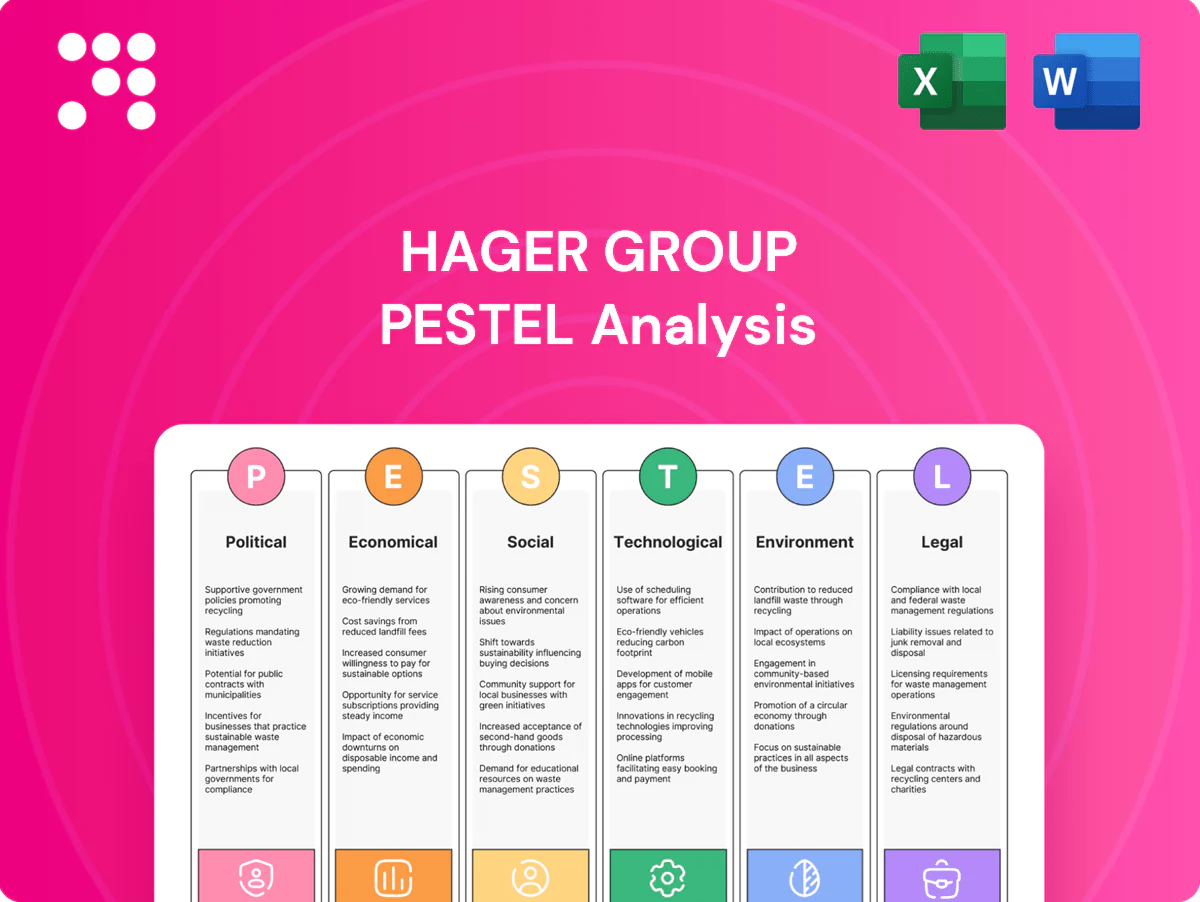
Hager Group PESTLE Analysis

Make Smarter Strategic Decisions with a Complete PESTEL View
Get strategic clarity with our PESTLE Analysis of Hager Group—external forces distilled into actionable insights. Understand how politics, economy, technology and regulation shape growth and risk. Purchase the full report for the complete, ready-to-use breakdown and immediate download.
Political factors

EU energy-transition policies and incentives
EU Fit for 55 targets a 55% GHG cut by 2030 and REPowerEU pushes renewables toward ~45% share and mobilises up to EUR 300bn to 2030, steering demand to efficient distribution, smart panels and building automation; Hager can align portfolios to qualify for grants and public tenders. Rapid shifts in subsidy design or eligibility can reallocate market growth across segments, so active policy monitoring and product-certification readiness mitigate downside risk.
Public infrastructure and renovation spending
Government budgets for schools, hospitals and social housing, including EUR 700 billion mobilised via the EU Recovery and Resilience Facility and the Renovation Wave which needs ~EUR 275 billion/yr, directly drive electrical installation volumes benefitting Hager’s products. Energy-efficiency and safety stimulus prioritises integrated solutions, lifting demand for smart electrical systems. Long procurement cycles (commonly 6–12 months) and local‑content rules force tight pipeline visibility and working-capital planning.

Geopolitical trade and supply-chain exposure
Tariffs, sanctions and logistics disruptions push component costs and lead times for metals, electronics and semiconductors (semiconductor lead times spiked to 20+ weeks in 2021–22 and some segments remain elevated), while container rates fell from peaks near $10,000/FEU to about $2,000/FEU by 2024; diversified sourcing and regionalization shield service levels, Germany-based production benefits from political stability, and scenario planning addresses sudden export controls and customs changes.

Standards harmonization and cross-border alignment
EU-level harmonized standards ease Hager Group product rollout across 27 member states and ~447 million consumers (Eurostat 2024), while divergence in non-EU markets raises customization and certification burdens that slow time-to-revenue. Active engagement with CEN/CENELEC and IEC helps shape interoperable frameworks; early compliance delivers measurable speed-to-market advantages.
- 27 EU states, ~447M consumers (Eurostat 2024)
- Harmonization reduces cross-border barriers
- Divergence increases certification burden and time-to-revenue
- Engage standards bodies for interoperability
Industrial policy and local manufacturing expectations
Reshoring and strategic autonomy agendas push Hager Group to expand local production, testing and R&D footprints; EU policy drivers such as the 2023 Critical Raw Materials Act strengthen incentives for domestic supply chains. Meeting local-content thresholds can unlock access to the EU public procurement market (~€2 trillion/year). Policy-driven grants and tax breaks can offset regional plant CAPEX, while non-compliance risks exclusion from key EU programs and contracts.
- local-production
- testing-R&D
- CRM-Act-2023
- €2T-procurement
- CAPEX-incentives
- non-compliance-risk
EU climate funds and procurement shift demand to efficient distribution and smart buildings
EU Fit for 55 and REPowerEU (≈EUR 300bn to 2030) steer demand to efficient distribution and smart buildings; Hager can capture grants and tenders but must track changing subsidy rules. Renovation Wave (~EUR 275bn/yr) and EUR 700bn RRF boost public installations; long procurement cycles require pipeline visibility. Reshoring and CRM Act (2023) favor local production to access ~€2T/year EU procurement.
| Metric | Value |
|---|---|
| EU states / population | 27 / ~447M (Eurostat 2024) |
| REPowerEU funding | ≈EUR 300bn to 2030 |
| Renovation Wave | ≈EUR 275bn/yr |
| RRF | EUR 700bn |
| EU public procurement | ≈€2T/yr |
What is included in the product
 Detailed Word Document
Explores how macro-environmental factors uniquely affect Hager Group across Political, Economic, Social, Technological, Environmental and Legal dimensions, with data-driven subpoints and examples specific to the electrical/building systems sector. Designed for executives, consultants and investors, it delivers forward-looking insights and clean formatting ready for business plans, pitch decks or scenario planning.

 Customizable Excel Spreadsheet
A concise, visually segmented PESTLE summary of Hager Group that highlights external risks and opportunities for quick meeting use, editable for regional/context notes and easily dropped into presentations or shared across teams to speed alignment and strategic planning.
Economic factors

Construction and renovation cycles
Residential, commercial and industrial build rates set Hager Group’s baseline demand — global construction output reached about $13.6 trillion in 2024, with housing starts in the US near 1.4 million units. In mature markets renovation now outpaces new builds (renovation share ~40% in Europe), favoring retrofit-friendly electrical solutions. Cyclicality forces flexible capacity and channel management, while diversification across segments smooths revenue volatility.
Interest rates and financing conditions
Higher borrowing costs — euro-area policy rates around 4% in mid-2025 — can delay real estate projects and compress installer cash flows, slowing installations. Energy-saving automation and EMS still show paybacks of roughly 3–5 years, cushioning demand. Providing in-house financing or ROI calculators shortens sales cycles; sensitivity varies by customer segment and country risk premia.

Commodity and component cost inflation
Copper (~10,000 USD/tonne in mid‑2025), aluminum, plastics and semiconductors materially drive Hager Group’s COGS, with raw materials accounting for the bulk of cost volatility. Strategic hedging and value‑engineering programs have protected margins against price spikes. Transparent pricing, SKU‑mix optimization and list‑price adjustments enable pass‑through to customers. Deep supplier partnerships and long‑term contracts secure allocation during tight markets.

FX exposure and geographic mix
EUR moves (range ~1.05–1.13 USD in 2024–H1 2025) directly affect Hager Group’s translation and import costs outside the eurozone; a stronger euro lowers import costs for euro-based procurement while a weaker euro increases local-currency revenue when translated. Pricing discipline and expanded local sourcing have reduced transactional FX volatility; regional sales roughly majority-European, creating natural hedges where costs and revenues align. Corporate practice favors hedging horizons of 6–18 months, with many firms using 12-month programs to match forecasts.
- FX range 2024–H1 2025: EUR/USD ~1.05–1.13
- Majority sales in Europe → natural hedge via regional costs/revenues
- Local sourcing + pricing discipline → lower transactional FX impact
- Hedging horizon: commonly 6–18 months (12 months typical)
Labor availability and installer productivity
Skilled electrician shortages constrain rollout—BLS projects 6% electrician job growth 2022–32 and NAHB reported 77% of builders had trouble finding qualified trades in 2023, creating installation bottlenecks. Pre-wired, modular and tool-less systems have cut on-site install time in industry case studies by 30–50%, boosting throughput. Manufacturer-led training with trade schools lifts channel loyalty and retention by about 20%. Simpler designs cut callbacks and can lower total installed cost ~25%.
- labor-shortage: BLS 6% growth, NAHB 77% hiring difficulty
- throughput-gain: modular/pre-wired 30–50% faster
- training-impact: ~20% higher retention
- cost-reduction: callbacks/installed cost ~25% lower
EU climate funds and procurement shift demand to efficient distribution and smart buildings
Global construction output ~$13.6tn (2024) and US housing starts ~1.4M set baseline demand; renovations (~40% in Europe) favor retrofit solutions. Euro-area policy rates ~4% (mid‑2025) and energy-paybacks (3–5 yrs) shape project timing. Raw-materials (copper ~$10k/t mid‑2025) drive COGS; EUR/USD 1.05–1.13 (2024–H1 2025) affects translation and imports.
| Metric | Value |
|---|---|
| Global construction (2024) | $13.6tn |
| US housing starts | ~1.4M |
| Euro policy rate | ~4% (mid‑2025) |
| Copper price | ~$10,000/t (mid‑2025) |
| EUR/USD | 1.05–1.13 (2024–H1 2025) |
Preview Before You Purchase
Hager Group PESTLE Analysis
The preview shown here is the exact Hager Group PESTLE Analysis document you’ll receive after purchase—fully formatted and ready to use. No placeholders or teasers: the layout, content and structure visible here are exactly what you’ll download immediately after buying. This final, professionally structured file is ready for immediate use in strategy, risk assessment, and reporting.

Make Smarter Strategic Decisions with a Complete PESTEL View
Get strategic clarity with our PESTLE Analysis of Hager Group—external forces distilled into actionable insights. Understand how politics, economy, technology and regulation shape growth and risk. Purchase the full report for the complete, ready-to-use breakdown and immediate download.
Political factors
EU energy-transition policies and incentives
EU Fit for 55 targets a 55% GHG cut by 2030 and REPowerEU pushes renewables toward ~45% share and mobilises up to EUR 300bn to 2030, steering demand to efficient distribution, smart panels and building automation; Hager can align portfolios to qualify for grants and public tenders. Rapid shifts in subsidy design or eligibility can reallocate market growth across segments, so active policy monitoring and product-certification readiness mitigate downside risk.
Public infrastructure and renovation spending
Government budgets for schools, hospitals and social housing, including EUR 700 billion mobilised via the EU Recovery and Resilience Facility and the Renovation Wave which needs ~EUR 275 billion/yr, directly drive electrical installation volumes benefitting Hager’s products. Energy-efficiency and safety stimulus prioritises integrated solutions, lifting demand for smart electrical systems. Long procurement cycles (commonly 6–12 months) and local‑content rules force tight pipeline visibility and working-capital planning.
Geopolitical trade and supply-chain exposure
Tariffs, sanctions and logistics disruptions push component costs and lead times for metals, electronics and semiconductors (semiconductor lead times spiked to 20+ weeks in 2021–22 and some segments remain elevated), while container rates fell from peaks near $10,000/FEU to about $2,000/FEU by 2024; diversified sourcing and regionalization shield service levels, Germany-based production benefits from political stability, and scenario planning addresses sudden export controls and customs changes.
Standards harmonization and cross-border alignment
EU-level harmonized standards ease Hager Group product rollout across 27 member states and ~447 million consumers (Eurostat 2024), while divergence in non-EU markets raises customization and certification burdens that slow time-to-revenue. Active engagement with CEN/CENELEC and IEC helps shape interoperable frameworks; early compliance delivers measurable speed-to-market advantages.
- 27 EU states, ~447M consumers (Eurostat 2024)
- Harmonization reduces cross-border barriers
- Divergence increases certification burden and time-to-revenue
- Engage standards bodies for interoperability
Industrial policy and local manufacturing expectations
Reshoring and strategic autonomy agendas push Hager Group to expand local production, testing and R&D footprints; EU policy drivers such as the 2023 Critical Raw Materials Act strengthen incentives for domestic supply chains. Meeting local-content thresholds can unlock access to the EU public procurement market (~€2 trillion/year). Policy-driven grants and tax breaks can offset regional plant CAPEX, while non-compliance risks exclusion from key EU programs and contracts.
- local-production
- testing-R&D
- CRM-Act-2023
- €2T-procurement
- CAPEX-incentives
- non-compliance-risk
EU climate funds and procurement shift demand to efficient distribution and smart buildings
EU Fit for 55 and REPowerEU (≈EUR 300bn to 2030) steer demand to efficient distribution and smart buildings; Hager can capture grants and tenders but must track changing subsidy rules. Renovation Wave (~EUR 275bn/yr) and EUR 700bn RRF boost public installations; long procurement cycles require pipeline visibility. Reshoring and CRM Act (2023) favor local production to access ~€2T/year EU procurement.
| Metric | Value |
|---|---|
| EU states / population | 27 / ~447M (Eurostat 2024) |
| REPowerEU funding | ≈EUR 300bn to 2030 |
| Renovation Wave | ≈EUR 275bn/yr |
| RRF | EUR 700bn |
| EU public procurement | ≈€2T/yr |
What is included in the product
Detailed Word Document
Explores how macro-environmental factors uniquely affect Hager Group across Political, Economic, Social, Technological, Environmental and Legal dimensions, with data-driven subpoints and examples specific to the electrical/building systems sector. Designed for executives, consultants and investors, it delivers forward-looking insights and clean formatting ready for business plans, pitch decks or scenario planning.
Customizable Excel Spreadsheet
A concise, visually segmented PESTLE summary of Hager Group that highlights external risks and opportunities for quick meeting use, editable for regional/context notes and easily dropped into presentations or shared across teams to speed alignment and strategic planning.
Economic factors
Construction and renovation cycles
Residential, commercial and industrial build rates set Hager Group’s baseline demand — global construction output reached about $13.6 trillion in 2024, with housing starts in the US near 1.4 million units. In mature markets renovation now outpaces new builds (renovation share ~40% in Europe), favoring retrofit-friendly electrical solutions. Cyclicality forces flexible capacity and channel management, while diversification across segments smooths revenue volatility.
Interest rates and financing conditions
Higher borrowing costs — euro-area policy rates around 4% in mid-2025 — can delay real estate projects and compress installer cash flows, slowing installations. Energy-saving automation and EMS still show paybacks of roughly 3–5 years, cushioning demand. Providing in-house financing or ROI calculators shortens sales cycles; sensitivity varies by customer segment and country risk premia.
Commodity and component cost inflation
Copper (~10,000 USD/tonne in mid‑2025), aluminum, plastics and semiconductors materially drive Hager Group’s COGS, with raw materials accounting for the bulk of cost volatility. Strategic hedging and value‑engineering programs have protected margins against price spikes. Transparent pricing, SKU‑mix optimization and list‑price adjustments enable pass‑through to customers. Deep supplier partnerships and long‑term contracts secure allocation during tight markets.
FX exposure and geographic mix
EUR moves (range ~1.05–1.13 USD in 2024–H1 2025) directly affect Hager Group’s translation and import costs outside the eurozone; a stronger euro lowers import costs for euro-based procurement while a weaker euro increases local-currency revenue when translated. Pricing discipline and expanded local sourcing have reduced transactional FX volatility; regional sales roughly majority-European, creating natural hedges where costs and revenues align. Corporate practice favors hedging horizons of 6–18 months, with many firms using 12-month programs to match forecasts.
- FX range 2024–H1 2025: EUR/USD ~1.05–1.13
- Majority sales in Europe → natural hedge via regional costs/revenues
- Local sourcing + pricing discipline → lower transactional FX impact
- Hedging horizon: commonly 6–18 months (12 months typical)
Labor availability and installer productivity
Skilled electrician shortages constrain rollout—BLS projects 6% electrician job growth 2022–32 and NAHB reported 77% of builders had trouble finding qualified trades in 2023, creating installation bottlenecks. Pre-wired, modular and tool-less systems have cut on-site install time in industry case studies by 30–50%, boosting throughput. Manufacturer-led training with trade schools lifts channel loyalty and retention by about 20%. Simpler designs cut callbacks and can lower total installed cost ~25%.
- labor-shortage: BLS 6% growth, NAHB 77% hiring difficulty
- throughput-gain: modular/pre-wired 30–50% faster
- training-impact: ~20% higher retention
- cost-reduction: callbacks/installed cost ~25% lower
EU climate funds and procurement shift demand to efficient distribution and smart buildings
Global construction output ~$13.6tn (2024) and US housing starts ~1.4M set baseline demand; renovations (~40% in Europe) favor retrofit solutions. Euro-area policy rates ~4% (mid‑2025) and energy-paybacks (3–5 yrs) shape project timing. Raw-materials (copper ~$10k/t mid‑2025) drive COGS; EUR/USD 1.05–1.13 (2024–H1 2025) affects translation and imports.
| Metric | Value |
|---|---|
| Global construction (2024) | $13.6tn |
| US housing starts | ~1.4M |
| Euro policy rate | ~4% (mid‑2025) |
| Copper price | ~$10,000/t (mid‑2025) |
| EUR/USD | 1.05–1.13 (2024–H1 2025) |
Preview Before You Purchase
Hager Group PESTLE Analysis
The preview shown here is the exact Hager Group PESTLE Analysis document you’ll receive after purchase—fully formatted and ready to use. No placeholders or teasers: the layout, content and structure visible here are exactly what you’ll download immediately after buying. This final, professionally structured file is ready for immediate use in strategy, risk assessment, and reporting.
Original: $10.00
-65%$10.00
$3.50Description
Make Smarter Strategic Decisions with a Complete PESTEL View
Get strategic clarity with our PESTLE Analysis of Hager Group—external forces distilled into actionable insights. Understand how politics, economy, technology and regulation shape growth and risk. Purchase the full report for the complete, ready-to-use breakdown and immediate download.
Political factors
EU energy-transition policies and incentives
EU Fit for 55 targets a 55% GHG cut by 2030 and REPowerEU pushes renewables toward ~45% share and mobilises up to EUR 300bn to 2030, steering demand to efficient distribution, smart panels and building automation; Hager can align portfolios to qualify for grants and public tenders. Rapid shifts in subsidy design or eligibility can reallocate market growth across segments, so active policy monitoring and product-certification readiness mitigate downside risk.
Public infrastructure and renovation spending
Government budgets for schools, hospitals and social housing, including EUR 700 billion mobilised via the EU Recovery and Resilience Facility and the Renovation Wave which needs ~EUR 275 billion/yr, directly drive electrical installation volumes benefitting Hager’s products. Energy-efficiency and safety stimulus prioritises integrated solutions, lifting demand for smart electrical systems. Long procurement cycles (commonly 6–12 months) and local‑content rules force tight pipeline visibility and working-capital planning.
Geopolitical trade and supply-chain exposure
Tariffs, sanctions and logistics disruptions push component costs and lead times for metals, electronics and semiconductors (semiconductor lead times spiked to 20+ weeks in 2021–22 and some segments remain elevated), while container rates fell from peaks near $10,000/FEU to about $2,000/FEU by 2024; diversified sourcing and regionalization shield service levels, Germany-based production benefits from political stability, and scenario planning addresses sudden export controls and customs changes.
Standards harmonization and cross-border alignment
EU-level harmonized standards ease Hager Group product rollout across 27 member states and ~447 million consumers (Eurostat 2024), while divergence in non-EU markets raises customization and certification burdens that slow time-to-revenue. Active engagement with CEN/CENELEC and IEC helps shape interoperable frameworks; early compliance delivers measurable speed-to-market advantages.
- 27 EU states, ~447M consumers (Eurostat 2024)
- Harmonization reduces cross-border barriers
- Divergence increases certification burden and time-to-revenue
- Engage standards bodies for interoperability
Industrial policy and local manufacturing expectations
Reshoring and strategic autonomy agendas push Hager Group to expand local production, testing and R&D footprints; EU policy drivers such as the 2023 Critical Raw Materials Act strengthen incentives for domestic supply chains. Meeting local-content thresholds can unlock access to the EU public procurement market (~€2 trillion/year). Policy-driven grants and tax breaks can offset regional plant CAPEX, while non-compliance risks exclusion from key EU programs and contracts.
- local-production
- testing-R&D
- CRM-Act-2023
- €2T-procurement
- CAPEX-incentives
- non-compliance-risk
EU climate funds and procurement shift demand to efficient distribution and smart buildings
EU Fit for 55 and REPowerEU (≈EUR 300bn to 2030) steer demand to efficient distribution and smart buildings; Hager can capture grants and tenders but must track changing subsidy rules. Renovation Wave (~EUR 275bn/yr) and EUR 700bn RRF boost public installations; long procurement cycles require pipeline visibility. Reshoring and CRM Act (2023) favor local production to access ~€2T/year EU procurement.
| Metric | Value |
|---|---|
| EU states / population | 27 / ~447M (Eurostat 2024) |
| REPowerEU funding | ≈EUR 300bn to 2030 |
| Renovation Wave | ≈EUR 275bn/yr |
| RRF | EUR 700bn |
| EU public procurement | ≈€2T/yr |
What is included in the product
Detailed Word Document
Explores how macro-environmental factors uniquely affect Hager Group across Political, Economic, Social, Technological, Environmental and Legal dimensions, with data-driven subpoints and examples specific to the electrical/building systems sector. Designed for executives, consultants and investors, it delivers forward-looking insights and clean formatting ready for business plans, pitch decks or scenario planning.
Customizable Excel Spreadsheet
A concise, visually segmented PESTLE summary of Hager Group that highlights external risks and opportunities for quick meeting use, editable for regional/context notes and easily dropped into presentations or shared across teams to speed alignment and strategic planning.
Economic factors
Construction and renovation cycles
Residential, commercial and industrial build rates set Hager Group’s baseline demand — global construction output reached about $13.6 trillion in 2024, with housing starts in the US near 1.4 million units. In mature markets renovation now outpaces new builds (renovation share ~40% in Europe), favoring retrofit-friendly electrical solutions. Cyclicality forces flexible capacity and channel management, while diversification across segments smooths revenue volatility.
Interest rates and financing conditions
Higher borrowing costs — euro-area policy rates around 4% in mid-2025 — can delay real estate projects and compress installer cash flows, slowing installations. Energy-saving automation and EMS still show paybacks of roughly 3–5 years, cushioning demand. Providing in-house financing or ROI calculators shortens sales cycles; sensitivity varies by customer segment and country risk premia.
Commodity and component cost inflation
Copper (~10,000 USD/tonne in mid‑2025), aluminum, plastics and semiconductors materially drive Hager Group’s COGS, with raw materials accounting for the bulk of cost volatility. Strategic hedging and value‑engineering programs have protected margins against price spikes. Transparent pricing, SKU‑mix optimization and list‑price adjustments enable pass‑through to customers. Deep supplier partnerships and long‑term contracts secure allocation during tight markets.
FX exposure and geographic mix
EUR moves (range ~1.05–1.13 USD in 2024–H1 2025) directly affect Hager Group’s translation and import costs outside the eurozone; a stronger euro lowers import costs for euro-based procurement while a weaker euro increases local-currency revenue when translated. Pricing discipline and expanded local sourcing have reduced transactional FX volatility; regional sales roughly majority-European, creating natural hedges where costs and revenues align. Corporate practice favors hedging horizons of 6–18 months, with many firms using 12-month programs to match forecasts.
- FX range 2024–H1 2025: EUR/USD ~1.05–1.13
- Majority sales in Europe → natural hedge via regional costs/revenues
- Local sourcing + pricing discipline → lower transactional FX impact
- Hedging horizon: commonly 6–18 months (12 months typical)
Labor availability and installer productivity
Skilled electrician shortages constrain rollout—BLS projects 6% electrician job growth 2022–32 and NAHB reported 77% of builders had trouble finding qualified trades in 2023, creating installation bottlenecks. Pre-wired, modular and tool-less systems have cut on-site install time in industry case studies by 30–50%, boosting throughput. Manufacturer-led training with trade schools lifts channel loyalty and retention by about 20%. Simpler designs cut callbacks and can lower total installed cost ~25%.
- labor-shortage: BLS 6% growth, NAHB 77% hiring difficulty
- throughput-gain: modular/pre-wired 30–50% faster
- training-impact: ~20% higher retention
- cost-reduction: callbacks/installed cost ~25% lower
EU climate funds and procurement shift demand to efficient distribution and smart buildings
Global construction output ~$13.6tn (2024) and US housing starts ~1.4M set baseline demand; renovations (~40% in Europe) favor retrofit solutions. Euro-area policy rates ~4% (mid‑2025) and energy-paybacks (3–5 yrs) shape project timing. Raw-materials (copper ~$10k/t mid‑2025) drive COGS; EUR/USD 1.05–1.13 (2024–H1 2025) affects translation and imports.
| Metric | Value |
|---|---|
| Global construction (2024) | $13.6tn |
| US housing starts | ~1.4M |
| Euro policy rate | ~4% (mid‑2025) |
| Copper price | ~$10,000/t (mid‑2025) |
| EUR/USD | 1.05–1.13 (2024–H1 2025) |
Preview Before You Purchase
Hager Group PESTLE Analysis
The preview shown here is the exact Hager Group PESTLE Analysis document you’ll receive after purchase—fully formatted and ready to use. No placeholders or teasers: the layout, content and structure visible here are exactly what you’ll download immediately after buying. This final, professionally structured file is ready for immediate use in strategy, risk assessment, and reporting.











