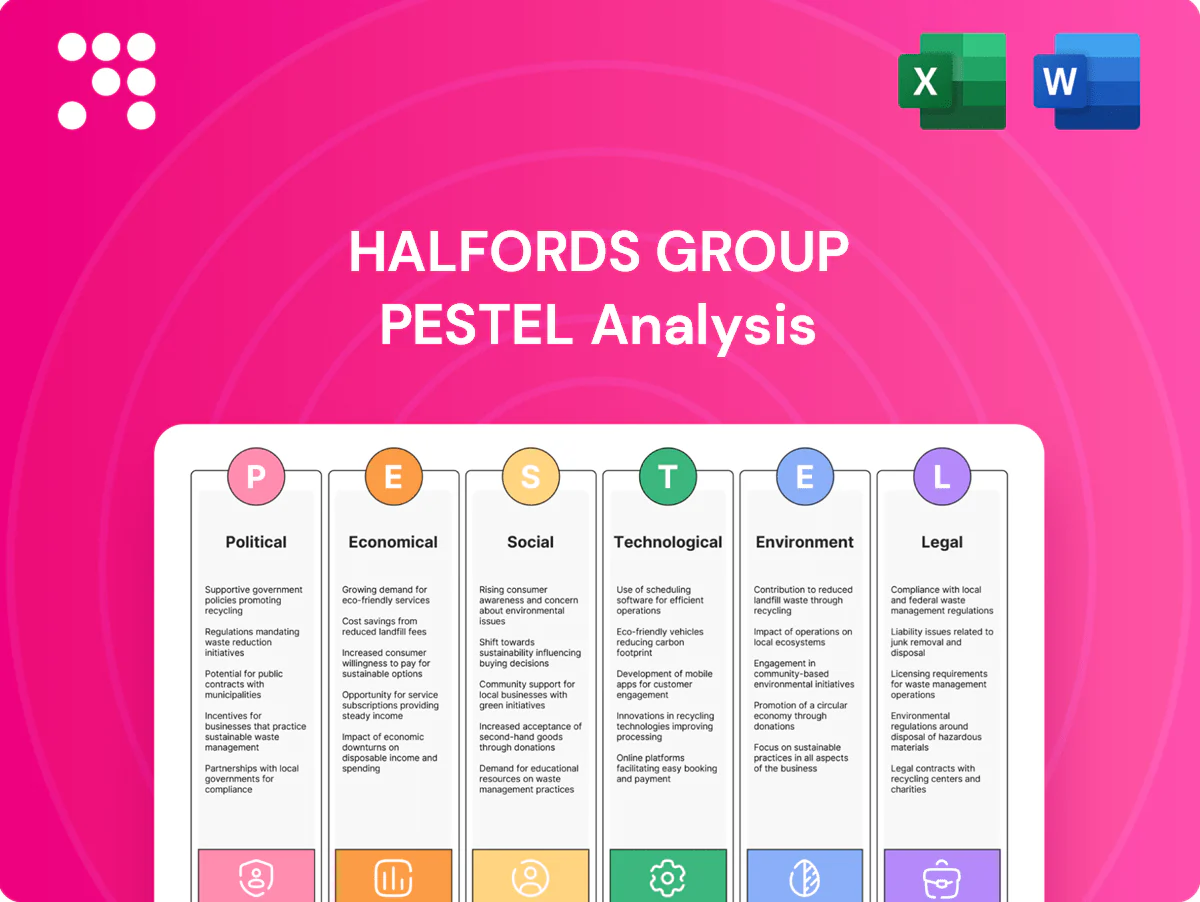
Halfords Group PESTLE Analysis

Make Smarter Strategic Decisions with a Complete PESTEL View
Unpack the external forces shaping Halfords Group with our concise PESTLE analysis—covering political, economic, social, technological, legal and environmental risks and opportunities that matter to investors and strategists. Use these insights to anticipate challenges, spot growth areas, and refine competitive strategy. Purchase the full, ready-to-use report for detailed, actionable intelligence you can implement today.
Political factors

UK transport policy and incentives
Government support for cycling infrastructure via the 2020 Gear Change agenda and £2bn active travel commitment and the creation of Active Travel England drives higher demand for bikes, accessories and workshop services. UK policy to end sales of new petrol cars by 2030 (and most hybrids by 2035) accelerates EV adoption, shifting Halfords car-care mix and necessitating technician upskilling. Aligning promotions with local council grants and cycling schemes can capture incremental footfall, while policy reversals or implementation delays create category-level sales volatility.
Post-Brexit trade and customs
Post-Brexit import friction on bikes, parts and automotive components has increased lead times and costs for Halfords—Halfords Group reported FY24 revenue of about £1.1bn, so margin pressure from tariffs and delays is material. Rules of origin and customs checks require robust compliance and forecasting; customs declarations rose markedly after 2020. Supplier diversification and nearshoring mitigate disruption risk, while EU-UK regulatory divergence could complicate product certification.

Fuel duty and motoring taxation
Changes to fuel duty and vehicle taxes influence miles driven and aftermarket demand; UK road traffic recovered to about 99% of 2019 levels in 2023 (DfT), so any fuel duty rise could reduce mileage and service visits.
Higher running costs (average pump prices peaked near £1.60/litre in 2024) encourage owners to extend vehicle lifecycles, boosting servicing and repairs.
Lower motoring costs tend to lift discretionary accessory sales, while emissions-focused policy and rising EV new‑car share (around 22% in 2024, SMMT) shift demand toward EV servicing and accessories.

Local clean air zones and ULEZ
Expansion of ULEZ and local clean air zones (Greater London expanded in Aug 2023; ULEZ charge £12.50/day) pushes owners toward vehicle upgrades or higher-frequency maintenance to meet standards, boosting demand for parts and Autocentre services while increasing bike and e-bike use as alternatives.
- Higher service demand near zones
- More parts & retrofit opportunities
- Rising bike sales as modal shift
- Political delays can change timing and demand
Business rates and planning
Reforms to business rates materially affect Halfords’ retail cost base and footprint decisions, altering store profitability and closing/opening thresholds. Planning policy divergence between retail parks and high streets shapes where new stores and Autocentres are viable, impacting site selection and CAPEX. Close engagement with local councils can secure favorable lease terms or co-funding for mobility services, while policy uncertainty complicates multi-year investment planning.
- Business rates: cost base sensitivity
- Planning: retail parks vs high street
- Council engagement: leases/co-funding
- Policy uncertainty: investment risk
£2bn travel cash, 22% EVs drive repairs & upskilling
Government active travel funding (£2bn) and Gear Change boost bike sales and services; EV new‑car share ~22% (2024) shifts Autocentre demand and upskilling needs. Post‑Brexit customs raise costs and lead times, impacting FY24 revenue ~£1.1bn and margins. ULEZ expansion and fuel price spikes (peak £1.60/litre, 2024) increase maintenance and parts demand.
| Factor | 2024/25 data |
|---|---|
| Active travel funding | £2bn |
| Halfords FY24 revenue | ~£1.1bn |
| EV share | 22% |
| Fuel peak | £1.60/l |
What is included in the product
 Detailed Word Document
Explores how Political, Economic, Social, Technological, Environmental and Legal forces uniquely impact Halfords Group, with data-backed trends, region-specific regulatory context and actionable risks/opportunities; designed for executives and investors with forward-looking insights ready for reports, decks or strategy planning.

 Customizable Excel Spreadsheet
A concise, category-segmented PESTLE summary of Halfords Group that can be dropped into presentations, shared across teams, and annotated with regional or business-line notes to streamline risk discussions and strategic planning.
Economic factors

Consumer confidence and inflation
Persistent headline inflation stayed above the Bank of England 2% target through 2024 while Bank rate averaged near 5%, squeezing real incomes and shifting customer spend from discretionary accessories to essential servicing.
Heightened price sensitivity drives demand for value ranges and promotions; Halfords must offset component and labour cost inflation without eroding margins.
When consumer confidence rebounds, premium bike and leisure segments can recover sharply, as seen in past post-recession uplifts.
Interest rates and financing
Bank of England rate moves alter Halfords’ financing costs for inventory and CapEx, tightening margins when borrowing costs rise and easing them when cuts occur. Consumer credit availability directly affects big-ticket bike sales and service plan uptake, with financing uptake historically boosting average transaction values. Flexible payment options smooth demand through cycles, while any rate cuts will support volume recovery but may lag due to existing inventory cycles.

Vehicle parc age and mileage
UK car parc c.33.0m vehicles with average age ~9.2 years (SMMT/2024) and RoI parc ~2.7m with avg age ~8.6 years (RSA/2023) raises maintenance and MOT frequency; post‑pandemic annual mileage stabilised near 8,000 miles (DfT/2023), keeping regular service intervals. Demand for brakes, tyres and batteries is up, supporting Autocentres utilisation (approx +6% Y/Y) and Retail-to-Autocentre cross‑sell opportunities.

Supply chain costs and FX
Fluctuations in shipping, commodity prices and GBP exchange rates materially affect Halfords landed costs, prompting use of hedging and long‑term vendor agreements to stabilise input pricing; inventory agility across stores and distribution centres is required to manage pronounced seasonality and promotion cycles. Persistent cost pressure drives SKU mix optimisation and accelerated private‑label growth to protect margins.
- hedging and vendor contracts
- inventory agility for seasonality/promos
- mix optimisation
- private‑label expansion
Cycling and leisure seasonality
Weather and holiday calendars drive clear peaks in cycling, camping and touring demand, making pre-season buying and allocation vital to avoid stockouts or steep markdowns; service teams must flex capacity for seasonal bike builds and repairs, while economic slowdowns amplify seasonality as consumers defer non-essential purchases.
- Seasonal peaks: Easter to August
- Inventory risk: pre-season allocation critical
- Service: scalable bike-build/repair capacity
- Macro impact: downturns deepen deferment
£2bn travel cash, 22% EVs drive repairs & upskilling
Persistent inflation remained above the BoE 2% target through 2024 and Bank rate averaged near 5%, squeezing real incomes and shifting spend to essential servicing. UK car parc c.33.0m (avg age 9.2) and RoI 2.7m (8.6) sustain demand for tyres/brakes/batteries; Autocentres utilisation +6% Y/Y. FX, commodity and shipping volatility raise landed costs, driving hedging, vendor contracts, SKU mix and private‑label growth. Consumer credit availability directly affects big‑ticket bike sales and AOV.
| Metric | Value |
|---|---|
| Bank rate (2024 avg) | ~5% |
| UK car parc | 33.0m (avg age 9.2) |
| RoI car parc | 2.7m (avg age 8.6) |
| Autocentres util. | +6% Y/Y |
What You See Is What You Get
Halfords Group PESTLE Analysis
The preview shown here is the exact Halfords Group PESTLE Analysis you’ll receive after purchase—fully formatted and ready to use. This is the real, finished document with full content and structure. After payment you’ll instantly download this same file.

Make Smarter Strategic Decisions with a Complete PESTEL View
Unpack the external forces shaping Halfords Group with our concise PESTLE analysis—covering political, economic, social, technological, legal and environmental risks and opportunities that matter to investors and strategists. Use these insights to anticipate challenges, spot growth areas, and refine competitive strategy. Purchase the full, ready-to-use report for detailed, actionable intelligence you can implement today.
Political factors
UK transport policy and incentives
Government support for cycling infrastructure via the 2020 Gear Change agenda and £2bn active travel commitment and the creation of Active Travel England drives higher demand for bikes, accessories and workshop services. UK policy to end sales of new petrol cars by 2030 (and most hybrids by 2035) accelerates EV adoption, shifting Halfords car-care mix and necessitating technician upskilling. Aligning promotions with local council grants and cycling schemes can capture incremental footfall, while policy reversals or implementation delays create category-level sales volatility.
Post-Brexit trade and customs
Post-Brexit import friction on bikes, parts and automotive components has increased lead times and costs for Halfords—Halfords Group reported FY24 revenue of about £1.1bn, so margin pressure from tariffs and delays is material. Rules of origin and customs checks require robust compliance and forecasting; customs declarations rose markedly after 2020. Supplier diversification and nearshoring mitigate disruption risk, while EU-UK regulatory divergence could complicate product certification.
Fuel duty and motoring taxation
Changes to fuel duty and vehicle taxes influence miles driven and aftermarket demand; UK road traffic recovered to about 99% of 2019 levels in 2023 (DfT), so any fuel duty rise could reduce mileage and service visits.
Higher running costs (average pump prices peaked near £1.60/litre in 2024) encourage owners to extend vehicle lifecycles, boosting servicing and repairs.
Lower motoring costs tend to lift discretionary accessory sales, while emissions-focused policy and rising EV new‑car share (around 22% in 2024, SMMT) shift demand toward EV servicing and accessories.
Local clean air zones and ULEZ
Expansion of ULEZ and local clean air zones (Greater London expanded in Aug 2023; ULEZ charge £12.50/day) pushes owners toward vehicle upgrades or higher-frequency maintenance to meet standards, boosting demand for parts and Autocentre services while increasing bike and e-bike use as alternatives.
- Higher service demand near zones
- More parts & retrofit opportunities
- Rising bike sales as modal shift
- Political delays can change timing and demand
Business rates and planning
Reforms to business rates materially affect Halfords’ retail cost base and footprint decisions, altering store profitability and closing/opening thresholds. Planning policy divergence between retail parks and high streets shapes where new stores and Autocentres are viable, impacting site selection and CAPEX. Close engagement with local councils can secure favorable lease terms or co-funding for mobility services, while policy uncertainty complicates multi-year investment planning.
- Business rates: cost base sensitivity
- Planning: retail parks vs high street
- Council engagement: leases/co-funding
- Policy uncertainty: investment risk
£2bn travel cash, 22% EVs drive repairs & upskilling
Government active travel funding (£2bn) and Gear Change boost bike sales and services; EV new‑car share ~22% (2024) shifts Autocentre demand and upskilling needs. Post‑Brexit customs raise costs and lead times, impacting FY24 revenue ~£1.1bn and margins. ULEZ expansion and fuel price spikes (peak £1.60/litre, 2024) increase maintenance and parts demand.
| Factor | 2024/25 data |
|---|---|
| Active travel funding | £2bn |
| Halfords FY24 revenue | ~£1.1bn |
| EV share | 22% |
| Fuel peak | £1.60/l |
What is included in the product
Detailed Word Document
Explores how Political, Economic, Social, Technological, Environmental and Legal forces uniquely impact Halfords Group, with data-backed trends, region-specific regulatory context and actionable risks/opportunities; designed for executives and investors with forward-looking insights ready for reports, decks or strategy planning.
Customizable Excel Spreadsheet
A concise, category-segmented PESTLE summary of Halfords Group that can be dropped into presentations, shared across teams, and annotated with regional or business-line notes to streamline risk discussions and strategic planning.
Economic factors
Consumer confidence and inflation
Persistent headline inflation stayed above the Bank of England 2% target through 2024 while Bank rate averaged near 5%, squeezing real incomes and shifting customer spend from discretionary accessories to essential servicing.
Heightened price sensitivity drives demand for value ranges and promotions; Halfords must offset component and labour cost inflation without eroding margins.
When consumer confidence rebounds, premium bike and leisure segments can recover sharply, as seen in past post-recession uplifts.
Interest rates and financing
Bank of England rate moves alter Halfords’ financing costs for inventory and CapEx, tightening margins when borrowing costs rise and easing them when cuts occur. Consumer credit availability directly affects big-ticket bike sales and service plan uptake, with financing uptake historically boosting average transaction values. Flexible payment options smooth demand through cycles, while any rate cuts will support volume recovery but may lag due to existing inventory cycles.
Vehicle parc age and mileage
UK car parc c.33.0m vehicles with average age ~9.2 years (SMMT/2024) and RoI parc ~2.7m with avg age ~8.6 years (RSA/2023) raises maintenance and MOT frequency; post‑pandemic annual mileage stabilised near 8,000 miles (DfT/2023), keeping regular service intervals. Demand for brakes, tyres and batteries is up, supporting Autocentres utilisation (approx +6% Y/Y) and Retail-to-Autocentre cross‑sell opportunities.
Supply chain costs and FX
Fluctuations in shipping, commodity prices and GBP exchange rates materially affect Halfords landed costs, prompting use of hedging and long‑term vendor agreements to stabilise input pricing; inventory agility across stores and distribution centres is required to manage pronounced seasonality and promotion cycles. Persistent cost pressure drives SKU mix optimisation and accelerated private‑label growth to protect margins.
- hedging and vendor contracts
- inventory agility for seasonality/promos
- mix optimisation
- private‑label expansion
Cycling and leisure seasonality
Weather and holiday calendars drive clear peaks in cycling, camping and touring demand, making pre-season buying and allocation vital to avoid stockouts or steep markdowns; service teams must flex capacity for seasonal bike builds and repairs, while economic slowdowns amplify seasonality as consumers defer non-essential purchases.
- Seasonal peaks: Easter to August
- Inventory risk: pre-season allocation critical
- Service: scalable bike-build/repair capacity
- Macro impact: downturns deepen deferment
£2bn travel cash, 22% EVs drive repairs & upskilling
Persistent inflation remained above the BoE 2% target through 2024 and Bank rate averaged near 5%, squeezing real incomes and shifting spend to essential servicing. UK car parc c.33.0m (avg age 9.2) and RoI 2.7m (8.6) sustain demand for tyres/brakes/batteries; Autocentres utilisation +6% Y/Y. FX, commodity and shipping volatility raise landed costs, driving hedging, vendor contracts, SKU mix and private‑label growth. Consumer credit availability directly affects big‑ticket bike sales and AOV.
| Metric | Value |
|---|---|
| Bank rate (2024 avg) | ~5% |
| UK car parc | 33.0m (avg age 9.2) |
| RoI car parc | 2.7m (avg age 8.6) |
| Autocentres util. | +6% Y/Y |
What You See Is What You Get
Halfords Group PESTLE Analysis
The preview shown here is the exact Halfords Group PESTLE Analysis you’ll receive after purchase—fully formatted and ready to use. This is the real, finished document with full content and structure. After payment you’ll instantly download this same file.
Original: $10.00
-65%$10.00
$3.50Description
Make Smarter Strategic Decisions with a Complete PESTEL View
Unpack the external forces shaping Halfords Group with our concise PESTLE analysis—covering political, economic, social, technological, legal and environmental risks and opportunities that matter to investors and strategists. Use these insights to anticipate challenges, spot growth areas, and refine competitive strategy. Purchase the full, ready-to-use report for detailed, actionable intelligence you can implement today.
Political factors
UK transport policy and incentives
Government support for cycling infrastructure via the 2020 Gear Change agenda and £2bn active travel commitment and the creation of Active Travel England drives higher demand for bikes, accessories and workshop services. UK policy to end sales of new petrol cars by 2030 (and most hybrids by 2035) accelerates EV adoption, shifting Halfords car-care mix and necessitating technician upskilling. Aligning promotions with local council grants and cycling schemes can capture incremental footfall, while policy reversals or implementation delays create category-level sales volatility.
Post-Brexit trade and customs
Post-Brexit import friction on bikes, parts and automotive components has increased lead times and costs for Halfords—Halfords Group reported FY24 revenue of about £1.1bn, so margin pressure from tariffs and delays is material. Rules of origin and customs checks require robust compliance and forecasting; customs declarations rose markedly after 2020. Supplier diversification and nearshoring mitigate disruption risk, while EU-UK regulatory divergence could complicate product certification.
Fuel duty and motoring taxation
Changes to fuel duty and vehicle taxes influence miles driven and aftermarket demand; UK road traffic recovered to about 99% of 2019 levels in 2023 (DfT), so any fuel duty rise could reduce mileage and service visits.
Higher running costs (average pump prices peaked near £1.60/litre in 2024) encourage owners to extend vehicle lifecycles, boosting servicing and repairs.
Lower motoring costs tend to lift discretionary accessory sales, while emissions-focused policy and rising EV new‑car share (around 22% in 2024, SMMT) shift demand toward EV servicing and accessories.
Local clean air zones and ULEZ
Expansion of ULEZ and local clean air zones (Greater London expanded in Aug 2023; ULEZ charge £12.50/day) pushes owners toward vehicle upgrades or higher-frequency maintenance to meet standards, boosting demand for parts and Autocentre services while increasing bike and e-bike use as alternatives.
- Higher service demand near zones
- More parts & retrofit opportunities
- Rising bike sales as modal shift
- Political delays can change timing and demand
Business rates and planning
Reforms to business rates materially affect Halfords’ retail cost base and footprint decisions, altering store profitability and closing/opening thresholds. Planning policy divergence between retail parks and high streets shapes where new stores and Autocentres are viable, impacting site selection and CAPEX. Close engagement with local councils can secure favorable lease terms or co-funding for mobility services, while policy uncertainty complicates multi-year investment planning.
- Business rates: cost base sensitivity
- Planning: retail parks vs high street
- Council engagement: leases/co-funding
- Policy uncertainty: investment risk
£2bn travel cash, 22% EVs drive repairs & upskilling
Government active travel funding (£2bn) and Gear Change boost bike sales and services; EV new‑car share ~22% (2024) shifts Autocentre demand and upskilling needs. Post‑Brexit customs raise costs and lead times, impacting FY24 revenue ~£1.1bn and margins. ULEZ expansion and fuel price spikes (peak £1.60/litre, 2024) increase maintenance and parts demand.
| Factor | 2024/25 data |
|---|---|
| Active travel funding | £2bn |
| Halfords FY24 revenue | ~£1.1bn |
| EV share | 22% |
| Fuel peak | £1.60/l |
What is included in the product
Detailed Word Document
Explores how Political, Economic, Social, Technological, Environmental and Legal forces uniquely impact Halfords Group, with data-backed trends, region-specific regulatory context and actionable risks/opportunities; designed for executives and investors with forward-looking insights ready for reports, decks or strategy planning.
Customizable Excel Spreadsheet
A concise, category-segmented PESTLE summary of Halfords Group that can be dropped into presentations, shared across teams, and annotated with regional or business-line notes to streamline risk discussions and strategic planning.
Economic factors
Consumer confidence and inflation
Persistent headline inflation stayed above the Bank of England 2% target through 2024 while Bank rate averaged near 5%, squeezing real incomes and shifting customer spend from discretionary accessories to essential servicing.
Heightened price sensitivity drives demand for value ranges and promotions; Halfords must offset component and labour cost inflation without eroding margins.
When consumer confidence rebounds, premium bike and leisure segments can recover sharply, as seen in past post-recession uplifts.
Interest rates and financing
Bank of England rate moves alter Halfords’ financing costs for inventory and CapEx, tightening margins when borrowing costs rise and easing them when cuts occur. Consumer credit availability directly affects big-ticket bike sales and service plan uptake, with financing uptake historically boosting average transaction values. Flexible payment options smooth demand through cycles, while any rate cuts will support volume recovery but may lag due to existing inventory cycles.
Vehicle parc age and mileage
UK car parc c.33.0m vehicles with average age ~9.2 years (SMMT/2024) and RoI parc ~2.7m with avg age ~8.6 years (RSA/2023) raises maintenance and MOT frequency; post‑pandemic annual mileage stabilised near 8,000 miles (DfT/2023), keeping regular service intervals. Demand for brakes, tyres and batteries is up, supporting Autocentres utilisation (approx +6% Y/Y) and Retail-to-Autocentre cross‑sell opportunities.
Supply chain costs and FX
Fluctuations in shipping, commodity prices and GBP exchange rates materially affect Halfords landed costs, prompting use of hedging and long‑term vendor agreements to stabilise input pricing; inventory agility across stores and distribution centres is required to manage pronounced seasonality and promotion cycles. Persistent cost pressure drives SKU mix optimisation and accelerated private‑label growth to protect margins.
- hedging and vendor contracts
- inventory agility for seasonality/promos
- mix optimisation
- private‑label expansion
Cycling and leisure seasonality
Weather and holiday calendars drive clear peaks in cycling, camping and touring demand, making pre-season buying and allocation vital to avoid stockouts or steep markdowns; service teams must flex capacity for seasonal bike builds and repairs, while economic slowdowns amplify seasonality as consumers defer non-essential purchases.
- Seasonal peaks: Easter to August
- Inventory risk: pre-season allocation critical
- Service: scalable bike-build/repair capacity
- Macro impact: downturns deepen deferment
£2bn travel cash, 22% EVs drive repairs & upskilling
Persistent inflation remained above the BoE 2% target through 2024 and Bank rate averaged near 5%, squeezing real incomes and shifting spend to essential servicing. UK car parc c.33.0m (avg age 9.2) and RoI 2.7m (8.6) sustain demand for tyres/brakes/batteries; Autocentres utilisation +6% Y/Y. FX, commodity and shipping volatility raise landed costs, driving hedging, vendor contracts, SKU mix and private‑label growth. Consumer credit availability directly affects big‑ticket bike sales and AOV.
| Metric | Value |
|---|---|
| Bank rate (2024 avg) | ~5% |
| UK car parc | 33.0m (avg age 9.2) |
| RoI car parc | 2.7m (avg age 8.6) |
| Autocentres util. | +6% Y/Y |
What You See Is What You Get
Halfords Group PESTLE Analysis
The preview shown here is the exact Halfords Group PESTLE Analysis you’ll receive after purchase—fully formatted and ready to use. This is the real, finished document with full content and structure. After payment you’ll instantly download this same file.











