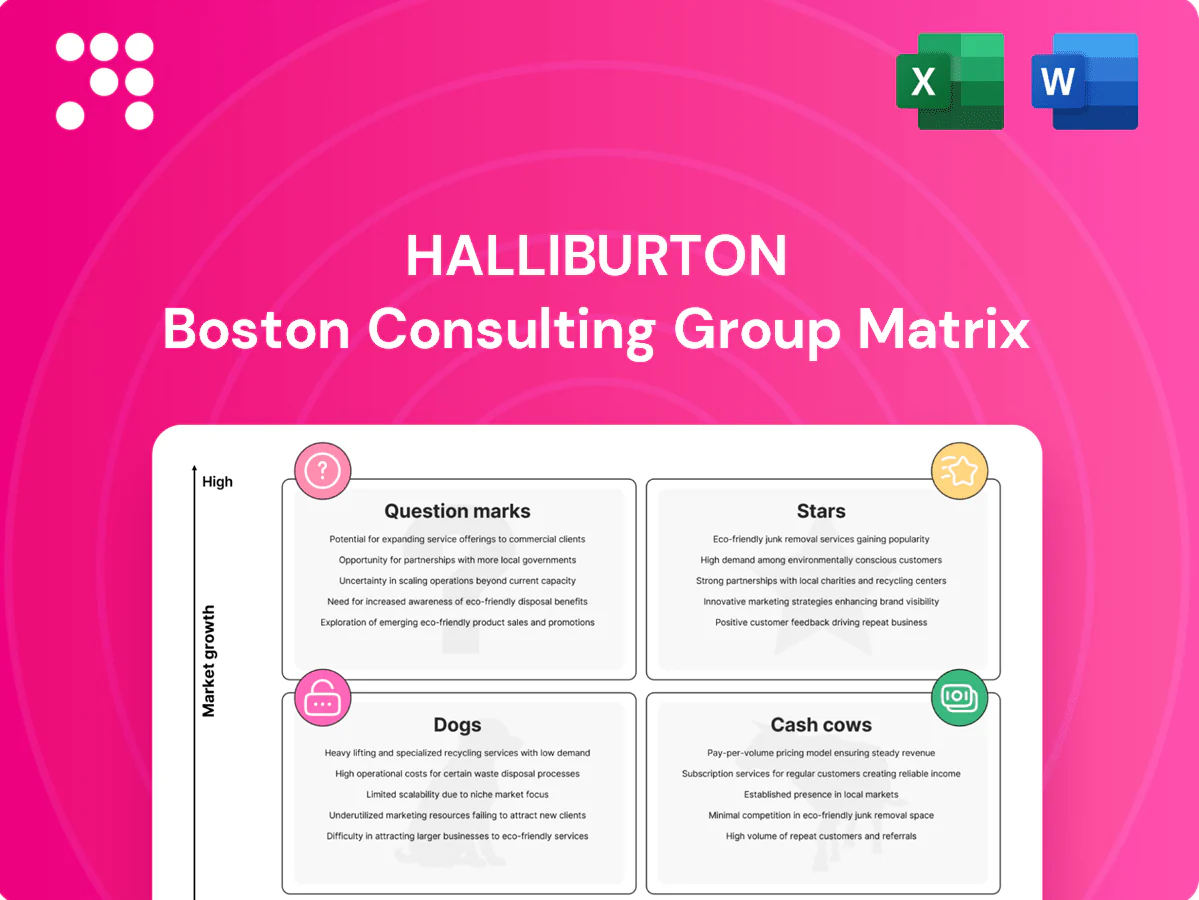
Halliburton Boston Consulting Group Matrix

Actionable Strategy Starts Here
Halliburton’s BCG Matrix snapshot shows which services are fueling growth and which are quietly draining cash—think drilling tech as a Star, legacy services as Cash Cows, and a few Question Marks worth watching. Want the full story with quadrant-level data, clear recommendations, and an action plan you can use in boardroom discussions? Purchase the complete BCG Matrix for a Word report plus an Excel summary—ready to present, decide, and move capital where it counts.
Stars

Shale completions & fracturing
Halliburton remains a Star in shale completions & fracturing, dominating North American shale with premium fleets and ~90% fleet utilization in 2024 while the global shale completions market continued to expand.
Middle East well construction
Middle East well construction sits in clear growth as multi‑year awards and rising national oil company spend (regional E&P capex topping tens of billions in 2024) expand addressable demand. Halliburton’s execution record drives outsized share on large programs, converting program wins into a backlog that supports scale. The segment is capital‑intensive but strategically critical; double down to convert backlog into durable leadership.

Production optimization services
Production optimization services sit as a Star: enhanced recovery, surveillance, and lift optimization align with customers’ sweat-the-asset focus and drove bookings growth of 12% in 2024 across key US and global basins. Halliburton’s integrated toolkits and data tie‑ins captured share, contributing to production optimization revenue expansion and higher service intensity. Fund expansion and upsell analytics initiatives launched in 2024 are positioned to cement the lead.

Integrated completions systems
Integrated completions systems—packaged tools, liner systems, and intervention bundles—deliver superior reliability and reduced cycle times, driving operator adoption as standardized designs proliferated in 2024. Halliburton’s strong share in completions places these offerings in the Stars quadrant, with the market still expanding as deepwater and unconventional programs reshore investment. Continue to press performance guarantees and tighter service integration to defend growth and margin.
- Reliability wins on repeatability
- Cycle-time reductions accelerate returns
- High share; market expansion ongoing in 2024
- Push performance guarantees and integrated services
Digital drilling automation
By 2024 automated steering, real-time optimization and remote operations at Halliburton moved decisively from pilots to program scale, with platform footprint expanding at each rig hookup and deployments accelerating across basins. Growth is rapid and capital-intensive, creating meaningful cash needs even as software-led services improve margin profiles and customer lock-in. Prioritize rollouts that secure long-term service contracts to convert growth into predictable cash flows.
- Automated steering: deploy to rigs that commit multi-year contracts
- Real-time optimization: prioritize high-margin basins for faster payback
- Remote ops: scale where hookup frequency raises switching costs
Shale at 90%; ME multi-yr wins; bookings +12%
Halliburton’s Stars: shale completions (~90% fleet utilization in 2024), Middle East well construction (multi‑year awards; regional E&P capex tens of billions in 2024), production optimization (+12% bookings in 2024) and integrated completions drive revenue and share; prioritize converting backlog and software-led wins into multi‑year contracts.
| Segment | 2024 metric | Priority |
|---|---|---|
| Shale completions | ~90% utilization | Defend fleets |
| ME well construction | Multi‑yr awards; capex>>$10bn | Convert backlog |
| Prod optimization | Bookings +12% | Upsell software |
What is included in the product
 Detailed Word Document
Concise BCG Matrix review of Halliburton’s units, identifying Stars, Cash Cows, Question Marks and Dogs with strategic recommendations.

 Customizable Excel Spreadsheet
One-page Halliburton BCG Matrix clarifying portfolio pain points—spotlights stars, cash cows, questions and dogs for fast C-level decisions
Cash Cows

Cementing services
Cementing services remain a mature, high-share Halliburton line with steady life‑of‑field demand; in 2024 the business continued to anchor well construction portfolios. Process excellence and scale protect margins through slower cycles, while low incremental capex sustains throughput. Focus on upgrading cement blends and logistics can further squeeze cash flow while milking the franchise.
Drilling fluids & additives
Halliburton's drilling fluids and additives (Baroid) deliver recurring, spec-driven volumes with entrenched customer relationships, keeping share durable while growth stayed modest, with volumes roughly flat and mid-single-digit revenue movement in 2024.
Disciplined working capital and tight inventory control turned steady demand into dependable cash generation in 2024, supporting margin capture and free-cash-flow conversion.
Priority: maintain service quality, optimize inventory levels and bank the margin to preserve this cash-cow profile.

Wireline logging in mature basins
Wireline logging in mature basins delivers steady formation evaluation revenue for Halliburton — a predictable, low-volatility segment in 2024 that supports stable crew utilization across developed fields. Capex requirements are limited relative to drill‑heavy services, allowing operating cash flow to remain concentrated. Halliburton used this cash to fund higher‑beta tech and completion investments in 2024, preserving balance‑sheet flexibility.

Rental tools & surface equipment
Rental tools & surface equipment are classic cash cows for Halliburton: high rotation and predictable utilization (typically >70% in 2024), defensible local share in key basins, flat market growth in 2024 but strong returns when assets are sweated, and maintenance capex manageable at roughly 5–7% of fleet value.
- High rotation: utilization >70% (2024)
- Market growth: flat in 2024
- Returns: mid-to-high single‑digit to mid‑teens ROIC when utilized
- Maintenance capex: ~5–7% of fleet value
- Strategy: keep fleet tight, pricing disciplined
Workovers and routine interventions
Workovers and routine interventions are classic cash cows for Halliburton: production maintenance never stops, even in soft markets, and in 2024 established service agreements and guaranteed response times continued to deter competitors. Growth is low while unit margins remain healthy due to scale and OEM-like logistics. The strategy is clear—harvest cash, tighten operating costs, and optimize throughput across legacy fields.
- 2024 focus: stabilize cash flow
- Low growth, healthy margins
- Contracted response times = competitive moat
- Prioritize capex-light efficiency gains
Cementing, drilling fluids, tools and wireline drove steady free cash flow in 2024
Cementing, drilling fluids (Baroid), wireline, rental tools and workovers acted as Halliburton cash cows in 2024: flat-to-modest growth, durable share, high utilization and low incremental capex converted steady demand into reliable free cash flow; prioritize inventory discipline, pricing and targeted blend/logistics upgrades to sustain margins.
| Service | 2024 growth | Utilization | Maint. capex | Note |
|---|---|---|---|---|
| Cementing | Flat | High | Low | Anchor |
| Baroid | Mid‑single‑digit rev | Durable | Low | Spec volumes |
| Rental tools | Flat | >70% | 5–7% | High ROI |
| Wireline | Stable | Steady | Low | Capex light |
| Workovers | Low | Consistent | Low | Contracted |
What You’re Viewing Is Included
Halliburton BCG Matrix
The Halliburton BCG Matrix you're previewing is the exact final file you'll receive after purchase — no watermarks, no placeholders. It's a polished, strategy-ready report tailored to Halliburton's portfolio dynamics, built for immediate use in presentations or planning. Buy once and download the full document for editing, printing, or sharing with stakeholders.

Actionable Strategy Starts Here
Halliburton’s BCG Matrix snapshot shows which services are fueling growth and which are quietly draining cash—think drilling tech as a Star, legacy services as Cash Cows, and a few Question Marks worth watching. Want the full story with quadrant-level data, clear recommendations, and an action plan you can use in boardroom discussions? Purchase the complete BCG Matrix for a Word report plus an Excel summary—ready to present, decide, and move capital where it counts.
Stars
Shale completions & fracturing
Halliburton remains a Star in shale completions & fracturing, dominating North American shale with premium fleets and ~90% fleet utilization in 2024 while the global shale completions market continued to expand.
Middle East well construction
Middle East well construction sits in clear growth as multi‑year awards and rising national oil company spend (regional E&P capex topping tens of billions in 2024) expand addressable demand. Halliburton’s execution record drives outsized share on large programs, converting program wins into a backlog that supports scale. The segment is capital‑intensive but strategically critical; double down to convert backlog into durable leadership.
Production optimization services
Production optimization services sit as a Star: enhanced recovery, surveillance, and lift optimization align with customers’ sweat-the-asset focus and drove bookings growth of 12% in 2024 across key US and global basins. Halliburton’s integrated toolkits and data tie‑ins captured share, contributing to production optimization revenue expansion and higher service intensity. Fund expansion and upsell analytics initiatives launched in 2024 are positioned to cement the lead.
Integrated completions systems
Integrated completions systems—packaged tools, liner systems, and intervention bundles—deliver superior reliability and reduced cycle times, driving operator adoption as standardized designs proliferated in 2024. Halliburton’s strong share in completions places these offerings in the Stars quadrant, with the market still expanding as deepwater and unconventional programs reshore investment. Continue to press performance guarantees and tighter service integration to defend growth and margin.
- Reliability wins on repeatability
- Cycle-time reductions accelerate returns
- High share; market expansion ongoing in 2024
- Push performance guarantees and integrated services
Digital drilling automation
By 2024 automated steering, real-time optimization and remote operations at Halliburton moved decisively from pilots to program scale, with platform footprint expanding at each rig hookup and deployments accelerating across basins. Growth is rapid and capital-intensive, creating meaningful cash needs even as software-led services improve margin profiles and customer lock-in. Prioritize rollouts that secure long-term service contracts to convert growth into predictable cash flows.
- Automated steering: deploy to rigs that commit multi-year contracts
- Real-time optimization: prioritize high-margin basins for faster payback
- Remote ops: scale where hookup frequency raises switching costs
Shale at 90%; ME multi-yr wins; bookings +12%
Halliburton’s Stars: shale completions (~90% fleet utilization in 2024), Middle East well construction (multi‑year awards; regional E&P capex tens of billions in 2024), production optimization (+12% bookings in 2024) and integrated completions drive revenue and share; prioritize converting backlog and software-led wins into multi‑year contracts.
| Segment | 2024 metric | Priority |
|---|---|---|
| Shale completions | ~90% utilization | Defend fleets |
| ME well construction | Multi‑yr awards; capex>>$10bn | Convert backlog |
| Prod optimization | Bookings +12% | Upsell software |
What is included in the product
Detailed Word Document
Concise BCG Matrix review of Halliburton’s units, identifying Stars, Cash Cows, Question Marks and Dogs with strategic recommendations.
Customizable Excel Spreadsheet
One-page Halliburton BCG Matrix clarifying portfolio pain points—spotlights stars, cash cows, questions and dogs for fast C-level decisions
Cash Cows
Cementing services
Cementing services remain a mature, high-share Halliburton line with steady life‑of‑field demand; in 2024 the business continued to anchor well construction portfolios. Process excellence and scale protect margins through slower cycles, while low incremental capex sustains throughput. Focus on upgrading cement blends and logistics can further squeeze cash flow while milking the franchise.
Drilling fluids & additives
Halliburton's drilling fluids and additives (Baroid) deliver recurring, spec-driven volumes with entrenched customer relationships, keeping share durable while growth stayed modest, with volumes roughly flat and mid-single-digit revenue movement in 2024.
Disciplined working capital and tight inventory control turned steady demand into dependable cash generation in 2024, supporting margin capture and free-cash-flow conversion.
Priority: maintain service quality, optimize inventory levels and bank the margin to preserve this cash-cow profile.
Wireline logging in mature basins
Wireline logging in mature basins delivers steady formation evaluation revenue for Halliburton — a predictable, low-volatility segment in 2024 that supports stable crew utilization across developed fields. Capex requirements are limited relative to drill‑heavy services, allowing operating cash flow to remain concentrated. Halliburton used this cash to fund higher‑beta tech and completion investments in 2024, preserving balance‑sheet flexibility.
Rental tools & surface equipment
Rental tools & surface equipment are classic cash cows for Halliburton: high rotation and predictable utilization (typically >70% in 2024), defensible local share in key basins, flat market growth in 2024 but strong returns when assets are sweated, and maintenance capex manageable at roughly 5–7% of fleet value.
- High rotation: utilization >70% (2024)
- Market growth: flat in 2024
- Returns: mid-to-high single‑digit to mid‑teens ROIC when utilized
- Maintenance capex: ~5–7% of fleet value
- Strategy: keep fleet tight, pricing disciplined
Workovers and routine interventions
Workovers and routine interventions are classic cash cows for Halliburton: production maintenance never stops, even in soft markets, and in 2024 established service agreements and guaranteed response times continued to deter competitors. Growth is low while unit margins remain healthy due to scale and OEM-like logistics. The strategy is clear—harvest cash, tighten operating costs, and optimize throughput across legacy fields.
- 2024 focus: stabilize cash flow
- Low growth, healthy margins
- Contracted response times = competitive moat
- Prioritize capex-light efficiency gains
Cementing, drilling fluids, tools and wireline drove steady free cash flow in 2024
Cementing, drilling fluids (Baroid), wireline, rental tools and workovers acted as Halliburton cash cows in 2024: flat-to-modest growth, durable share, high utilization and low incremental capex converted steady demand into reliable free cash flow; prioritize inventory discipline, pricing and targeted blend/logistics upgrades to sustain margins.
| Service | 2024 growth | Utilization | Maint. capex | Note |
|---|---|---|---|---|
| Cementing | Flat | High | Low | Anchor |
| Baroid | Mid‑single‑digit rev | Durable | Low | Spec volumes |
| Rental tools | Flat | >70% | 5–7% | High ROI |
| Wireline | Stable | Steady | Low | Capex light |
| Workovers | Low | Consistent | Low | Contracted |
What You’re Viewing Is Included
Halliburton BCG Matrix
The Halliburton BCG Matrix you're previewing is the exact final file you'll receive after purchase — no watermarks, no placeholders. It's a polished, strategy-ready report tailored to Halliburton's portfolio dynamics, built for immediate use in presentations or planning. Buy once and download the full document for editing, printing, or sharing with stakeholders.
Original: $10.00
-65%$10.00
$3.50Description
Actionable Strategy Starts Here
Halliburton’s BCG Matrix snapshot shows which services are fueling growth and which are quietly draining cash—think drilling tech as a Star, legacy services as Cash Cows, and a few Question Marks worth watching. Want the full story with quadrant-level data, clear recommendations, and an action plan you can use in boardroom discussions? Purchase the complete BCG Matrix for a Word report plus an Excel summary—ready to present, decide, and move capital where it counts.
Stars
Shale completions & fracturing
Halliburton remains a Star in shale completions & fracturing, dominating North American shale with premium fleets and ~90% fleet utilization in 2024 while the global shale completions market continued to expand.
Middle East well construction
Middle East well construction sits in clear growth as multi‑year awards and rising national oil company spend (regional E&P capex topping tens of billions in 2024) expand addressable demand. Halliburton’s execution record drives outsized share on large programs, converting program wins into a backlog that supports scale. The segment is capital‑intensive but strategically critical; double down to convert backlog into durable leadership.
Production optimization services
Production optimization services sit as a Star: enhanced recovery, surveillance, and lift optimization align with customers’ sweat-the-asset focus and drove bookings growth of 12% in 2024 across key US and global basins. Halliburton’s integrated toolkits and data tie‑ins captured share, contributing to production optimization revenue expansion and higher service intensity. Fund expansion and upsell analytics initiatives launched in 2024 are positioned to cement the lead.
Integrated completions systems
Integrated completions systems—packaged tools, liner systems, and intervention bundles—deliver superior reliability and reduced cycle times, driving operator adoption as standardized designs proliferated in 2024. Halliburton’s strong share in completions places these offerings in the Stars quadrant, with the market still expanding as deepwater and unconventional programs reshore investment. Continue to press performance guarantees and tighter service integration to defend growth and margin.
- Reliability wins on repeatability
- Cycle-time reductions accelerate returns
- High share; market expansion ongoing in 2024
- Push performance guarantees and integrated services
Digital drilling automation
By 2024 automated steering, real-time optimization and remote operations at Halliburton moved decisively from pilots to program scale, with platform footprint expanding at each rig hookup and deployments accelerating across basins. Growth is rapid and capital-intensive, creating meaningful cash needs even as software-led services improve margin profiles and customer lock-in. Prioritize rollouts that secure long-term service contracts to convert growth into predictable cash flows.
- Automated steering: deploy to rigs that commit multi-year contracts
- Real-time optimization: prioritize high-margin basins for faster payback
- Remote ops: scale where hookup frequency raises switching costs
Shale at 90%; ME multi-yr wins; bookings +12%
Halliburton’s Stars: shale completions (~90% fleet utilization in 2024), Middle East well construction (multi‑year awards; regional E&P capex tens of billions in 2024), production optimization (+12% bookings in 2024) and integrated completions drive revenue and share; prioritize converting backlog and software-led wins into multi‑year contracts.
| Segment | 2024 metric | Priority |
|---|---|---|
| Shale completions | ~90% utilization | Defend fleets |
| ME well construction | Multi‑yr awards; capex>>$10bn | Convert backlog |
| Prod optimization | Bookings +12% | Upsell software |
What is included in the product
Detailed Word Document
Concise BCG Matrix review of Halliburton’s units, identifying Stars, Cash Cows, Question Marks and Dogs with strategic recommendations.
Customizable Excel Spreadsheet
One-page Halliburton BCG Matrix clarifying portfolio pain points—spotlights stars, cash cows, questions and dogs for fast C-level decisions
Cash Cows
Cementing services
Cementing services remain a mature, high-share Halliburton line with steady life‑of‑field demand; in 2024 the business continued to anchor well construction portfolios. Process excellence and scale protect margins through slower cycles, while low incremental capex sustains throughput. Focus on upgrading cement blends and logistics can further squeeze cash flow while milking the franchise.
Drilling fluids & additives
Halliburton's drilling fluids and additives (Baroid) deliver recurring, spec-driven volumes with entrenched customer relationships, keeping share durable while growth stayed modest, with volumes roughly flat and mid-single-digit revenue movement in 2024.
Disciplined working capital and tight inventory control turned steady demand into dependable cash generation in 2024, supporting margin capture and free-cash-flow conversion.
Priority: maintain service quality, optimize inventory levels and bank the margin to preserve this cash-cow profile.
Wireline logging in mature basins
Wireline logging in mature basins delivers steady formation evaluation revenue for Halliburton — a predictable, low-volatility segment in 2024 that supports stable crew utilization across developed fields. Capex requirements are limited relative to drill‑heavy services, allowing operating cash flow to remain concentrated. Halliburton used this cash to fund higher‑beta tech and completion investments in 2024, preserving balance‑sheet flexibility.
Rental tools & surface equipment
Rental tools & surface equipment are classic cash cows for Halliburton: high rotation and predictable utilization (typically >70% in 2024), defensible local share in key basins, flat market growth in 2024 but strong returns when assets are sweated, and maintenance capex manageable at roughly 5–7% of fleet value.
- High rotation: utilization >70% (2024)
- Market growth: flat in 2024
- Returns: mid-to-high single‑digit to mid‑teens ROIC when utilized
- Maintenance capex: ~5–7% of fleet value
- Strategy: keep fleet tight, pricing disciplined
Workovers and routine interventions
Workovers and routine interventions are classic cash cows for Halliburton: production maintenance never stops, even in soft markets, and in 2024 established service agreements and guaranteed response times continued to deter competitors. Growth is low while unit margins remain healthy due to scale and OEM-like logistics. The strategy is clear—harvest cash, tighten operating costs, and optimize throughput across legacy fields.
- 2024 focus: stabilize cash flow
- Low growth, healthy margins
- Contracted response times = competitive moat
- Prioritize capex-light efficiency gains
Cementing, drilling fluids, tools and wireline drove steady free cash flow in 2024
Cementing, drilling fluids (Baroid), wireline, rental tools and workovers acted as Halliburton cash cows in 2024: flat-to-modest growth, durable share, high utilization and low incremental capex converted steady demand into reliable free cash flow; prioritize inventory discipline, pricing and targeted blend/logistics upgrades to sustain margins.
| Service | 2024 growth | Utilization | Maint. capex | Note |
|---|---|---|---|---|
| Cementing | Flat | High | Low | Anchor |
| Baroid | Mid‑single‑digit rev | Durable | Low | Spec volumes |
| Rental tools | Flat | >70% | 5–7% | High ROI |
| Wireline | Stable | Steady | Low | Capex light |
| Workovers | Low | Consistent | Low | Contracted |
What You’re Viewing Is Included
Halliburton BCG Matrix
The Halliburton BCG Matrix you're previewing is the exact final file you'll receive after purchase — no watermarks, no placeholders. It's a polished, strategy-ready report tailored to Halliburton's portfolio dynamics, built for immediate use in presentations or planning. Buy once and download the full document for editing, printing, or sharing with stakeholders.











