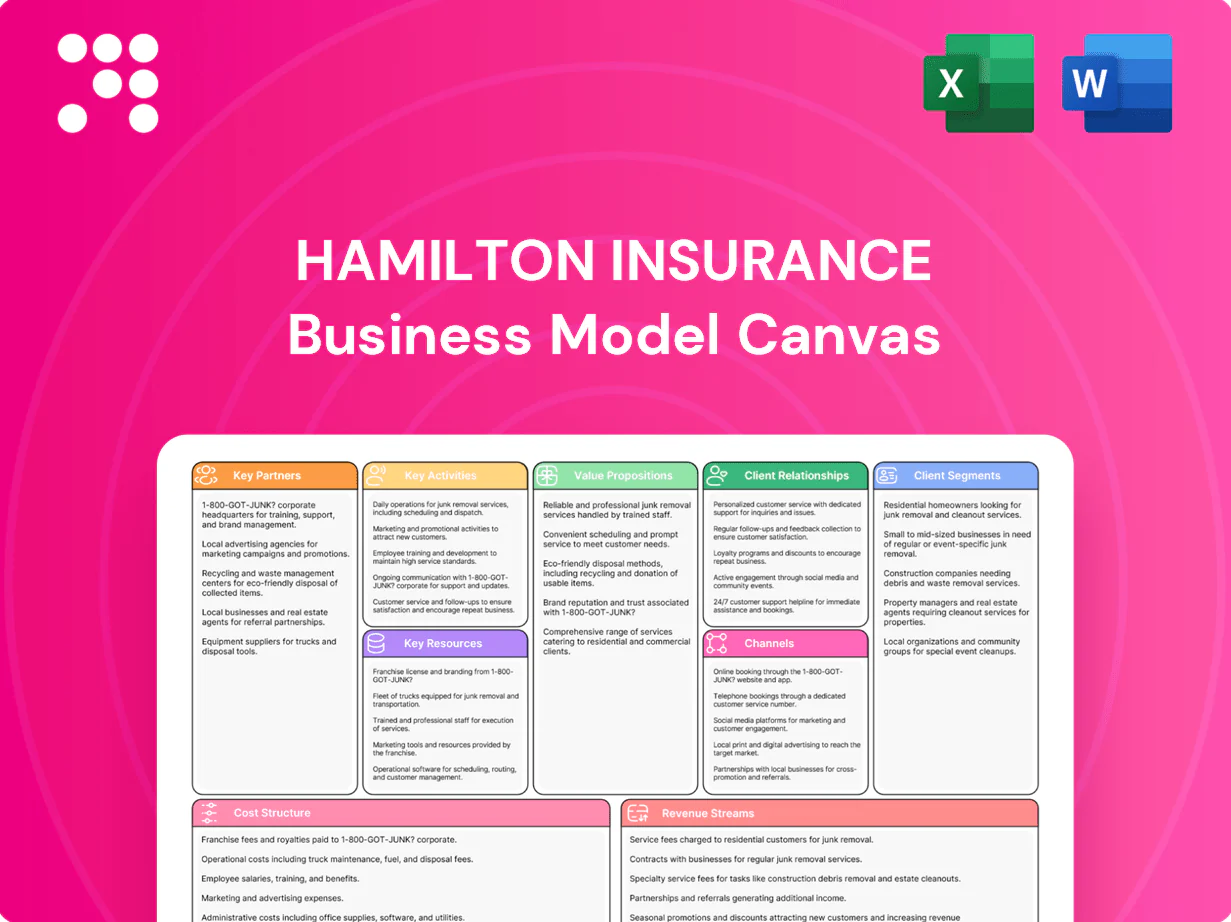
Hamilton Insurance Business Model Canvas

Unlock the full Business Model Canvas for insurers: value props, revenue & growth levers
Unlock Hamilton Insurance’s strategic playbook with the full Business Model Canvas—three insightful pages that map value propositions, customer segments, revenue streams and cost drivers. Ideal for investors, advisors and founders, this editable Word/Excel file reveals growth levers and competitive advantages you can adapt immediately. Purchase the complete Canvas to benchmark strategy, model scenarios and accelerate decision-making.
Partnerships

Global and Specialty Brokers
Partnerships with global and specialty brokers give Hamilton access to diversified, high-quality deal flow across geographies and lines, with brokers responsible for a majority of large commercial placements; the top three brokers placed over $150 billion in commercial premiums in 2024. Brokers supply market intelligence and placement expertise that improve pricing adequacy and loss selection. Joint client development raises hit rates and aligns solutions to complex risks, while strong broker ties stabilize the pipeline through market cycles.
Reinsurance Brokers and Retrocessionaires
Reinsurance brokers structure ceded programs that optimize capital efficiency and cap peak exposures, enabling Hamilton to scale cat, casualty, and specialty lines while keeping net retentions prudent.
Retrocessionaires supply aggregate and event cover that smooths earnings volatility; market-wide retro capacity remained tight in 2024 after consecutive loss seasons.
These disciplined transfers bolster rating agency confidence by demonstrating measurable risk-transfer and capital management governance.

Data, Modeling, and Technology Vendors
Catastrophe modelers (RMS, AIR), cyber platforms (Coalition, BitSight) and third‑party data providers tighten risk selection and pricing, supporting insurers as cyber premiums rose about 25% in 2024. Cloud, analytics and AI partners cut underwriting cycle times and enable real‑time decisioning across pipelines. Vendor ecosystems can shorten time‑to‑market for new products by roughly 30% and scale predictive claims and fraud detection via ML models.

Managing General Agents and Program Administrators
Managing General Agents and program administrators expand Hamiltons distribution into niche specialty segments through delegated underwriting; by 2024 MGAs write over $100bn globally and represent roughly 10% of US commercial P&C flow, enabling fee economics and optional risk sharing that support capital-light growth while shared data protocols improve portfolio oversight and governance and joint product design accelerates entry into underserved markets.
- Distribution: niche reach via delegated underwriting
- Economics: fee income plus optional risk share for capital efficiency
- Governance: data-sharing boosts portfolio visibility
- Speed: co-designed programs shorten time-to-market
Ratings Agencies, Regulators, and Capital Providers
Strong relationships with ratings agencies underpin Hamilton Insurance Group's financial strength credentials, supporting market access and product pricing in 2024 while regulatory engagement across Bermuda, London and the US ensures compliance across multiple jurisdictions. Equity and alternative capital partners enable disciplined growth and volatility management, and transparent dialogue optimizes capital allocation and stakeholder trust.
Brokers drive flows; reinsurers tighten; MGAs scale, cyber premiums +25% in 2024
Global brokers (top 3 placed >$150bn commercial premiums in 2024) drive diversified flow and pricing; reinsurers/retrocessionaires tighten net retentions amid constrained retro capacity in 2024. MGAs (>$100bn run‑rate) and tech partners cut time‑to‑market ~30% and support underwriting scale; cyber premiums rose ~25% in 2024. Ratings, regulators (Bermuda/London/US) and capital partners sustain capital discipline and market access.
| Partner | 2024 Metric |
|---|---|
| Top brokers | >$150bn premiums |
| MGAs | >$100bn written |
| Cyber vendors | +25% premiums |
What is included in the product
 Detailed Word Document
A comprehensive Business Model Canvas tailored to Hamilton Insurance’s strategy, detailing customer segments, channels, value propositions, revenue streams, and cost structure across the nine BMC blocks. Ideal for presentations and investor discussions, it includes competitive advantage analysis, SWOT-linked insights, and practical recommendations to support strategic decisions and validation using real-world company data.

 Customizable Excel Spreadsheet
Condenses Hamilton Insurance’s complex strategy into a clean, one-page Business Model Canvas that saves hours formatting, clarifies core components for quick review, and is shareable/editable for team collaboration and iterative strategy development.
Activities

Specialty Underwriting and Pricing
Risk selection, structuring and pricing across property, casualty and specialty classes are core to Hamilton Insurance Group, a Bermuda-based underwriter founded in 2013. Technical underwriting integrates exposure analytics and portfolio context, leveraging advanced models and portfolio reviews to manage tail risk. Tight governance enforces authority limits and referral discipline while continuous calibration supports margin resilience.
Portfolio and Exposure Management
Monitoring aggregates, PMLs and clash across geographies and perils reduces tail risk by identifying concentration build-ups and informing reinsurance purchases.
Scenario testing and RDS drive limit deployment decisions, prioritizing exposures that materially affect capital under stress.
Capital allocation aligns with return-on-risk targets while dynamic rebalancing adjusts portfolio mix in response to market-rate and term shifts.

Claims Management and Loss Control
Proactive claims handling preserves client satisfaction and cuts loss-adjustment expense (LAE), with McKinsey 2024 estimating analytics-driven claims programs can reduce LAE by up to 30%. Data-driven triage flags complex, high-severity losses early, improving outcomes. Robust vendor networks speed resolution and recovery—repair cycles shortened by ~25% in benchmark studies. Closed-loop feedback informs underwriting adjustments and loss prevention.

Reinsurance and Retro Placement
Reinsurance and retro placement uses structured treaties to stabilize earnings and expand underwriting capacity, while timing and layering calibrate the cost versus protection trade-off across peak perils. Counterparty selection balances price, contract terms, and credit quality to preserve capital efficiency. Rigorous post-bind monitoring verifies coverage effectiveness and informs renewal strategy.
- Structured treaties: earnings stability & capacity
- Timing & layering: cost vs protection
- Counterparty selection: price, terms, credit
- Post-bind monitoring: coverage effectiveness
Data Science, Modeling, and Automation
Machine learning and advanced analytics accelerate quote-to-bind, improving speed ~35% and reducing pricing variance; model governance enforces explainability and regulatory acceptability with versioned model registries; automation removes manual touchpoints across submissions and bordereaux, cutting processing load; engineering pipelines preserve data quality and lineage for auditability.
- ML: ~35% faster quotes
- Governance: model registries
- Automation: fewer manual submissions
- Engineering: end-to-end lineage
Analytics-led underwriting: LAE down ~30%, quotes ~35%, repairs ~25%
Risk selection, pricing and portfolio calibration drive underwriting returns; exposure analytics and PML/clash monitoring limit tail risk. Reinsurance structuring stabilizes earnings while active capital allocation hits return-on-risk targets. Analytics-led claims and automation cut LAE (~30% McKinsey 2024), speed quotes ~35% and shorten repair cycles ~25%.
| Activity | Impact | 2024 metric |
|---|---|---|
| Claims analytics | Reduce LAE | ~30% (McKinsey 2024) |
| Automation/ML | Faster quote-to-bind | ~35% faster |
| Vendor networks | Faster repairs | ~25% shorter cycles |
Full Version Awaits
Business Model Canvas
The document you're previewing is the actual Hamilton Insurance Business Model Canvas, not a mockup or sample. When you complete your purchase you'll receive this same file in full, formatted and ready to edit in Word and Excel. No content or pages are withheld—what you see is exactly what you’ll download and use for presentations, analysis, and planning.

Unlock the full Business Model Canvas for insurers: value props, revenue & growth levers
Unlock Hamilton Insurance’s strategic playbook with the full Business Model Canvas—three insightful pages that map value propositions, customer segments, revenue streams and cost drivers. Ideal for investors, advisors and founders, this editable Word/Excel file reveals growth levers and competitive advantages you can adapt immediately. Purchase the complete Canvas to benchmark strategy, model scenarios and accelerate decision-making.
Partnerships
Global and Specialty Brokers
Partnerships with global and specialty brokers give Hamilton access to diversified, high-quality deal flow across geographies and lines, with brokers responsible for a majority of large commercial placements; the top three brokers placed over $150 billion in commercial premiums in 2024. Brokers supply market intelligence and placement expertise that improve pricing adequacy and loss selection. Joint client development raises hit rates and aligns solutions to complex risks, while strong broker ties stabilize the pipeline through market cycles.
Reinsurance Brokers and Retrocessionaires
Reinsurance brokers structure ceded programs that optimize capital efficiency and cap peak exposures, enabling Hamilton to scale cat, casualty, and specialty lines while keeping net retentions prudent.
Retrocessionaires supply aggregate and event cover that smooths earnings volatility; market-wide retro capacity remained tight in 2024 after consecutive loss seasons.
These disciplined transfers bolster rating agency confidence by demonstrating measurable risk-transfer and capital management governance.
Data, Modeling, and Technology Vendors
Catastrophe modelers (RMS, AIR), cyber platforms (Coalition, BitSight) and third‑party data providers tighten risk selection and pricing, supporting insurers as cyber premiums rose about 25% in 2024. Cloud, analytics and AI partners cut underwriting cycle times and enable real‑time decisioning across pipelines. Vendor ecosystems can shorten time‑to‑market for new products by roughly 30% and scale predictive claims and fraud detection via ML models.
Managing General Agents and Program Administrators
Managing General Agents and program administrators expand Hamiltons distribution into niche specialty segments through delegated underwriting; by 2024 MGAs write over $100bn globally and represent roughly 10% of US commercial P&C flow, enabling fee economics and optional risk sharing that support capital-light growth while shared data protocols improve portfolio oversight and governance and joint product design accelerates entry into underserved markets.
- Distribution: niche reach via delegated underwriting
- Economics: fee income plus optional risk share for capital efficiency
- Governance: data-sharing boosts portfolio visibility
- Speed: co-designed programs shorten time-to-market
Ratings Agencies, Regulators, and Capital Providers
Strong relationships with ratings agencies underpin Hamilton Insurance Group's financial strength credentials, supporting market access and product pricing in 2024 while regulatory engagement across Bermuda, London and the US ensures compliance across multiple jurisdictions. Equity and alternative capital partners enable disciplined growth and volatility management, and transparent dialogue optimizes capital allocation and stakeholder trust.
Brokers drive flows; reinsurers tighten; MGAs scale, cyber premiums +25% in 2024
Global brokers (top 3 placed >$150bn commercial premiums in 2024) drive diversified flow and pricing; reinsurers/retrocessionaires tighten net retentions amid constrained retro capacity in 2024. MGAs (>$100bn run‑rate) and tech partners cut time‑to‑market ~30% and support underwriting scale; cyber premiums rose ~25% in 2024. Ratings, regulators (Bermuda/London/US) and capital partners sustain capital discipline and market access.
| Partner | 2024 Metric |
|---|---|
| Top brokers | >$150bn premiums |
| MGAs | >$100bn written |
| Cyber vendors | +25% premiums |
What is included in the product
Detailed Word Document
A comprehensive Business Model Canvas tailored to Hamilton Insurance’s strategy, detailing customer segments, channels, value propositions, revenue streams, and cost structure across the nine BMC blocks. Ideal for presentations and investor discussions, it includes competitive advantage analysis, SWOT-linked insights, and practical recommendations to support strategic decisions and validation using real-world company data.
Customizable Excel Spreadsheet
Condenses Hamilton Insurance’s complex strategy into a clean, one-page Business Model Canvas that saves hours formatting, clarifies core components for quick review, and is shareable/editable for team collaboration and iterative strategy development.
Activities
Specialty Underwriting and Pricing
Risk selection, structuring and pricing across property, casualty and specialty classes are core to Hamilton Insurance Group, a Bermuda-based underwriter founded in 2013. Technical underwriting integrates exposure analytics and portfolio context, leveraging advanced models and portfolio reviews to manage tail risk. Tight governance enforces authority limits and referral discipline while continuous calibration supports margin resilience.
Portfolio and Exposure Management
Monitoring aggregates, PMLs and clash across geographies and perils reduces tail risk by identifying concentration build-ups and informing reinsurance purchases.
Scenario testing and RDS drive limit deployment decisions, prioritizing exposures that materially affect capital under stress.
Capital allocation aligns with return-on-risk targets while dynamic rebalancing adjusts portfolio mix in response to market-rate and term shifts.
Claims Management and Loss Control
Proactive claims handling preserves client satisfaction and cuts loss-adjustment expense (LAE), with McKinsey 2024 estimating analytics-driven claims programs can reduce LAE by up to 30%. Data-driven triage flags complex, high-severity losses early, improving outcomes. Robust vendor networks speed resolution and recovery—repair cycles shortened by ~25% in benchmark studies. Closed-loop feedback informs underwriting adjustments and loss prevention.
Reinsurance and Retro Placement
Reinsurance and retro placement uses structured treaties to stabilize earnings and expand underwriting capacity, while timing and layering calibrate the cost versus protection trade-off across peak perils. Counterparty selection balances price, contract terms, and credit quality to preserve capital efficiency. Rigorous post-bind monitoring verifies coverage effectiveness and informs renewal strategy.
- Structured treaties: earnings stability & capacity
- Timing & layering: cost vs protection
- Counterparty selection: price, terms, credit
- Post-bind monitoring: coverage effectiveness
Data Science, Modeling, and Automation
Machine learning and advanced analytics accelerate quote-to-bind, improving speed ~35% and reducing pricing variance; model governance enforces explainability and regulatory acceptability with versioned model registries; automation removes manual touchpoints across submissions and bordereaux, cutting processing load; engineering pipelines preserve data quality and lineage for auditability.
- ML: ~35% faster quotes
- Governance: model registries
- Automation: fewer manual submissions
- Engineering: end-to-end lineage
Analytics-led underwriting: LAE down ~30%, quotes ~35%, repairs ~25%
Risk selection, pricing and portfolio calibration drive underwriting returns; exposure analytics and PML/clash monitoring limit tail risk. Reinsurance structuring stabilizes earnings while active capital allocation hits return-on-risk targets. Analytics-led claims and automation cut LAE (~30% McKinsey 2024), speed quotes ~35% and shorten repair cycles ~25%.
| Activity | Impact | 2024 metric |
|---|---|---|
| Claims analytics | Reduce LAE | ~30% (McKinsey 2024) |
| Automation/ML | Faster quote-to-bind | ~35% faster |
| Vendor networks | Faster repairs | ~25% shorter cycles |
Full Version Awaits
Business Model Canvas
The document you're previewing is the actual Hamilton Insurance Business Model Canvas, not a mockup or sample. When you complete your purchase you'll receive this same file in full, formatted and ready to edit in Word and Excel. No content or pages are withheld—what you see is exactly what you’ll download and use for presentations, analysis, and planning.
Description
Unlock the full Business Model Canvas for insurers: value props, revenue & growth levers
Unlock Hamilton Insurance’s strategic playbook with the full Business Model Canvas—three insightful pages that map value propositions, customer segments, revenue streams and cost drivers. Ideal for investors, advisors and founders, this editable Word/Excel file reveals growth levers and competitive advantages you can adapt immediately. Purchase the complete Canvas to benchmark strategy, model scenarios and accelerate decision-making.
Partnerships
Global and Specialty Brokers
Partnerships with global and specialty brokers give Hamilton access to diversified, high-quality deal flow across geographies and lines, with brokers responsible for a majority of large commercial placements; the top three brokers placed over $150 billion in commercial premiums in 2024. Brokers supply market intelligence and placement expertise that improve pricing adequacy and loss selection. Joint client development raises hit rates and aligns solutions to complex risks, while strong broker ties stabilize the pipeline through market cycles.
Reinsurance Brokers and Retrocessionaires
Reinsurance brokers structure ceded programs that optimize capital efficiency and cap peak exposures, enabling Hamilton to scale cat, casualty, and specialty lines while keeping net retentions prudent.
Retrocessionaires supply aggregate and event cover that smooths earnings volatility; market-wide retro capacity remained tight in 2024 after consecutive loss seasons.
These disciplined transfers bolster rating agency confidence by demonstrating measurable risk-transfer and capital management governance.
Data, Modeling, and Technology Vendors
Catastrophe modelers (RMS, AIR), cyber platforms (Coalition, BitSight) and third‑party data providers tighten risk selection and pricing, supporting insurers as cyber premiums rose about 25% in 2024. Cloud, analytics and AI partners cut underwriting cycle times and enable real‑time decisioning across pipelines. Vendor ecosystems can shorten time‑to‑market for new products by roughly 30% and scale predictive claims and fraud detection via ML models.
Managing General Agents and Program Administrators
Managing General Agents and program administrators expand Hamiltons distribution into niche specialty segments through delegated underwriting; by 2024 MGAs write over $100bn globally and represent roughly 10% of US commercial P&C flow, enabling fee economics and optional risk sharing that support capital-light growth while shared data protocols improve portfolio oversight and governance and joint product design accelerates entry into underserved markets.
- Distribution: niche reach via delegated underwriting
- Economics: fee income plus optional risk share for capital efficiency
- Governance: data-sharing boosts portfolio visibility
- Speed: co-designed programs shorten time-to-market
Ratings Agencies, Regulators, and Capital Providers
Strong relationships with ratings agencies underpin Hamilton Insurance Group's financial strength credentials, supporting market access and product pricing in 2024 while regulatory engagement across Bermuda, London and the US ensures compliance across multiple jurisdictions. Equity and alternative capital partners enable disciplined growth and volatility management, and transparent dialogue optimizes capital allocation and stakeholder trust.
Brokers drive flows; reinsurers tighten; MGAs scale, cyber premiums +25% in 2024
Global brokers (top 3 placed >$150bn commercial premiums in 2024) drive diversified flow and pricing; reinsurers/retrocessionaires tighten net retentions amid constrained retro capacity in 2024. MGAs (>$100bn run‑rate) and tech partners cut time‑to‑market ~30% and support underwriting scale; cyber premiums rose ~25% in 2024. Ratings, regulators (Bermuda/London/US) and capital partners sustain capital discipline and market access.
| Partner | 2024 Metric |
|---|---|
| Top brokers | >$150bn premiums |
| MGAs | >$100bn written |
| Cyber vendors | +25% premiums |
What is included in the product
Detailed Word Document
A comprehensive Business Model Canvas tailored to Hamilton Insurance’s strategy, detailing customer segments, channels, value propositions, revenue streams, and cost structure across the nine BMC blocks. Ideal for presentations and investor discussions, it includes competitive advantage analysis, SWOT-linked insights, and practical recommendations to support strategic decisions and validation using real-world company data.
Customizable Excel Spreadsheet
Condenses Hamilton Insurance’s complex strategy into a clean, one-page Business Model Canvas that saves hours formatting, clarifies core components for quick review, and is shareable/editable for team collaboration and iterative strategy development.
Activities
Specialty Underwriting and Pricing
Risk selection, structuring and pricing across property, casualty and specialty classes are core to Hamilton Insurance Group, a Bermuda-based underwriter founded in 2013. Technical underwriting integrates exposure analytics and portfolio context, leveraging advanced models and portfolio reviews to manage tail risk. Tight governance enforces authority limits and referral discipline while continuous calibration supports margin resilience.
Portfolio and Exposure Management
Monitoring aggregates, PMLs and clash across geographies and perils reduces tail risk by identifying concentration build-ups and informing reinsurance purchases.
Scenario testing and RDS drive limit deployment decisions, prioritizing exposures that materially affect capital under stress.
Capital allocation aligns with return-on-risk targets while dynamic rebalancing adjusts portfolio mix in response to market-rate and term shifts.
Claims Management and Loss Control
Proactive claims handling preserves client satisfaction and cuts loss-adjustment expense (LAE), with McKinsey 2024 estimating analytics-driven claims programs can reduce LAE by up to 30%. Data-driven triage flags complex, high-severity losses early, improving outcomes. Robust vendor networks speed resolution and recovery—repair cycles shortened by ~25% in benchmark studies. Closed-loop feedback informs underwriting adjustments and loss prevention.
Reinsurance and Retro Placement
Reinsurance and retro placement uses structured treaties to stabilize earnings and expand underwriting capacity, while timing and layering calibrate the cost versus protection trade-off across peak perils. Counterparty selection balances price, contract terms, and credit quality to preserve capital efficiency. Rigorous post-bind monitoring verifies coverage effectiveness and informs renewal strategy.
- Structured treaties: earnings stability & capacity
- Timing & layering: cost vs protection
- Counterparty selection: price, terms, credit
- Post-bind monitoring: coverage effectiveness
Data Science, Modeling, and Automation
Machine learning and advanced analytics accelerate quote-to-bind, improving speed ~35% and reducing pricing variance; model governance enforces explainability and regulatory acceptability with versioned model registries; automation removes manual touchpoints across submissions and bordereaux, cutting processing load; engineering pipelines preserve data quality and lineage for auditability.
- ML: ~35% faster quotes
- Governance: model registries
- Automation: fewer manual submissions
- Engineering: end-to-end lineage
Analytics-led underwriting: LAE down ~30%, quotes ~35%, repairs ~25%
Risk selection, pricing and portfolio calibration drive underwriting returns; exposure analytics and PML/clash monitoring limit tail risk. Reinsurance structuring stabilizes earnings while active capital allocation hits return-on-risk targets. Analytics-led claims and automation cut LAE (~30% McKinsey 2024), speed quotes ~35% and shorten repair cycles ~25%.
| Activity | Impact | 2024 metric |
|---|---|---|
| Claims analytics | Reduce LAE | ~30% (McKinsey 2024) |
| Automation/ML | Faster quote-to-bind | ~35% faster |
| Vendor networks | Faster repairs | ~25% shorter cycles |
Full Version Awaits
Business Model Canvas
The document you're previewing is the actual Hamilton Insurance Business Model Canvas, not a mockup or sample. When you complete your purchase you'll receive this same file in full, formatted and ready to edit in Word and Excel. No content or pages are withheld—what you see is exactly what you’ll download and use for presentations, analysis, and planning.











