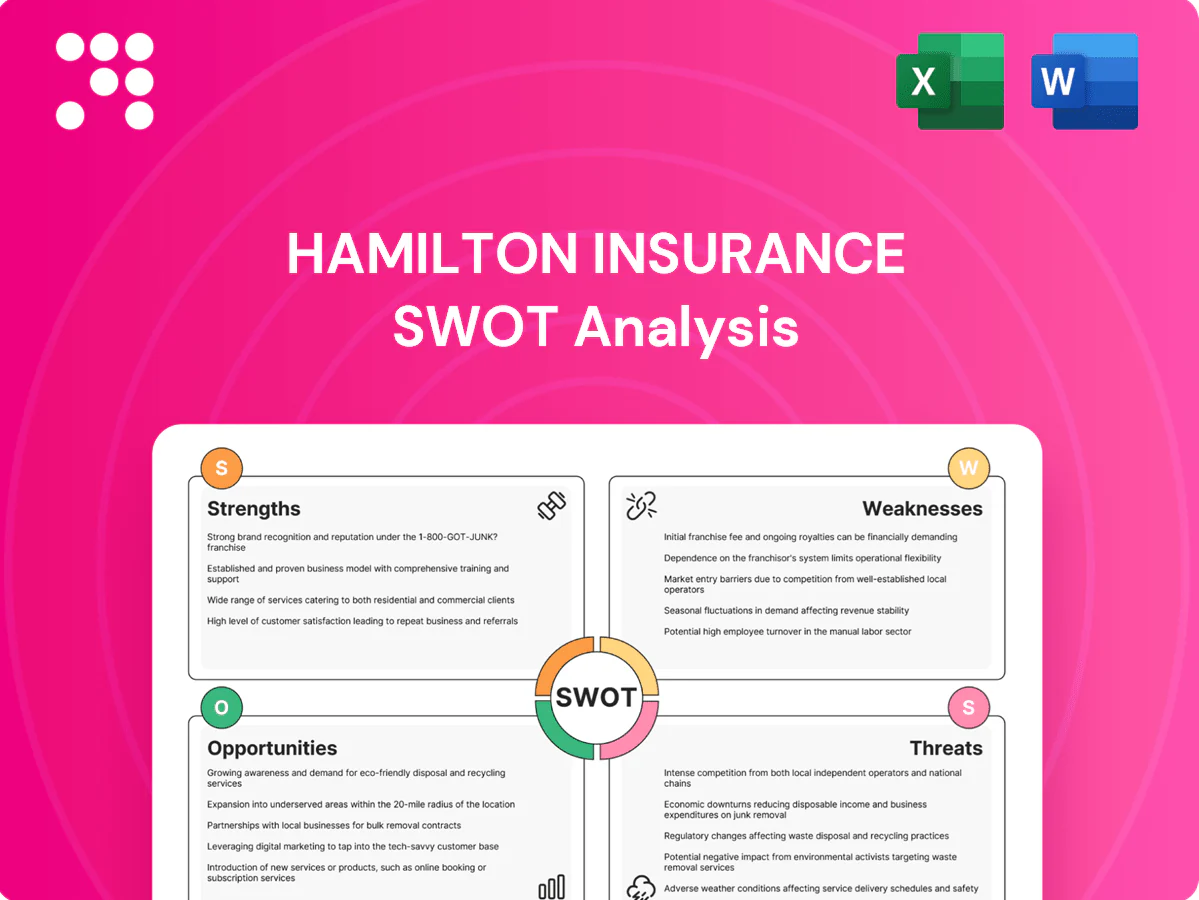
Hamilton Insurance SWOT Analysis

Your Strategic Toolkit Starts Here
Hamilton Insurance SWOT reveals underwriting strength, capital resilience, and niche market reach, while flagging catastrophe exposure and competitive pressures. This snapshot highlights opportunities in tech-enabled risk selection and geographic diversification. Purchase the full SWOT analysis to access a professionally written, editable report with detailed insights, financial context, and actionable recommendations for investors and strategists.
Strengths

Diversified specialty portfolio
Diversified coverage across property, casualty, and niche specialty lines balances risk and revenue streams, reducing reliance on any single market cycle. This diversification supports cross-cycle earnings resilience through offsetting performance between lines. It also enables tailored solutions for complex client needs, enhancing retention and margin potential.
Global reinsurance footprint
Hamilton’s global reinsurance footprint enables broad distribution and diversified risk exposure across markets, supporting portfolio optimization and improved capital efficiency. Worldwide operations enhance deal flow and provide early insight into emerging risks. Deep relationships with brokers and cedents are reinforced by global presence and tailored capacity solutions.

Data-science-led underwriting
Advanced analytics at Hamilton Insurance sharpen risk selection, pricing, and capacity allocation, enabling faster, data-informed decisions that improve loss ratios and speed to quote. Continuous model learning refines predictive accuracy over time and adapts to new perils and exposure changes. This data-science-led approach creates a defensible operating edge through repeatable, scalable underwriting workflows.

Tech-enabled claims management
Tech-enabled claims management uses automation and analytics to streamline triage, fraud detection and settlement, delivering up to 60% faster processing and materially lower leakage; better execution raises NPS and reduces claims cost. Feedback loops feed underwriting and product design, lowering loss ratios and driving a virtuous performance cycle.
- Automation: faster triage (~60%)
- Fraud/Leakage: lower payouts
- CX: higher NPS, lower churn
- Underwriting: data-driven products
Specialty expertise and agility
Hamilton's focus on complex risks builds underwriting authority and broker trust, while a nimble operating model allows rapid adjustment to market dislocations. Product tailoring captures profitable niches and reinforces disciplined growth rather than scale-at-all-costs.
- Underwriting authority
- Operational agility
- Niche profitability
- Disciplined growth
Insurer trims combined ratio to 88%, lifts GWP to $4.2bn
Hamilton’s diversified property, casualty and specialty portfolio reduced combined ratio to 88% in 2024, supporting stable underwriting income. Global reinsurance reach grew gross written premium to $4.2bn (FY 2024), improving capital efficiency. Tech-led underwriting and claims cut claims cycle ~60% and lifted NPS to 72, reinforcing broker trust.
| Metric | 2024 |
|---|---|
| Combined ratio | 88% |
| GWP | $4.2bn |
| Claims cycle | -60% |
| NPS | 72 |
What is included in the product
 Detailed Word Document
Provides a concise SWOT analysis of Hamilton Insurance, outlining internal strengths and weaknesses and identifying external opportunities and threats to assess the company’s strategic position and growth potential.

 Customizable Excel Spreadsheet
Delivers a concise SWOT matrix for Hamilton Insurance, enabling rapid strategic alignment and clear stakeholder communication for faster risk and opportunity decisions.
Weaknesses

Catastrophe loss volatility
Exposure to property and specialty cat risks can drive sharp earnings swings for Hamilton, with global insured nat-cat losses at about $120bn in 2023 (Swiss Re) stressing results. Secondary-peril aggregation complicates risk control and modeling. Aon reported retro/hedging costs rose roughly 30% in 2023–24, which can compress margins. Such volatility can pressure ratings and investor sentiment.
Scale versus mega-peers
Smaller scale limits Hamilton Insurance’s negotiating power and expense leverage versus mega-peers, constraining pricing and reinsurance terms.
Larger incumbents can outbid on distribution and talent, capturing high-margin accounts and senior underwriting teams.
Market access therefore depends more on broker relationships, which can raise acquisition costs, especially in hard-market cycles.

Model and data dependency
Reliance on vendor models and external data introduces basis risk for Hamilton, with model drift and parameter uncertainty increasingly impairing pricing accuracy across casualty and specialty lines.
Integrating heterogeneous datasets across geographies and product lines remains complex, raising reconciliation costs and operational risk.
Tight governance and validation requirements further slow deployment cycles, often extending model rollouts by months in large insurers.

Reserve and tail risk sensitivity
Long-tail casualty and specialty lines expose Hamilton to development uncertainty and social inflation that can pressure prior-year reserves; small reserve misses across multiple accident years can compound and materially erode capital flexibility.
- Reserve sensitivity
- Social inflation pressure
- Compounding misses
- Capital erosion risk
Regulatory and compliance burden
Global operations force Hamilton to navigate diverse solvency and reporting regimes, increasing legal complexity and operational overhead. Compliance costs and extended approval timelines can delay product launches. Data privacy rules like GDPR (fines up to 4% of global turnover) and the EU AI Act (fines up to 7%) tighten AI use. Non-compliance risks material fines and reputational damage.
- Diverse solvency/reporting regimes
- Approval delays hinder launches
- GDPR: fines up to 4% turnover
- EU AI Act: fines up to 7% turnover
- Reputational and financial risk
Nat‑cat & long‑tail reserve risk erode margins, capital — US$120bn, +30%
Exposure to property/specialty cat risk drives earnings volatility (global nat-cat losses ~US$120bn in 2023). Retro/hedging costs rose ~30% in 2023–24, compressing margins. Smaller scale limits reinsurance/pricing leverage versus mega-peers. Long‑tail reserve sensitivity and social inflation risk could compound prior‑year misses and erode capital.
| Metric | Value | Impact |
|---|---|---|
| Nat‑cat losses | US$120bn (2023) | Earnings volatility |
| Retro/hedge costs | +30% (2023–24) | Margin compression |
| GDPR fine | Up to 4% turnover | Regulatory risk |
| EU AI Act fine | Up to 7% turnover | Compliance cost |
Preview the Actual Deliverable
Hamilton Insurance SWOT Analysis
This is the actual SWOT analysis document you’ll receive upon purchase—no surprises, just professional quality. The preview below is taken directly from the full SWOT report you'll get, and the complete, editable version becomes available after checkout. You’re viewing a live excerpt of the final file; buy now to unlock the entire detailed report.

Your Strategic Toolkit Starts Here
Hamilton Insurance SWOT reveals underwriting strength, capital resilience, and niche market reach, while flagging catastrophe exposure and competitive pressures. This snapshot highlights opportunities in tech-enabled risk selection and geographic diversification. Purchase the full SWOT analysis to access a professionally written, editable report with detailed insights, financial context, and actionable recommendations for investors and strategists.
Strengths
Diversified specialty portfolio
Diversified coverage across property, casualty, and niche specialty lines balances risk and revenue streams, reducing reliance on any single market cycle. This diversification supports cross-cycle earnings resilience through offsetting performance between lines. It also enables tailored solutions for complex client needs, enhancing retention and margin potential.
Global reinsurance footprint
Hamilton’s global reinsurance footprint enables broad distribution and diversified risk exposure across markets, supporting portfolio optimization and improved capital efficiency. Worldwide operations enhance deal flow and provide early insight into emerging risks. Deep relationships with brokers and cedents are reinforced by global presence and tailored capacity solutions.
Data-science-led underwriting
Advanced analytics at Hamilton Insurance sharpen risk selection, pricing, and capacity allocation, enabling faster, data-informed decisions that improve loss ratios and speed to quote. Continuous model learning refines predictive accuracy over time and adapts to new perils and exposure changes. This data-science-led approach creates a defensible operating edge through repeatable, scalable underwriting workflows.
Tech-enabled claims management
Tech-enabled claims management uses automation and analytics to streamline triage, fraud detection and settlement, delivering up to 60% faster processing and materially lower leakage; better execution raises NPS and reduces claims cost. Feedback loops feed underwriting and product design, lowering loss ratios and driving a virtuous performance cycle.
- Automation: faster triage (~60%)
- Fraud/Leakage: lower payouts
- CX: higher NPS, lower churn
- Underwriting: data-driven products
Specialty expertise and agility
Hamilton's focus on complex risks builds underwriting authority and broker trust, while a nimble operating model allows rapid adjustment to market dislocations. Product tailoring captures profitable niches and reinforces disciplined growth rather than scale-at-all-costs.
- Underwriting authority
- Operational agility
- Niche profitability
- Disciplined growth
Insurer trims combined ratio to 88%, lifts GWP to $4.2bn
Hamilton’s diversified property, casualty and specialty portfolio reduced combined ratio to 88% in 2024, supporting stable underwriting income. Global reinsurance reach grew gross written premium to $4.2bn (FY 2024), improving capital efficiency. Tech-led underwriting and claims cut claims cycle ~60% and lifted NPS to 72, reinforcing broker trust.
| Metric | 2024 |
|---|---|
| Combined ratio | 88% |
| GWP | $4.2bn |
| Claims cycle | -60% |
| NPS | 72 |
What is included in the product
Detailed Word Document
Provides a concise SWOT analysis of Hamilton Insurance, outlining internal strengths and weaknesses and identifying external opportunities and threats to assess the company’s strategic position and growth potential.
Customizable Excel Spreadsheet
Delivers a concise SWOT matrix for Hamilton Insurance, enabling rapid strategic alignment and clear stakeholder communication for faster risk and opportunity decisions.
Weaknesses
Catastrophe loss volatility
Exposure to property and specialty cat risks can drive sharp earnings swings for Hamilton, with global insured nat-cat losses at about $120bn in 2023 (Swiss Re) stressing results. Secondary-peril aggregation complicates risk control and modeling. Aon reported retro/hedging costs rose roughly 30% in 2023–24, which can compress margins. Such volatility can pressure ratings and investor sentiment.
Scale versus mega-peers
Smaller scale limits Hamilton Insurance’s negotiating power and expense leverage versus mega-peers, constraining pricing and reinsurance terms.
Larger incumbents can outbid on distribution and talent, capturing high-margin accounts and senior underwriting teams.
Market access therefore depends more on broker relationships, which can raise acquisition costs, especially in hard-market cycles.
Model and data dependency
Reliance on vendor models and external data introduces basis risk for Hamilton, with model drift and parameter uncertainty increasingly impairing pricing accuracy across casualty and specialty lines.
Integrating heterogeneous datasets across geographies and product lines remains complex, raising reconciliation costs and operational risk.
Tight governance and validation requirements further slow deployment cycles, often extending model rollouts by months in large insurers.
Reserve and tail risk sensitivity
Long-tail casualty and specialty lines expose Hamilton to development uncertainty and social inflation that can pressure prior-year reserves; small reserve misses across multiple accident years can compound and materially erode capital flexibility.
- Reserve sensitivity
- Social inflation pressure
- Compounding misses
- Capital erosion risk
Regulatory and compliance burden
Global operations force Hamilton to navigate diverse solvency and reporting regimes, increasing legal complexity and operational overhead. Compliance costs and extended approval timelines can delay product launches. Data privacy rules like GDPR (fines up to 4% of global turnover) and the EU AI Act (fines up to 7%) tighten AI use. Non-compliance risks material fines and reputational damage.
- Diverse solvency/reporting regimes
- Approval delays hinder launches
- GDPR: fines up to 4% turnover
- EU AI Act: fines up to 7% turnover
- Reputational and financial risk
Nat‑cat & long‑tail reserve risk erode margins, capital — US$120bn, +30%
Exposure to property/specialty cat risk drives earnings volatility (global nat-cat losses ~US$120bn in 2023). Retro/hedging costs rose ~30% in 2023–24, compressing margins. Smaller scale limits reinsurance/pricing leverage versus mega-peers. Long‑tail reserve sensitivity and social inflation risk could compound prior‑year misses and erode capital.
| Metric | Value | Impact |
|---|---|---|
| Nat‑cat losses | US$120bn (2023) | Earnings volatility |
| Retro/hedge costs | +30% (2023–24) | Margin compression |
| GDPR fine | Up to 4% turnover | Regulatory risk |
| EU AI Act fine | Up to 7% turnover | Compliance cost |
Preview the Actual Deliverable
Hamilton Insurance SWOT Analysis
This is the actual SWOT analysis document you’ll receive upon purchase—no surprises, just professional quality. The preview below is taken directly from the full SWOT report you'll get, and the complete, editable version becomes available after checkout. You’re viewing a live excerpt of the final file; buy now to unlock the entire detailed report.
Description
Your Strategic Toolkit Starts Here
Hamilton Insurance SWOT reveals underwriting strength, capital resilience, and niche market reach, while flagging catastrophe exposure and competitive pressures. This snapshot highlights opportunities in tech-enabled risk selection and geographic diversification. Purchase the full SWOT analysis to access a professionally written, editable report with detailed insights, financial context, and actionable recommendations for investors and strategists.
Strengths
Diversified specialty portfolio
Diversified coverage across property, casualty, and niche specialty lines balances risk and revenue streams, reducing reliance on any single market cycle. This diversification supports cross-cycle earnings resilience through offsetting performance between lines. It also enables tailored solutions for complex client needs, enhancing retention and margin potential.
Global reinsurance footprint
Hamilton’s global reinsurance footprint enables broad distribution and diversified risk exposure across markets, supporting portfolio optimization and improved capital efficiency. Worldwide operations enhance deal flow and provide early insight into emerging risks. Deep relationships with brokers and cedents are reinforced by global presence and tailored capacity solutions.
Data-science-led underwriting
Advanced analytics at Hamilton Insurance sharpen risk selection, pricing, and capacity allocation, enabling faster, data-informed decisions that improve loss ratios and speed to quote. Continuous model learning refines predictive accuracy over time and adapts to new perils and exposure changes. This data-science-led approach creates a defensible operating edge through repeatable, scalable underwriting workflows.
Tech-enabled claims management
Tech-enabled claims management uses automation and analytics to streamline triage, fraud detection and settlement, delivering up to 60% faster processing and materially lower leakage; better execution raises NPS and reduces claims cost. Feedback loops feed underwriting and product design, lowering loss ratios and driving a virtuous performance cycle.
- Automation: faster triage (~60%)
- Fraud/Leakage: lower payouts
- CX: higher NPS, lower churn
- Underwriting: data-driven products
Specialty expertise and agility
Hamilton's focus on complex risks builds underwriting authority and broker trust, while a nimble operating model allows rapid adjustment to market dislocations. Product tailoring captures profitable niches and reinforces disciplined growth rather than scale-at-all-costs.
- Underwriting authority
- Operational agility
- Niche profitability
- Disciplined growth
Insurer trims combined ratio to 88%, lifts GWP to $4.2bn
Hamilton’s diversified property, casualty and specialty portfolio reduced combined ratio to 88% in 2024, supporting stable underwriting income. Global reinsurance reach grew gross written premium to $4.2bn (FY 2024), improving capital efficiency. Tech-led underwriting and claims cut claims cycle ~60% and lifted NPS to 72, reinforcing broker trust.
| Metric | 2024 |
|---|---|
| Combined ratio | 88% |
| GWP | $4.2bn |
| Claims cycle | -60% |
| NPS | 72 |
What is included in the product
Detailed Word Document
Provides a concise SWOT analysis of Hamilton Insurance, outlining internal strengths and weaknesses and identifying external opportunities and threats to assess the company’s strategic position and growth potential.
Customizable Excel Spreadsheet
Delivers a concise SWOT matrix for Hamilton Insurance, enabling rapid strategic alignment and clear stakeholder communication for faster risk and opportunity decisions.
Weaknesses
Catastrophe loss volatility
Exposure to property and specialty cat risks can drive sharp earnings swings for Hamilton, with global insured nat-cat losses at about $120bn in 2023 (Swiss Re) stressing results. Secondary-peril aggregation complicates risk control and modeling. Aon reported retro/hedging costs rose roughly 30% in 2023–24, which can compress margins. Such volatility can pressure ratings and investor sentiment.
Scale versus mega-peers
Smaller scale limits Hamilton Insurance’s negotiating power and expense leverage versus mega-peers, constraining pricing and reinsurance terms.
Larger incumbents can outbid on distribution and talent, capturing high-margin accounts and senior underwriting teams.
Market access therefore depends more on broker relationships, which can raise acquisition costs, especially in hard-market cycles.
Model and data dependency
Reliance on vendor models and external data introduces basis risk for Hamilton, with model drift and parameter uncertainty increasingly impairing pricing accuracy across casualty and specialty lines.
Integrating heterogeneous datasets across geographies and product lines remains complex, raising reconciliation costs and operational risk.
Tight governance and validation requirements further slow deployment cycles, often extending model rollouts by months in large insurers.
Reserve and tail risk sensitivity
Long-tail casualty and specialty lines expose Hamilton to development uncertainty and social inflation that can pressure prior-year reserves; small reserve misses across multiple accident years can compound and materially erode capital flexibility.
- Reserve sensitivity
- Social inflation pressure
- Compounding misses
- Capital erosion risk
Regulatory and compliance burden
Global operations force Hamilton to navigate diverse solvency and reporting regimes, increasing legal complexity and operational overhead. Compliance costs and extended approval timelines can delay product launches. Data privacy rules like GDPR (fines up to 4% of global turnover) and the EU AI Act (fines up to 7%) tighten AI use. Non-compliance risks material fines and reputational damage.
- Diverse solvency/reporting regimes
- Approval delays hinder launches
- GDPR: fines up to 4% turnover
- EU AI Act: fines up to 7% turnover
- Reputational and financial risk
Nat‑cat & long‑tail reserve risk erode margins, capital — US$120bn, +30%
Exposure to property/specialty cat risk drives earnings volatility (global nat-cat losses ~US$120bn in 2023). Retro/hedging costs rose ~30% in 2023–24, compressing margins. Smaller scale limits reinsurance/pricing leverage versus mega-peers. Long‑tail reserve sensitivity and social inflation risk could compound prior‑year misses and erode capital.
| Metric | Value | Impact |
|---|---|---|
| Nat‑cat losses | US$120bn (2023) | Earnings volatility |
| Retro/hedge costs | +30% (2023–24) | Margin compression |
| GDPR fine | Up to 4% turnover | Regulatory risk |
| EU AI Act fine | Up to 7% turnover | Compliance cost |
Preview the Actual Deliverable
Hamilton Insurance SWOT Analysis
This is the actual SWOT analysis document you’ll receive upon purchase—no surprises, just professional quality. The preview below is taken directly from the full SWOT report you'll get, and the complete, editable version becomes available after checkout. You’re viewing a live excerpt of the final file; buy now to unlock the entire detailed report.











