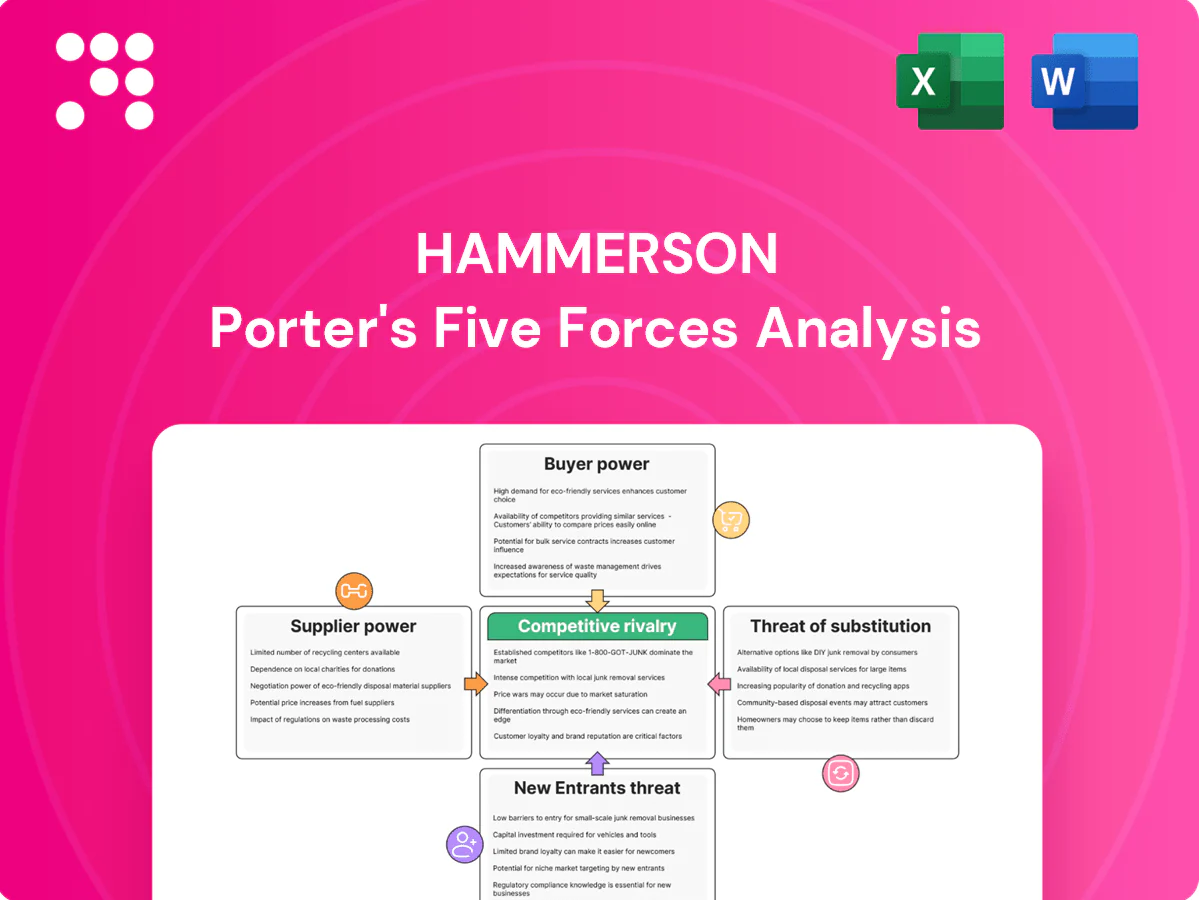
Hammerson Porter's Five Forces Analysis

From Overview to Strategy Blueprint
Hammerson faces moderate buyer power and evolving retail substitution pressures driven by e‑commerce, while tenant concentration and development costs shape supplier bargaining; entry barriers are mixed given capital intensity and planning constraints. This snapshot highlights key competitive dynamics and risks. Unlock the full Porter's Five Forces Analysis for force-by-force ratings, visuals, and actionable strategy guidance.
Suppliers Bargaining Power

Constructions and fit-out contractors
Major developments and refurbishments depend on a concentrated pool of Tier-1 contractors and specialist fit-out firms, giving suppliers leverage during busy cycles. Capacity constraints and inflationary pressure have periodically pushed pricing power toward contractors. Long-term frameworks and competitive tendering partially blunt this leverage. Project phasing and value engineering further reduce dependency risk.
Facilities, FM, and maintenance vendors
Cleaning, security, M&E and landscaping providers are abundant, but switching costs arise from site-specific knowledge and service continuity, so Hammerson secures multi-asset contracts to consolidate spend and improve leverage. KPI-linked SLAs commonly tie 5–10% of fees to performance and periodic retendering on 3–5 year cycles curbs price escalation. Adoption of IoT-enabled FM platforms increases transparency and reduces supplier bargaining power.

Utilities and energy providers
Power and heating are essential for large destinations and volatile wholesale prices (peaks in 2022–23) increased supplier leverage, though by 2024 many markets had partially normalized. Aggregated procurement and on-site renewables (solar/battery) reduce exposure; corporate PPAs and regulatory price caps offer partial stability. Energy-efficiency upgrades can cut long-term demand and lower dependence on spot markets.

Technology platforms and data systems
By 2024 leasing CRMs, footfall analytics and tenant engagement apps in Hammerson assets can create vendor lock-in that limits switching; API openness and modular stacks reduce concentration risk; multi-vendor strategies preserve negotiating flexibility; and explicit data ownership clauses are essential to retain strategic control and monetisation options.
- Vendor lock-in risk
- API openness mitigates concentration
- Multi-vendor leverage
- Data ownership clauses
Capital and professional services
Debt providers, valuers and advisors shape Hammerson’s cost of capital and deal execution; competitive banking syndicates lower individual lender power but tighter credit cycles (Bank of England base rate 5.25% in 2024) can reverse this. REIT status and high-quality shopping destinations improve access and pricing, while diversified funding (bank, bonds, equity, JV) reduces dependency on any single supplier.
- Debt providers: syndication lowers lender grip
- Credit cycle (2024 rate 5.25%): can tighten terms
- REIT/asset quality: better access and margins
- Funding mix: reduces single-supplier risk
Contractor pricing spikes, FM flexibility; energy volatility pushes PPAs
Concentrated Tier‑1 contractors exert periodic pricing power during development peaks; frameworks and phasing reduce this. FM suppliers are abundant but site-specific switching costs give modest leverage; multi-asset contracts and IoT lower it. Energy suppliers showed high volatility (2022–23); 2024 mitigation includes PPAs, on‑site renewables and efficiency.
| Supplier | Concentration | Price risk | Mitigation |
|---|---|---|---|
| Contractors | High | Medium‑High | Frameworks, phasing |
| FM | Low | Low‑Med | Multi‑asset contracts, IoT |
| Energy | Med | High (peaks 2022–23) | PPAs, on‑site renewables |
| Debt | Low (syndicates) | Rate 5.25% (2024) | Diversified funding |
What is included in the product
 Detailed Word Document
Tailored Porter's Five Forces analysis for Hammerson that uncovers competitive drivers, buyer/supplier power, entry barriers and substitutes, highlights disruptive threats to market share, and is fully editable for reports, investor decks or strategy use.

 Customizable Excel Spreadsheet
A concise Hammerson-focused Five Forces summary that instantly highlights landlord negotiating leverage, tenant risk, and competitive threats—ideal for fast, board-ready decisions to reduce analysis bottlenecks.
Customers Bargaining Power

Anchor tenants and global brands
Anchor tenants and global brands drive c.40% of mall footfall, enabling them to negotiate preferential rents, longer leases and turnover clauses. Their exit risk can push vacancy above local averages and depress neighbouring rents, as seen where anchor departures have raised local vacancy by 2–5 percentage points. Co-investment in store formats and marketing (often 10–30% of launch budgets) aligns incentives, while a diversified tenant mix caps any single tenant’s leverage.
Specialty retailers and F&B operators
Fragmentation across specialty retailers and F&B operators limits individual bargaining power, yet oversupply in categories like casual dining pushed vacancy in affected schemes to around 14% in 2024, heightening rent sensitivity. Growth in flexible leasing—turnover rents used in ~35% of new F&B deals and shorter average lease terms—shifts risk to landlords, while curated clustering lifts willingness to pay and can boost rent premiums by 10–20%.

Outlet tenants and brand partners
Premium outlet brands are highly performance-driven and rate-sensitive, often negotiating rents linked to sales performance; turnover rents in outlet markets commonly range around 5–12% of sales. Cross-asset relationships let landlords trade space across locations to optimize brand mix and uplift portfolio sales. Real-time POS data sharing underpins turnover rental models and marketing allocation. Strong catchment pull at major outlets materially reduces tenant bargaining leverage.

Pop-ups, experiential, and coworking users
Short-duration occupiers such as pop-ups, experiential brands and coworking users demand flexibility and discounts, raising churn but helping activation; Savills 2024 noted pop-ups made c.12% of urban retail activations, softening vacancy impact and partially offsetting pressure on headline rents. Standardized short-form leases and performance-based terms streamline negotiations and align incentives, reducing transaction friction and sharing upside with landlords.
Advertising, media, and ancillary users
DOOH and sponsorship buyers can shift spend across channels, limiting Hammerson’s leverage, but verified audience metrics and centre footfall data (Hammerson reported c. 25m annual visits across core UK sites in 2024) bolster its price positioning. Bundled multi-site inventory and cross-venue packages dilute buyer power by raising switching costs, while programmatic sales — representing a majority of traded DOOH impressions by 2024 — add liquidity and enable dynamic yield management.
- audience verification: strengthens CPM premium
- bundled inventory: reduces buyer bargaining
- programmatic liquidity: improves yield
- cross-channel alternatives: cap pricing
Anchors drive 40% footfall; casual dining vacancy 14% shifts landlord risk
Anchor tenants/global brands drive c.40% of footfall, enabling preferential rents and exits that can raise local vacancy by 2–5pp. Fragmented specialty retail limits single-tenant power, but casual dining oversupply (vacancy c.14% in 2024) and ~35% of new F&B deals using turnover rents shift risk to landlords. Pop-ups (c.12% activations) and DOOH audience metrics (Hammerson c.25m visits 2024) moderate customer leverage.
| Metric | 2024 | Impact |
|---|---|---|
| Anchor share | c.40% | High negotiating power |
| Casual dining vacancy | c.14% | Heightened rent sensitivity |
| Turnover F&B deals | ~35% | Risk shifted to landlord |
| Pop-ups | c.12% | Activation, higher churn |
| Annual visits | c.25m | DOOH pricing power |
Full Version Awaits
Hammerson Porter's Five Forces Analysis
This preview shows the exact Hammerson Porter's Five Forces Analysis you'll receive—no placeholders or samples. The document displayed is fully formatted and ready for immediate download upon purchase. You're viewing the final, complete file that will be delivered to you.

From Overview to Strategy Blueprint
Hammerson faces moderate buyer power and evolving retail substitution pressures driven by e‑commerce, while tenant concentration and development costs shape supplier bargaining; entry barriers are mixed given capital intensity and planning constraints. This snapshot highlights key competitive dynamics and risks. Unlock the full Porter's Five Forces Analysis for force-by-force ratings, visuals, and actionable strategy guidance.
Suppliers Bargaining Power
Constructions and fit-out contractors
Major developments and refurbishments depend on a concentrated pool of Tier-1 contractors and specialist fit-out firms, giving suppliers leverage during busy cycles. Capacity constraints and inflationary pressure have periodically pushed pricing power toward contractors. Long-term frameworks and competitive tendering partially blunt this leverage. Project phasing and value engineering further reduce dependency risk.
Facilities, FM, and maintenance vendors
Cleaning, security, M&E and landscaping providers are abundant, but switching costs arise from site-specific knowledge and service continuity, so Hammerson secures multi-asset contracts to consolidate spend and improve leverage. KPI-linked SLAs commonly tie 5–10% of fees to performance and periodic retendering on 3–5 year cycles curbs price escalation. Adoption of IoT-enabled FM platforms increases transparency and reduces supplier bargaining power.
Utilities and energy providers
Power and heating are essential for large destinations and volatile wholesale prices (peaks in 2022–23) increased supplier leverage, though by 2024 many markets had partially normalized. Aggregated procurement and on-site renewables (solar/battery) reduce exposure; corporate PPAs and regulatory price caps offer partial stability. Energy-efficiency upgrades can cut long-term demand and lower dependence on spot markets.
Technology platforms and data systems
By 2024 leasing CRMs, footfall analytics and tenant engagement apps in Hammerson assets can create vendor lock-in that limits switching; API openness and modular stacks reduce concentration risk; multi-vendor strategies preserve negotiating flexibility; and explicit data ownership clauses are essential to retain strategic control and monetisation options.
- Vendor lock-in risk
- API openness mitigates concentration
- Multi-vendor leverage
- Data ownership clauses
Capital and professional services
Debt providers, valuers and advisors shape Hammerson’s cost of capital and deal execution; competitive banking syndicates lower individual lender power but tighter credit cycles (Bank of England base rate 5.25% in 2024) can reverse this. REIT status and high-quality shopping destinations improve access and pricing, while diversified funding (bank, bonds, equity, JV) reduces dependency on any single supplier.
- Debt providers: syndication lowers lender grip
- Credit cycle (2024 rate 5.25%): can tighten terms
- REIT/asset quality: better access and margins
- Funding mix: reduces single-supplier risk
Contractor pricing spikes, FM flexibility; energy volatility pushes PPAs
Concentrated Tier‑1 contractors exert periodic pricing power during development peaks; frameworks and phasing reduce this. FM suppliers are abundant but site-specific switching costs give modest leverage; multi-asset contracts and IoT lower it. Energy suppliers showed high volatility (2022–23); 2024 mitigation includes PPAs, on‑site renewables and efficiency.
| Supplier | Concentration | Price risk | Mitigation |
|---|---|---|---|
| Contractors | High | Medium‑High | Frameworks, phasing |
| FM | Low | Low‑Med | Multi‑asset contracts, IoT |
| Energy | Med | High (peaks 2022–23) | PPAs, on‑site renewables |
| Debt | Low (syndicates) | Rate 5.25% (2024) | Diversified funding |
What is included in the product
Detailed Word Document
Tailored Porter's Five Forces analysis for Hammerson that uncovers competitive drivers, buyer/supplier power, entry barriers and substitutes, highlights disruptive threats to market share, and is fully editable for reports, investor decks or strategy use.
Customizable Excel Spreadsheet
A concise Hammerson-focused Five Forces summary that instantly highlights landlord negotiating leverage, tenant risk, and competitive threats—ideal for fast, board-ready decisions to reduce analysis bottlenecks.
Customers Bargaining Power
Anchor tenants and global brands
Anchor tenants and global brands drive c.40% of mall footfall, enabling them to negotiate preferential rents, longer leases and turnover clauses. Their exit risk can push vacancy above local averages and depress neighbouring rents, as seen where anchor departures have raised local vacancy by 2–5 percentage points. Co-investment in store formats and marketing (often 10–30% of launch budgets) aligns incentives, while a diversified tenant mix caps any single tenant’s leverage.
Specialty retailers and F&B operators
Fragmentation across specialty retailers and F&B operators limits individual bargaining power, yet oversupply in categories like casual dining pushed vacancy in affected schemes to around 14% in 2024, heightening rent sensitivity. Growth in flexible leasing—turnover rents used in ~35% of new F&B deals and shorter average lease terms—shifts risk to landlords, while curated clustering lifts willingness to pay and can boost rent premiums by 10–20%.
Outlet tenants and brand partners
Premium outlet brands are highly performance-driven and rate-sensitive, often negotiating rents linked to sales performance; turnover rents in outlet markets commonly range around 5–12% of sales. Cross-asset relationships let landlords trade space across locations to optimize brand mix and uplift portfolio sales. Real-time POS data sharing underpins turnover rental models and marketing allocation. Strong catchment pull at major outlets materially reduces tenant bargaining leverage.
Pop-ups, experiential, and coworking users
Short-duration occupiers such as pop-ups, experiential brands and coworking users demand flexibility and discounts, raising churn but helping activation; Savills 2024 noted pop-ups made c.12% of urban retail activations, softening vacancy impact and partially offsetting pressure on headline rents. Standardized short-form leases and performance-based terms streamline negotiations and align incentives, reducing transaction friction and sharing upside with landlords.
Advertising, media, and ancillary users
DOOH and sponsorship buyers can shift spend across channels, limiting Hammerson’s leverage, but verified audience metrics and centre footfall data (Hammerson reported c. 25m annual visits across core UK sites in 2024) bolster its price positioning. Bundled multi-site inventory and cross-venue packages dilute buyer power by raising switching costs, while programmatic sales — representing a majority of traded DOOH impressions by 2024 — add liquidity and enable dynamic yield management.
- audience verification: strengthens CPM premium
- bundled inventory: reduces buyer bargaining
- programmatic liquidity: improves yield
- cross-channel alternatives: cap pricing
Anchors drive 40% footfall; casual dining vacancy 14% shifts landlord risk
Anchor tenants/global brands drive c.40% of footfall, enabling preferential rents and exits that can raise local vacancy by 2–5pp. Fragmented specialty retail limits single-tenant power, but casual dining oversupply (vacancy c.14% in 2024) and ~35% of new F&B deals using turnover rents shift risk to landlords. Pop-ups (c.12% activations) and DOOH audience metrics (Hammerson c.25m visits 2024) moderate customer leverage.
| Metric | 2024 | Impact |
|---|---|---|
| Anchor share | c.40% | High negotiating power |
| Casual dining vacancy | c.14% | Heightened rent sensitivity |
| Turnover F&B deals | ~35% | Risk shifted to landlord |
| Pop-ups | c.12% | Activation, higher churn |
| Annual visits | c.25m | DOOH pricing power |
Full Version Awaits
Hammerson Porter's Five Forces Analysis
This preview shows the exact Hammerson Porter's Five Forces Analysis you'll receive—no placeholders or samples. The document displayed is fully formatted and ready for immediate download upon purchase. You're viewing the final, complete file that will be delivered to you.
Description
From Overview to Strategy Blueprint
Hammerson faces moderate buyer power and evolving retail substitution pressures driven by e‑commerce, while tenant concentration and development costs shape supplier bargaining; entry barriers are mixed given capital intensity and planning constraints. This snapshot highlights key competitive dynamics and risks. Unlock the full Porter's Five Forces Analysis for force-by-force ratings, visuals, and actionable strategy guidance.
Suppliers Bargaining Power
Constructions and fit-out contractors
Major developments and refurbishments depend on a concentrated pool of Tier-1 contractors and specialist fit-out firms, giving suppliers leverage during busy cycles. Capacity constraints and inflationary pressure have periodically pushed pricing power toward contractors. Long-term frameworks and competitive tendering partially blunt this leverage. Project phasing and value engineering further reduce dependency risk.
Facilities, FM, and maintenance vendors
Cleaning, security, M&E and landscaping providers are abundant, but switching costs arise from site-specific knowledge and service continuity, so Hammerson secures multi-asset contracts to consolidate spend and improve leverage. KPI-linked SLAs commonly tie 5–10% of fees to performance and periodic retendering on 3–5 year cycles curbs price escalation. Adoption of IoT-enabled FM platforms increases transparency and reduces supplier bargaining power.
Utilities and energy providers
Power and heating are essential for large destinations and volatile wholesale prices (peaks in 2022–23) increased supplier leverage, though by 2024 many markets had partially normalized. Aggregated procurement and on-site renewables (solar/battery) reduce exposure; corporate PPAs and regulatory price caps offer partial stability. Energy-efficiency upgrades can cut long-term demand and lower dependence on spot markets.
Technology platforms and data systems
By 2024 leasing CRMs, footfall analytics and tenant engagement apps in Hammerson assets can create vendor lock-in that limits switching; API openness and modular stacks reduce concentration risk; multi-vendor strategies preserve negotiating flexibility; and explicit data ownership clauses are essential to retain strategic control and monetisation options.
- Vendor lock-in risk
- API openness mitigates concentration
- Multi-vendor leverage
- Data ownership clauses
Capital and professional services
Debt providers, valuers and advisors shape Hammerson’s cost of capital and deal execution; competitive banking syndicates lower individual lender power but tighter credit cycles (Bank of England base rate 5.25% in 2024) can reverse this. REIT status and high-quality shopping destinations improve access and pricing, while diversified funding (bank, bonds, equity, JV) reduces dependency on any single supplier.
- Debt providers: syndication lowers lender grip
- Credit cycle (2024 rate 5.25%): can tighten terms
- REIT/asset quality: better access and margins
- Funding mix: reduces single-supplier risk
Contractor pricing spikes, FM flexibility; energy volatility pushes PPAs
Concentrated Tier‑1 contractors exert periodic pricing power during development peaks; frameworks and phasing reduce this. FM suppliers are abundant but site-specific switching costs give modest leverage; multi-asset contracts and IoT lower it. Energy suppliers showed high volatility (2022–23); 2024 mitigation includes PPAs, on‑site renewables and efficiency.
| Supplier | Concentration | Price risk | Mitigation |
|---|---|---|---|
| Contractors | High | Medium‑High | Frameworks, phasing |
| FM | Low | Low‑Med | Multi‑asset contracts, IoT |
| Energy | Med | High (peaks 2022–23) | PPAs, on‑site renewables |
| Debt | Low (syndicates) | Rate 5.25% (2024) | Diversified funding |
What is included in the product
Detailed Word Document
Tailored Porter's Five Forces analysis for Hammerson that uncovers competitive drivers, buyer/supplier power, entry barriers and substitutes, highlights disruptive threats to market share, and is fully editable for reports, investor decks or strategy use.
Customizable Excel Spreadsheet
A concise Hammerson-focused Five Forces summary that instantly highlights landlord negotiating leverage, tenant risk, and competitive threats—ideal for fast, board-ready decisions to reduce analysis bottlenecks.
Customers Bargaining Power
Anchor tenants and global brands
Anchor tenants and global brands drive c.40% of mall footfall, enabling them to negotiate preferential rents, longer leases and turnover clauses. Their exit risk can push vacancy above local averages and depress neighbouring rents, as seen where anchor departures have raised local vacancy by 2–5 percentage points. Co-investment in store formats and marketing (often 10–30% of launch budgets) aligns incentives, while a diversified tenant mix caps any single tenant’s leverage.
Specialty retailers and F&B operators
Fragmentation across specialty retailers and F&B operators limits individual bargaining power, yet oversupply in categories like casual dining pushed vacancy in affected schemes to around 14% in 2024, heightening rent sensitivity. Growth in flexible leasing—turnover rents used in ~35% of new F&B deals and shorter average lease terms—shifts risk to landlords, while curated clustering lifts willingness to pay and can boost rent premiums by 10–20%.
Outlet tenants and brand partners
Premium outlet brands are highly performance-driven and rate-sensitive, often negotiating rents linked to sales performance; turnover rents in outlet markets commonly range around 5–12% of sales. Cross-asset relationships let landlords trade space across locations to optimize brand mix and uplift portfolio sales. Real-time POS data sharing underpins turnover rental models and marketing allocation. Strong catchment pull at major outlets materially reduces tenant bargaining leverage.
Pop-ups, experiential, and coworking users
Short-duration occupiers such as pop-ups, experiential brands and coworking users demand flexibility and discounts, raising churn but helping activation; Savills 2024 noted pop-ups made c.12% of urban retail activations, softening vacancy impact and partially offsetting pressure on headline rents. Standardized short-form leases and performance-based terms streamline negotiations and align incentives, reducing transaction friction and sharing upside with landlords.
Advertising, media, and ancillary users
DOOH and sponsorship buyers can shift spend across channels, limiting Hammerson’s leverage, but verified audience metrics and centre footfall data (Hammerson reported c. 25m annual visits across core UK sites in 2024) bolster its price positioning. Bundled multi-site inventory and cross-venue packages dilute buyer power by raising switching costs, while programmatic sales — representing a majority of traded DOOH impressions by 2024 — add liquidity and enable dynamic yield management.
- audience verification: strengthens CPM premium
- bundled inventory: reduces buyer bargaining
- programmatic liquidity: improves yield
- cross-channel alternatives: cap pricing
Anchors drive 40% footfall; casual dining vacancy 14% shifts landlord risk
Anchor tenants/global brands drive c.40% of footfall, enabling preferential rents and exits that can raise local vacancy by 2–5pp. Fragmented specialty retail limits single-tenant power, but casual dining oversupply (vacancy c.14% in 2024) and ~35% of new F&B deals using turnover rents shift risk to landlords. Pop-ups (c.12% activations) and DOOH audience metrics (Hammerson c.25m visits 2024) moderate customer leverage.
| Metric | 2024 | Impact |
|---|---|---|
| Anchor share | c.40% | High negotiating power |
| Casual dining vacancy | c.14% | Heightened rent sensitivity |
| Turnover F&B deals | ~35% | Risk shifted to landlord |
| Pop-ups | c.12% | Activation, higher churn |
| Annual visits | c.25m | DOOH pricing power |
Full Version Awaits
Hammerson Porter's Five Forces Analysis
This preview shows the exact Hammerson Porter's Five Forces Analysis you'll receive—no placeholders or samples. The document displayed is fully formatted and ready for immediate download upon purchase. You're viewing the final, complete file that will be delivered to you.











