Hansol Paper Business Model Canvas

Business Model Canvas: Strategic blueprint for value, scale and margin in paper manufacturing
Unlock the full strategic blueprint behind Hansol Paper’s business model in our detailed Business Model Canvas—three to five succinct sections reveal how the firm creates value, scales operations, and secures margins. Ideal for investors, consultants, and entrepreneurs seeking actionable insights. Purchase the complete Word & Excel files to benchmark, adapt, and implement proven strategies.
Partnerships

Global pulp suppliers
Secure, diversified sourcing from global pulp suppliers underpins Hansol Paper’s product quality and stabilizes costs, as the global market pulp supply reached about 200 million tonnes in 2024. Long-term contracts with FSC/PEFC-aligned suppliers ensure sustainable fiber sourcing and chain-of-custody, supporting certified product lines. Strategic hedging and supplier development programs reduce price volatility—pulp can represent roughly 30–40% of paper input costs. Joint audits and supplier audits maintain traceability and compliance.
Chemical & coating vendors
Additives, starches, fillers and coatings are essential for printability and barrier performance across Hansol Paper’s ~400 ktpa pulp and paper output; the global paper chemicals market was about 10 billion in 2024. Co-innovation with vendors has cut specialty grade development time by roughly 25% in pilot programs. Vendor-managed inventory reduces stockouts and downtime by up to 30%, while supplier quality agreements keep inter-mill defect rates near 1%.

Energy & utilities providers
Stable steam, electricity and gas supplies ensure continuous operation of paper machines and dryers. Partnerships for cogeneration and renewables cut energy costs and emissions, with CHP efficiencies commonly 60–80% and industrial savings up to ~20%. Demand-response programs add resilience, typically reducing peak load 5–15%. Green PPAs accelerate decarbonization by securing long-term renewable supply.

Logistics & distribution partners
On-time delivery of reels and sheets is critical for converters and printers; Hansol leverages 3PLs, rail and port partners to secure domestic and export flows, reducing stockouts and keeping production lines running in 2024.
- 3PLs-enabled reliability
- Rail & port for exports
- Optimized warehousing cuts lead times
- Track-and-trace boosts visibility (2024)
Recycling & certification bodies
Alliances with recyclers secure consistent quality recovered fiber for Hansol Paper, while certifications like FSC, PEFC and ISO (held by Hansol as of 2024) broaden market access and premium channel entry. Partnerships with food-safety certifiers enable food-grade packaging lines, and industry associations drive standards, procurement advocacy and regulatory alignment.
- Recovered fiber supply secured
- FSC / PEFC / ISO certification (2024)
- Food-safety certifiers for packaging grades
- Industry association advocacy
Secure pulp sourcing, CHP energy and chem co-innovation stabilize costs and speed R&D
Secure global pulp sourcing (market ~200 million t in 2024) and long-term FSC/PEFC contracts stabilize costs; pulp ≈30–40% of input. Co-innovation with chemical vendors cut specialty development time ~25%; paper chemicals market ≈$10B (2024). Energy partners (CHP 60–80% eff.) and 3PL/rail/ports reduce outages and lead times.
| Partner | KPI | 2024 |
|---|---|---|
| Pulp suppliers | Supply stability | 200Mt market |
| Chem vendors | R&D time | -25% |
| Energy | CHP eff. | 60–80% |
| Logistics | Lead time | -30% |
What is included in the product
 Detailed Word Document
A comprehensive Business Model Canvas tailored to Hansol Paper’s strategy, covering all nine BMC blocks with detailed value propositions, customer segments, channels and cost/revenue structures; includes competitive advantage analysis, linked SWOT insights and polished narrative ideal for investor presentations and strategic decision-making.

 Customizable Excel Spreadsheet
Condenses Hansol Paper's strategy into a digestible one-page snapshot for quick review and team alignment.
Activities

Pulping & papermaking operations
Continuous pulping and papermaking on multiple paper machines sustains volume and consistency, supporting OEE levels above 85% through shift-to-shift production; automated controls stabilize basis weight within ±2% and moisture to target ranges to ensure formation quality. Preventive maintenance programs reduce unplanned downtime and preserve asset utilization. Safety protocols and environmental controls meet Korean regulatory standards and ISO 14001-aligned practices.
Product development & innovation
R&D targets eco-friendly, high-performance grades, with a 2024 barrier coatings segment growing 7% year-on-year, expanding demand for food and e-commerce packaging. Rapid trial protocols cut time-to-market to weeks, enabling faster scale-up. Barrier formulations and customer co-development ensure specifications match end-use performance and regulatory requirements.

Quality assurance & compliance
Lab testing verifies printability, ISO brightness (typically 80–90% for packaging grades), stiffness (Gurley or Taber metrics) and migration limits (EU specific migration limits often 10 mg/kg) to protect brand safety. Compliance with food-contact and sustainability standards (e.g., EU, FDA, FSC) safeguards customers and market access. Statistical process control cuts defect rates—often reducing rejects by >30%—and full traceability allows recalls within 48–72 hours.

Supply chain & inventory management
Supply chain and inventory management at Hansol Paper balances pulp, chemicals, and finished goods to lower working capital; in 2024 the company prioritized SKU rationalization and flow optimization to tighten inventory turns and cash conversion cycles.
Sales & operations planning aligns mill output with demand, while coordinated vendors and carriers reduce stockouts and expedite replenishment; digital forecasting tools improved forecast accuracy and responsiveness across sites.
- Inventory balance: pulp, chemicals, finished goods
- S&OP: mill-to-demand alignment
- Vendor/carrier coordination: minimized stockouts
- Digital tools: higher forecast accuracy
Sales, key accounts & technical service
Direct engagement secures long-term contracts and anchors Hansol Paper as a preferred supplier; in 2024 the company remained a leading domestic paper producer. On-site technical service optimizes customer machines, reducing downtime and improving run rates. Training and trials lift conversion yields while data-driven proposals—using production and quality metrics—deepen account relationships.
OEE >85% and +7% barrier growth cut rejects >30%, ISO brightness 80–90% efficiency
Continuous pulping and papermaking sustain OEE >85% with basis-weight control ±2%; preventive maintenance and ISO 14001 practices limit downtime. R&D grew barrier coatings 7% in 2024, accelerating trials and co-development for food/e‑commerce packaging. Lab QC ensures ISO brightness 80–90%, reduces rejects >30% and enables recalls in 48–72 hours; S&OP and digital forecasting tightened inventory turns.
| Metric | 2024 |
|---|---|
| OEE | >85% |
| Barrier growth | +7% |
| Brightness | 80–90% |
| Reject reduction | >30% |
What You See Is What You Get
Business Model Canvas
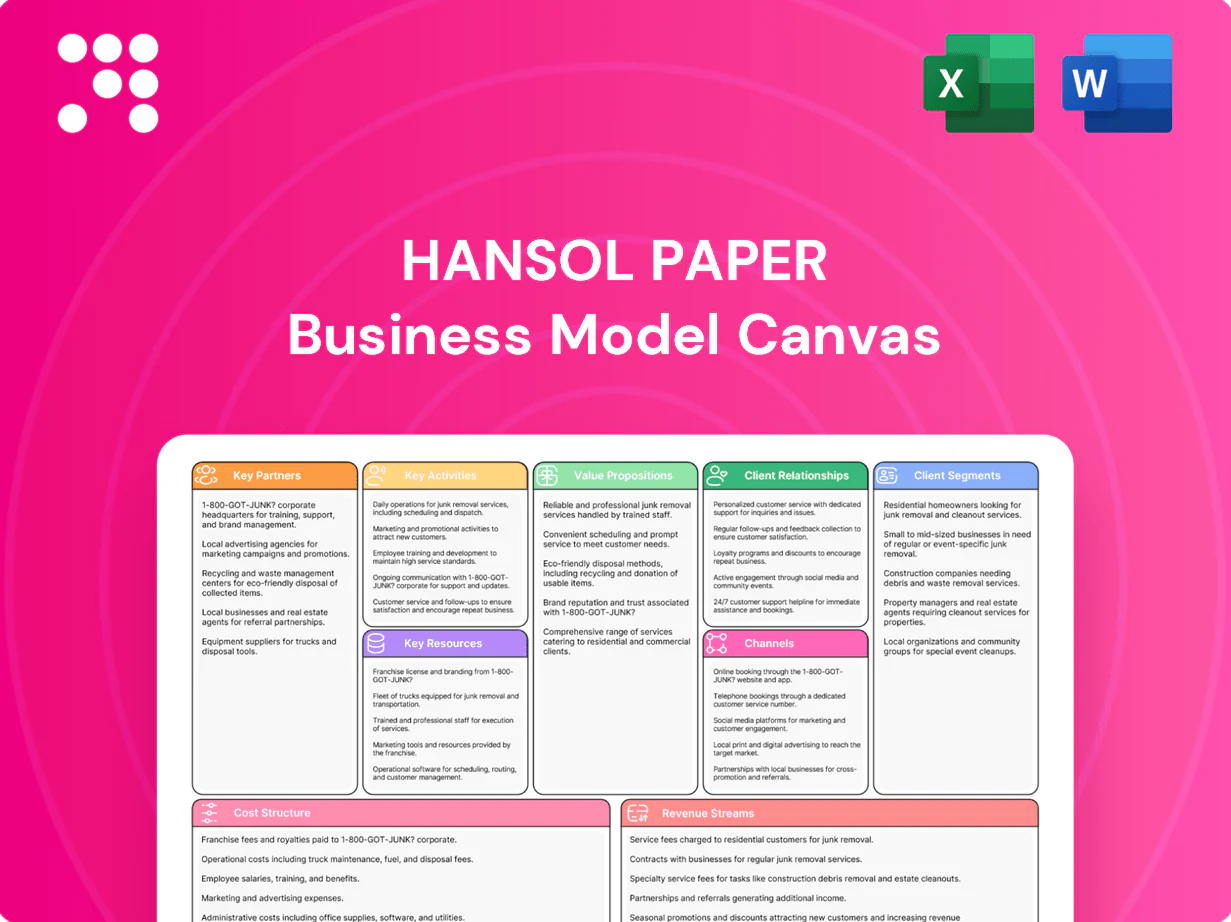
The document you're previewing is the exact Hansol Paper Business Model Canvas you will receive—it's not a mockup. When you purchase, you'll download this same complete, editable file formatted for immediate use. No hidden sections, no filler—what you see is what you'll own.

Business Model Canvas: Strategic blueprint for value, scale and margin in paper manufacturing
Unlock the full strategic blueprint behind Hansol Paper’s business model in our detailed Business Model Canvas—three to five succinct sections reveal how the firm creates value, scales operations, and secures margins. Ideal for investors, consultants, and entrepreneurs seeking actionable insights. Purchase the complete Word & Excel files to benchmark, adapt, and implement proven strategies.
Partnerships
Global pulp suppliers
Secure, diversified sourcing from global pulp suppliers underpins Hansol Paper’s product quality and stabilizes costs, as the global market pulp supply reached about 200 million tonnes in 2024. Long-term contracts with FSC/PEFC-aligned suppliers ensure sustainable fiber sourcing and chain-of-custody, supporting certified product lines. Strategic hedging and supplier development programs reduce price volatility—pulp can represent roughly 30–40% of paper input costs. Joint audits and supplier audits maintain traceability and compliance.
Chemical & coating vendors
Additives, starches, fillers and coatings are essential for printability and barrier performance across Hansol Paper’s ~400 ktpa pulp and paper output; the global paper chemicals market was about 10 billion in 2024. Co-innovation with vendors has cut specialty grade development time by roughly 25% in pilot programs. Vendor-managed inventory reduces stockouts and downtime by up to 30%, while supplier quality agreements keep inter-mill defect rates near 1%.
Energy & utilities providers
Stable steam, electricity and gas supplies ensure continuous operation of paper machines and dryers. Partnerships for cogeneration and renewables cut energy costs and emissions, with CHP efficiencies commonly 60–80% and industrial savings up to ~20%. Demand-response programs add resilience, typically reducing peak load 5–15%. Green PPAs accelerate decarbonization by securing long-term renewable supply.
Logistics & distribution partners
On-time delivery of reels and sheets is critical for converters and printers; Hansol leverages 3PLs, rail and port partners to secure domestic and export flows, reducing stockouts and keeping production lines running in 2024.
- 3PLs-enabled reliability
- Rail & port for exports
- Optimized warehousing cuts lead times
- Track-and-trace boosts visibility (2024)
Recycling & certification bodies
Alliances with recyclers secure consistent quality recovered fiber for Hansol Paper, while certifications like FSC, PEFC and ISO (held by Hansol as of 2024) broaden market access and premium channel entry. Partnerships with food-safety certifiers enable food-grade packaging lines, and industry associations drive standards, procurement advocacy and regulatory alignment.
- Recovered fiber supply secured
- FSC / PEFC / ISO certification (2024)
- Food-safety certifiers for packaging grades
- Industry association advocacy
Secure pulp sourcing, CHP energy and chem co-innovation stabilize costs and speed R&D
Secure global pulp sourcing (market ~200 million t in 2024) and long-term FSC/PEFC contracts stabilize costs; pulp ≈30–40% of input. Co-innovation with chemical vendors cut specialty development time ~25%; paper chemicals market ≈$10B (2024). Energy partners (CHP 60–80% eff.) and 3PL/rail/ports reduce outages and lead times.
| Partner | KPI | 2024 |
|---|---|---|
| Pulp suppliers | Supply stability | 200Mt market |
| Chem vendors | R&D time | -25% |
| Energy | CHP eff. | 60–80% |
| Logistics | Lead time | -30% |
What is included in the product
Detailed Word Document
A comprehensive Business Model Canvas tailored to Hansol Paper’s strategy, covering all nine BMC blocks with detailed value propositions, customer segments, channels and cost/revenue structures; includes competitive advantage analysis, linked SWOT insights and polished narrative ideal for investor presentations and strategic decision-making.
Customizable Excel Spreadsheet
Condenses Hansol Paper's strategy into a digestible one-page snapshot for quick review and team alignment.
Activities
Pulping & papermaking operations
Continuous pulping and papermaking on multiple paper machines sustains volume and consistency, supporting OEE levels above 85% through shift-to-shift production; automated controls stabilize basis weight within ±2% and moisture to target ranges to ensure formation quality. Preventive maintenance programs reduce unplanned downtime and preserve asset utilization. Safety protocols and environmental controls meet Korean regulatory standards and ISO 14001-aligned practices.
Product development & innovation
R&D targets eco-friendly, high-performance grades, with a 2024 barrier coatings segment growing 7% year-on-year, expanding demand for food and e-commerce packaging. Rapid trial protocols cut time-to-market to weeks, enabling faster scale-up. Barrier formulations and customer co-development ensure specifications match end-use performance and regulatory requirements.
Quality assurance & compliance
Lab testing verifies printability, ISO brightness (typically 80–90% for packaging grades), stiffness (Gurley or Taber metrics) and migration limits (EU specific migration limits often 10 mg/kg) to protect brand safety. Compliance with food-contact and sustainability standards (e.g., EU, FDA, FSC) safeguards customers and market access. Statistical process control cuts defect rates—often reducing rejects by >30%—and full traceability allows recalls within 48–72 hours.
Supply chain & inventory management
Supply chain and inventory management at Hansol Paper balances pulp, chemicals, and finished goods to lower working capital; in 2024 the company prioritized SKU rationalization and flow optimization to tighten inventory turns and cash conversion cycles.
Sales & operations planning aligns mill output with demand, while coordinated vendors and carriers reduce stockouts and expedite replenishment; digital forecasting tools improved forecast accuracy and responsiveness across sites.
- Inventory balance: pulp, chemicals, finished goods
- S&OP: mill-to-demand alignment
- Vendor/carrier coordination: minimized stockouts
- Digital tools: higher forecast accuracy
Sales, key accounts & technical service
Direct engagement secures long-term contracts and anchors Hansol Paper as a preferred supplier; in 2024 the company remained a leading domestic paper producer. On-site technical service optimizes customer machines, reducing downtime and improving run rates. Training and trials lift conversion yields while data-driven proposals—using production and quality metrics—deepen account relationships.
OEE >85% and +7% barrier growth cut rejects >30%, ISO brightness 80–90% efficiency
Continuous pulping and papermaking sustain OEE >85% with basis-weight control ±2%; preventive maintenance and ISO 14001 practices limit downtime. R&D grew barrier coatings 7% in 2024, accelerating trials and co-development for food/e‑commerce packaging. Lab QC ensures ISO brightness 80–90%, reduces rejects >30% and enables recalls in 48–72 hours; S&OP and digital forecasting tightened inventory turns.
| Metric | 2024 |
|---|---|
| OEE | >85% |
| Barrier growth | +7% |
| Brightness | 80–90% |
| Reject reduction | >30% |
What You See Is What You Get
Business Model Canvas
The document you're previewing is the exact Hansol Paper Business Model Canvas you will receive—it's not a mockup. When you purchase, you'll download this same complete, editable file formatted for immediate use. No hidden sections, no filler—what you see is what you'll own.
Original: $10.00
-65%$10.00
$3.50Description
Business Model Canvas: Strategic blueprint for value, scale and margin in paper manufacturing
Unlock the full strategic blueprint behind Hansol Paper’s business model in our detailed Business Model Canvas—three to five succinct sections reveal how the firm creates value, scales operations, and secures margins. Ideal for investors, consultants, and entrepreneurs seeking actionable insights. Purchase the complete Word & Excel files to benchmark, adapt, and implement proven strategies.
Partnerships
Global pulp suppliers
Secure, diversified sourcing from global pulp suppliers underpins Hansol Paper’s product quality and stabilizes costs, as the global market pulp supply reached about 200 million tonnes in 2024. Long-term contracts with FSC/PEFC-aligned suppliers ensure sustainable fiber sourcing and chain-of-custody, supporting certified product lines. Strategic hedging and supplier development programs reduce price volatility—pulp can represent roughly 30–40% of paper input costs. Joint audits and supplier audits maintain traceability and compliance.
Chemical & coating vendors
Additives, starches, fillers and coatings are essential for printability and barrier performance across Hansol Paper’s ~400 ktpa pulp and paper output; the global paper chemicals market was about 10 billion in 2024. Co-innovation with vendors has cut specialty grade development time by roughly 25% in pilot programs. Vendor-managed inventory reduces stockouts and downtime by up to 30%, while supplier quality agreements keep inter-mill defect rates near 1%.
Energy & utilities providers
Stable steam, electricity and gas supplies ensure continuous operation of paper machines and dryers. Partnerships for cogeneration and renewables cut energy costs and emissions, with CHP efficiencies commonly 60–80% and industrial savings up to ~20%. Demand-response programs add resilience, typically reducing peak load 5–15%. Green PPAs accelerate decarbonization by securing long-term renewable supply.
Logistics & distribution partners
On-time delivery of reels and sheets is critical for converters and printers; Hansol leverages 3PLs, rail and port partners to secure domestic and export flows, reducing stockouts and keeping production lines running in 2024.
- 3PLs-enabled reliability
- Rail & port for exports
- Optimized warehousing cuts lead times
- Track-and-trace boosts visibility (2024)
Recycling & certification bodies
Alliances with recyclers secure consistent quality recovered fiber for Hansol Paper, while certifications like FSC, PEFC and ISO (held by Hansol as of 2024) broaden market access and premium channel entry. Partnerships with food-safety certifiers enable food-grade packaging lines, and industry associations drive standards, procurement advocacy and regulatory alignment.
- Recovered fiber supply secured
- FSC / PEFC / ISO certification (2024)
- Food-safety certifiers for packaging grades
- Industry association advocacy
Secure pulp sourcing, CHP energy and chem co-innovation stabilize costs and speed R&D
Secure global pulp sourcing (market ~200 million t in 2024) and long-term FSC/PEFC contracts stabilize costs; pulp ≈30–40% of input. Co-innovation with chemical vendors cut specialty development time ~25%; paper chemicals market ≈$10B (2024). Energy partners (CHP 60–80% eff.) and 3PL/rail/ports reduce outages and lead times.
| Partner | KPI | 2024 |
|---|---|---|
| Pulp suppliers | Supply stability | 200Mt market |
| Chem vendors | R&D time | -25% |
| Energy | CHP eff. | 60–80% |
| Logistics | Lead time | -30% |
What is included in the product
Detailed Word Document
A comprehensive Business Model Canvas tailored to Hansol Paper’s strategy, covering all nine BMC blocks with detailed value propositions, customer segments, channels and cost/revenue structures; includes competitive advantage analysis, linked SWOT insights and polished narrative ideal for investor presentations and strategic decision-making.
Customizable Excel Spreadsheet
Condenses Hansol Paper's strategy into a digestible one-page snapshot for quick review and team alignment.
Activities
Pulping & papermaking operations
Continuous pulping and papermaking on multiple paper machines sustains volume and consistency, supporting OEE levels above 85% through shift-to-shift production; automated controls stabilize basis weight within ±2% and moisture to target ranges to ensure formation quality. Preventive maintenance programs reduce unplanned downtime and preserve asset utilization. Safety protocols and environmental controls meet Korean regulatory standards and ISO 14001-aligned practices.
Product development & innovation
R&D targets eco-friendly, high-performance grades, with a 2024 barrier coatings segment growing 7% year-on-year, expanding demand for food and e-commerce packaging. Rapid trial protocols cut time-to-market to weeks, enabling faster scale-up. Barrier formulations and customer co-development ensure specifications match end-use performance and regulatory requirements.
Quality assurance & compliance
Lab testing verifies printability, ISO brightness (typically 80–90% for packaging grades), stiffness (Gurley or Taber metrics) and migration limits (EU specific migration limits often 10 mg/kg) to protect brand safety. Compliance with food-contact and sustainability standards (e.g., EU, FDA, FSC) safeguards customers and market access. Statistical process control cuts defect rates—often reducing rejects by >30%—and full traceability allows recalls within 48–72 hours.
Supply chain & inventory management
Supply chain and inventory management at Hansol Paper balances pulp, chemicals, and finished goods to lower working capital; in 2024 the company prioritized SKU rationalization and flow optimization to tighten inventory turns and cash conversion cycles.
Sales & operations planning aligns mill output with demand, while coordinated vendors and carriers reduce stockouts and expedite replenishment; digital forecasting tools improved forecast accuracy and responsiveness across sites.
- Inventory balance: pulp, chemicals, finished goods
- S&OP: mill-to-demand alignment
- Vendor/carrier coordination: minimized stockouts
- Digital tools: higher forecast accuracy
Sales, key accounts & technical service
Direct engagement secures long-term contracts and anchors Hansol Paper as a preferred supplier; in 2024 the company remained a leading domestic paper producer. On-site technical service optimizes customer machines, reducing downtime and improving run rates. Training and trials lift conversion yields while data-driven proposals—using production and quality metrics—deepen account relationships.
OEE >85% and +7% barrier growth cut rejects >30%, ISO brightness 80–90% efficiency
Continuous pulping and papermaking sustain OEE >85% with basis-weight control ±2%; preventive maintenance and ISO 14001 practices limit downtime. R&D grew barrier coatings 7% in 2024, accelerating trials and co-development for food/e‑commerce packaging. Lab QC ensures ISO brightness 80–90%, reduces rejects >30% and enables recalls in 48–72 hours; S&OP and digital forecasting tightened inventory turns.
| Metric | 2024 |
|---|---|
| OEE | >85% |
| Barrier growth | +7% |
| Brightness | 80–90% |
| Reject reduction | >30% |
What You See Is What You Get
Business Model Canvas
The document you're previewing is the exact Hansol Paper Business Model Canvas you will receive—it's not a mockup. When you purchase, you'll download this same complete, editable file formatted for immediate use. No hidden sections, no filler—what you see is what you'll own.











