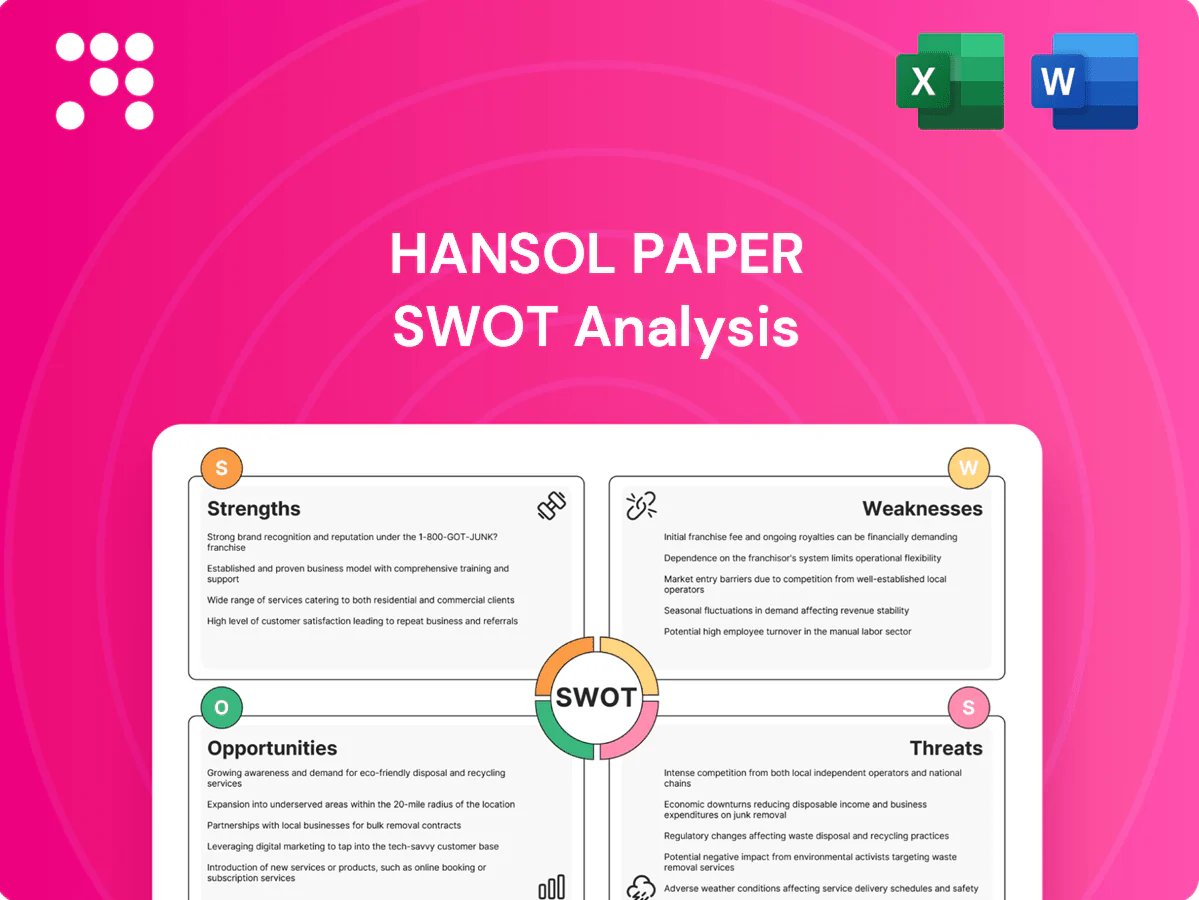
Hansol Paper SWOT Analysis

Elevate Your Analysis with the Complete SWOT Report
Hansol Paper’s SWOT highlights solid vertical integration, strong domestic market share, and growth opportunities in eco-friendly packaging, balanced by commodity price exposure and regional competition; strategic moves and financial implications are only hinted here. Want the full picture with actionable takeaways? Purchase the complete SWOT for a research-backed, editable Word report plus an Excel matrix to plan, pitch, and invest with confidence.
Strengths

Diverse product portfolio
Hansol Paper spans printing & writing, specialty, industrial and packaging paper, reducing reliance on any single segment; this mix smooths earnings across cycles and supported the company through 2023–24 market swings. Diversification enables cross-selling from publishers to FMCG customers and helps optimize capacity utilization, bolstering margin resilience during demand shifts.
Strong domestic market position
As South Korea's leading paper manufacturer, Hansol Paper leverages long-standing customer ties and extensive distribution to secure cost efficiencies and reliable service; consolidated sales reached KRW 2.18 trillion in 2024, supporting scale advantages. Close proximity to major Korean brand owners enables rapid product iteration and shorter lead times, boosting innovation cycles. A strong domestic base has underpinned export growth, with overseas sales contributing roughly 30% of revenue in 2024.

Manufacturing scale and process know-how
Extensive papermaking expertise at Hansol Paper delivers consistent quality and yield across its mill network. Scale provides stronger procurement leverage for fiber, chemicals and energy, lowering input volatility. Ongoing process optimization reduces unit costs and enables competitive pricing. Advanced technical capabilities allow tailored paperboard and specialty grades for packaging and industrial applications.

Sustainability and eco-friendly focus
Hansol Paper’s strong sustainability focus aligns directly with customer ESG mandates, helping secure packaging and consumer-goods contracts that prioritize low-impact materials. Its recycled-content products and certified fiber sourcing enhance brand trust and differentiation. This positioning supports premium pricing, lowers regulatory risk, and strengthens long-term customer relationships.
- ESG alignment
- Recycled & certified fiber
- Win packaging accounts
- Supports premium pricing
Broad industry coverage
Hansol Paper serves publishing, printing, food packaging and consumer goods, spreading demand drivers and reducing reliance on any single end market; packaging demand now offsets structural pressure in printing papers and helped stabilize margins through recent cycles.
Multi-industry presence enhances market intelligence and product innovation, improves cross-sector R&D application and reduces revenue volatility across economic swings.
- diversified end markets
- packaging offsets print decline
- better market intelligence
- lower revenue volatility
Diversified paper portfolio stabilizes revenue, fuels KRW 2.18T sales and ~30% exports
Hansol Paper’s diversified product mix across printing, specialty, industrial and packaging stabilizes revenue and smoothed earnings through 2023–24 cycles.
Scale and domestic leadership supported KRW 2.18 trillion consolidated sales in 2024 and ~30% export contribution, enabling procurement and distribution advantages.
Sustainability and technical capabilities drive higher-value recycled and certified-fiber contracts, supporting premium pricing and margin resilience.
| Metric | 2024 |
|---|---|
| Consolidated sales | KRW 2.18 trillion |
| Export share | ~30% |
What is included in the product
 Detailed Word Document
Provides a concise strategic overview of Hansol Paper’s internal strengths and weaknesses and external opportunities and threats, highlighting competitive position, growth drivers in packaging and specialty paper, operational gaps, and market risks like raw material volatility and shifting global demand.

 Customizable Excel Spreadsheet
Provides a concise Hansol Paper SWOT matrix for fast, visual strategy alignment and clear identification of competitive gaps.
Weaknesses

Exposure to cyclical end-markets
Paper demand closely tracks GDP, advertising spend and consumer activity, so Hansol Paper faces pronounced revenue swings during economic cycles. Industrial slowdowns compress volumes and pricing, while customers can destock rapidly in downturns, amplifying order volatility. Falling plant utilization quickly erodes margins and fixed-cost absorption, making profitability highly sensitive to short-term demand shocks.
Raw material and energy sensitivity
Pulp, recovered fiber, chemicals and energy together drive Hansol Paper’s cost base—pulp and recovered fiber can account for over 50% of raw-material spend while energy typically represents around 10–15% of operating costs; spikes or supply tightness compress spreads and erode margins. Energy price volatility increases operating costs and planning complexity, and hedging programs have limited ability to fully offset sudden swings.

Legacy assets and capital intensity
Hansol Paper's legacy assets require continuous capex to maintain efficiency and meet tightening environmental and safety regulations, driving sustained investment cycles. Older paper lines are less flexible and typically costlier to run, slowing conversion to higher-growth packaging and specialty grades which demand time and capital. High fixed costs mean margins compress sharply when utilization dips, increasing earnings volatility.

Limited global brand versus multinationals
Hansol Paper lags multinationals whose multi-billion-dollar distribution networks and greater pricing power limit Hansol’s ability to win global contracts; strong brand recognition and technical-service networks from peers sway large buyers toward established suppliers. Entering new regions often requires local partnerships or price concessions, while constrained marketing scale has slowed export momentum.
- Distribution gap vs global players
- Brand/service network influence on major buyers
- Need for partnerships or discounts to enter markets
- Limited marketing scale curbs export growth
Structural decline in printing/writing
Cyclical paper firm: pulp >50%, energy 10-15%, legacy capex
Hansol Paper is exposed to cyclical demand swings tied to GDP and advertising, causing volatile volumes and margins; pulp/recovered fiber and energy dominate costs (>50% and ~10–15% respectively). Legacy assets require continuous capex, slowing shift to packaging/specialty and raising execution risk. Limited global distribution and brand reach hinder export growth versus multinationals.
| Metric | Value / Note |
|---|---|
| Graphic paper decline | -45% since 2000 (Smithers) |
| Raw-material spend | Pulp/recovered fiber >50% |
| Energy cost | ~10–15% of operating costs |
| Competitive gap | Distribution/brand vs multinationals |
Preview the Actual Deliverable
Hansol Paper SWOT Analysis
This is the actual Hansol Paper SWOT analysis document you’ll receive upon purchase—no surprises, just professional quality. The preview below is taken directly from the full SWOT report you'll get, covering strengths, weaknesses, opportunities and threats. Once purchased, you’ll receive the complete, editable version ready for use.

Elevate Your Analysis with the Complete SWOT Report
Hansol Paper’s SWOT highlights solid vertical integration, strong domestic market share, and growth opportunities in eco-friendly packaging, balanced by commodity price exposure and regional competition; strategic moves and financial implications are only hinted here. Want the full picture with actionable takeaways? Purchase the complete SWOT for a research-backed, editable Word report plus an Excel matrix to plan, pitch, and invest with confidence.
Strengths
Diverse product portfolio
Hansol Paper spans printing & writing, specialty, industrial and packaging paper, reducing reliance on any single segment; this mix smooths earnings across cycles and supported the company through 2023–24 market swings. Diversification enables cross-selling from publishers to FMCG customers and helps optimize capacity utilization, bolstering margin resilience during demand shifts.
Strong domestic market position
As South Korea's leading paper manufacturer, Hansol Paper leverages long-standing customer ties and extensive distribution to secure cost efficiencies and reliable service; consolidated sales reached KRW 2.18 trillion in 2024, supporting scale advantages. Close proximity to major Korean brand owners enables rapid product iteration and shorter lead times, boosting innovation cycles. A strong domestic base has underpinned export growth, with overseas sales contributing roughly 30% of revenue in 2024.
Manufacturing scale and process know-how
Extensive papermaking expertise at Hansol Paper delivers consistent quality and yield across its mill network. Scale provides stronger procurement leverage for fiber, chemicals and energy, lowering input volatility. Ongoing process optimization reduces unit costs and enables competitive pricing. Advanced technical capabilities allow tailored paperboard and specialty grades for packaging and industrial applications.
Sustainability and eco-friendly focus
Hansol Paper’s strong sustainability focus aligns directly with customer ESG mandates, helping secure packaging and consumer-goods contracts that prioritize low-impact materials. Its recycled-content products and certified fiber sourcing enhance brand trust and differentiation. This positioning supports premium pricing, lowers regulatory risk, and strengthens long-term customer relationships.
- ESG alignment
- Recycled & certified fiber
- Win packaging accounts
- Supports premium pricing
Broad industry coverage
Hansol Paper serves publishing, printing, food packaging and consumer goods, spreading demand drivers and reducing reliance on any single end market; packaging demand now offsets structural pressure in printing papers and helped stabilize margins through recent cycles.
Multi-industry presence enhances market intelligence and product innovation, improves cross-sector R&D application and reduces revenue volatility across economic swings.
- diversified end markets
- packaging offsets print decline
- better market intelligence
- lower revenue volatility
Diversified paper portfolio stabilizes revenue, fuels KRW 2.18T sales and ~30% exports
Hansol Paper’s diversified product mix across printing, specialty, industrial and packaging stabilizes revenue and smoothed earnings through 2023–24 cycles.
Scale and domestic leadership supported KRW 2.18 trillion consolidated sales in 2024 and ~30% export contribution, enabling procurement and distribution advantages.
Sustainability and technical capabilities drive higher-value recycled and certified-fiber contracts, supporting premium pricing and margin resilience.
| Metric | 2024 |
|---|---|
| Consolidated sales | KRW 2.18 trillion |
| Export share | ~30% |
What is included in the product
Detailed Word Document
Provides a concise strategic overview of Hansol Paper’s internal strengths and weaknesses and external opportunities and threats, highlighting competitive position, growth drivers in packaging and specialty paper, operational gaps, and market risks like raw material volatility and shifting global demand.
Customizable Excel Spreadsheet
Provides a concise Hansol Paper SWOT matrix for fast, visual strategy alignment and clear identification of competitive gaps.
Weaknesses
Exposure to cyclical end-markets
Paper demand closely tracks GDP, advertising spend and consumer activity, so Hansol Paper faces pronounced revenue swings during economic cycles. Industrial slowdowns compress volumes and pricing, while customers can destock rapidly in downturns, amplifying order volatility. Falling plant utilization quickly erodes margins and fixed-cost absorption, making profitability highly sensitive to short-term demand shocks.
Raw material and energy sensitivity
Pulp, recovered fiber, chemicals and energy together drive Hansol Paper’s cost base—pulp and recovered fiber can account for over 50% of raw-material spend while energy typically represents around 10–15% of operating costs; spikes or supply tightness compress spreads and erode margins. Energy price volatility increases operating costs and planning complexity, and hedging programs have limited ability to fully offset sudden swings.
Legacy assets and capital intensity
Hansol Paper's legacy assets require continuous capex to maintain efficiency and meet tightening environmental and safety regulations, driving sustained investment cycles. Older paper lines are less flexible and typically costlier to run, slowing conversion to higher-growth packaging and specialty grades which demand time and capital. High fixed costs mean margins compress sharply when utilization dips, increasing earnings volatility.
Limited global brand versus multinationals
Hansol Paper lags multinationals whose multi-billion-dollar distribution networks and greater pricing power limit Hansol’s ability to win global contracts; strong brand recognition and technical-service networks from peers sway large buyers toward established suppliers. Entering new regions often requires local partnerships or price concessions, while constrained marketing scale has slowed export momentum.
- Distribution gap vs global players
- Brand/service network influence on major buyers
- Need for partnerships or discounts to enter markets
- Limited marketing scale curbs export growth
Structural decline in printing/writing
Cyclical paper firm: pulp >50%, energy 10-15%, legacy capex
Hansol Paper is exposed to cyclical demand swings tied to GDP and advertising, causing volatile volumes and margins; pulp/recovered fiber and energy dominate costs (>50% and ~10–15% respectively). Legacy assets require continuous capex, slowing shift to packaging/specialty and raising execution risk. Limited global distribution and brand reach hinder export growth versus multinationals.
| Metric | Value / Note |
|---|---|
| Graphic paper decline | -45% since 2000 (Smithers) |
| Raw-material spend | Pulp/recovered fiber >50% |
| Energy cost | ~10–15% of operating costs |
| Competitive gap | Distribution/brand vs multinationals |
Preview the Actual Deliverable
Hansol Paper SWOT Analysis
This is the actual Hansol Paper SWOT analysis document you’ll receive upon purchase—no surprises, just professional quality. The preview below is taken directly from the full SWOT report you'll get, covering strengths, weaknesses, opportunities and threats. Once purchased, you’ll receive the complete, editable version ready for use.
Original: $10.00
-65%$10.00
$3.50Description
Elevate Your Analysis with the Complete SWOT Report
Hansol Paper’s SWOT highlights solid vertical integration, strong domestic market share, and growth opportunities in eco-friendly packaging, balanced by commodity price exposure and regional competition; strategic moves and financial implications are only hinted here. Want the full picture with actionable takeaways? Purchase the complete SWOT for a research-backed, editable Word report plus an Excel matrix to plan, pitch, and invest with confidence.
Strengths
Diverse product portfolio
Hansol Paper spans printing & writing, specialty, industrial and packaging paper, reducing reliance on any single segment; this mix smooths earnings across cycles and supported the company through 2023–24 market swings. Diversification enables cross-selling from publishers to FMCG customers and helps optimize capacity utilization, bolstering margin resilience during demand shifts.
Strong domestic market position
As South Korea's leading paper manufacturer, Hansol Paper leverages long-standing customer ties and extensive distribution to secure cost efficiencies and reliable service; consolidated sales reached KRW 2.18 trillion in 2024, supporting scale advantages. Close proximity to major Korean brand owners enables rapid product iteration and shorter lead times, boosting innovation cycles. A strong domestic base has underpinned export growth, with overseas sales contributing roughly 30% of revenue in 2024.
Manufacturing scale and process know-how
Extensive papermaking expertise at Hansol Paper delivers consistent quality and yield across its mill network. Scale provides stronger procurement leverage for fiber, chemicals and energy, lowering input volatility. Ongoing process optimization reduces unit costs and enables competitive pricing. Advanced technical capabilities allow tailored paperboard and specialty grades for packaging and industrial applications.
Sustainability and eco-friendly focus
Hansol Paper’s strong sustainability focus aligns directly with customer ESG mandates, helping secure packaging and consumer-goods contracts that prioritize low-impact materials. Its recycled-content products and certified fiber sourcing enhance brand trust and differentiation. This positioning supports premium pricing, lowers regulatory risk, and strengthens long-term customer relationships.
- ESG alignment
- Recycled & certified fiber
- Win packaging accounts
- Supports premium pricing
Broad industry coverage
Hansol Paper serves publishing, printing, food packaging and consumer goods, spreading demand drivers and reducing reliance on any single end market; packaging demand now offsets structural pressure in printing papers and helped stabilize margins through recent cycles.
Multi-industry presence enhances market intelligence and product innovation, improves cross-sector R&D application and reduces revenue volatility across economic swings.
- diversified end markets
- packaging offsets print decline
- better market intelligence
- lower revenue volatility
Diversified paper portfolio stabilizes revenue, fuels KRW 2.18T sales and ~30% exports
Hansol Paper’s diversified product mix across printing, specialty, industrial and packaging stabilizes revenue and smoothed earnings through 2023–24 cycles.
Scale and domestic leadership supported KRW 2.18 trillion consolidated sales in 2024 and ~30% export contribution, enabling procurement and distribution advantages.
Sustainability and technical capabilities drive higher-value recycled and certified-fiber contracts, supporting premium pricing and margin resilience.
| Metric | 2024 |
|---|---|
| Consolidated sales | KRW 2.18 trillion |
| Export share | ~30% |
What is included in the product
Detailed Word Document
Provides a concise strategic overview of Hansol Paper’s internal strengths and weaknesses and external opportunities and threats, highlighting competitive position, growth drivers in packaging and specialty paper, operational gaps, and market risks like raw material volatility and shifting global demand.
Customizable Excel Spreadsheet
Provides a concise Hansol Paper SWOT matrix for fast, visual strategy alignment and clear identification of competitive gaps.
Weaknesses
Exposure to cyclical end-markets
Paper demand closely tracks GDP, advertising spend and consumer activity, so Hansol Paper faces pronounced revenue swings during economic cycles. Industrial slowdowns compress volumes and pricing, while customers can destock rapidly in downturns, amplifying order volatility. Falling plant utilization quickly erodes margins and fixed-cost absorption, making profitability highly sensitive to short-term demand shocks.
Raw material and energy sensitivity
Pulp, recovered fiber, chemicals and energy together drive Hansol Paper’s cost base—pulp and recovered fiber can account for over 50% of raw-material spend while energy typically represents around 10–15% of operating costs; spikes or supply tightness compress spreads and erode margins. Energy price volatility increases operating costs and planning complexity, and hedging programs have limited ability to fully offset sudden swings.
Legacy assets and capital intensity
Hansol Paper's legacy assets require continuous capex to maintain efficiency and meet tightening environmental and safety regulations, driving sustained investment cycles. Older paper lines are less flexible and typically costlier to run, slowing conversion to higher-growth packaging and specialty grades which demand time and capital. High fixed costs mean margins compress sharply when utilization dips, increasing earnings volatility.
Limited global brand versus multinationals
Hansol Paper lags multinationals whose multi-billion-dollar distribution networks and greater pricing power limit Hansol’s ability to win global contracts; strong brand recognition and technical-service networks from peers sway large buyers toward established suppliers. Entering new regions often requires local partnerships or price concessions, while constrained marketing scale has slowed export momentum.
- Distribution gap vs global players
- Brand/service network influence on major buyers
- Need for partnerships or discounts to enter markets
- Limited marketing scale curbs export growth
Structural decline in printing/writing
Cyclical paper firm: pulp >50%, energy 10-15%, legacy capex
Hansol Paper is exposed to cyclical demand swings tied to GDP and advertising, causing volatile volumes and margins; pulp/recovered fiber and energy dominate costs (>50% and ~10–15% respectively). Legacy assets require continuous capex, slowing shift to packaging/specialty and raising execution risk. Limited global distribution and brand reach hinder export growth versus multinationals.
| Metric | Value / Note |
|---|---|
| Graphic paper decline | -45% since 2000 (Smithers) |
| Raw-material spend | Pulp/recovered fiber >50% |
| Energy cost | ~10–15% of operating costs |
| Competitive gap | Distribution/brand vs multinationals |
Preview the Actual Deliverable
Hansol Paper SWOT Analysis
This is the actual Hansol Paper SWOT analysis document you’ll receive upon purchase—no surprises, just professional quality. The preview below is taken directly from the full SWOT report you'll get, covering strengths, weaknesses, opportunities and threats. Once purchased, you’ll receive the complete, editable version ready for use.











