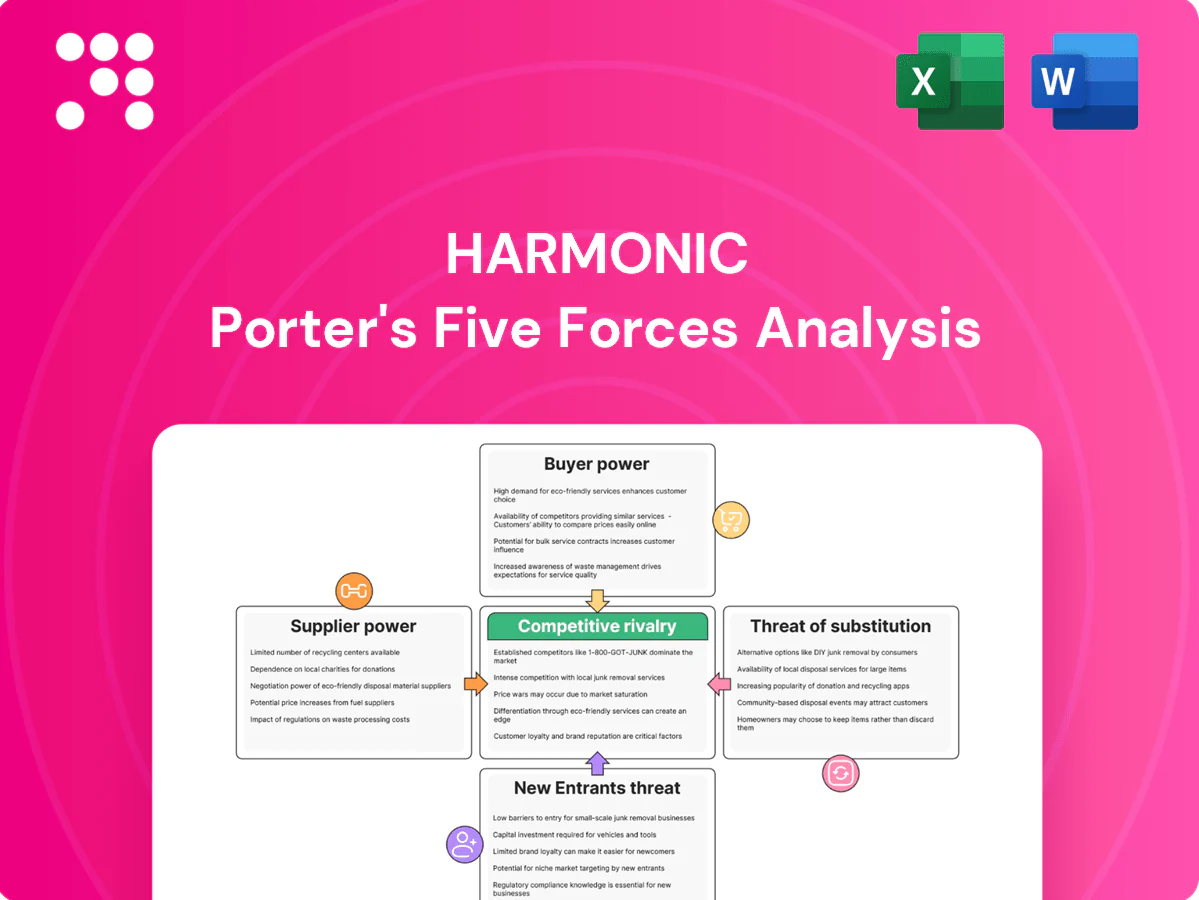
Harmonic Porter's Five Forces Analysis

From Overview to Strategy Blueprint
Harmonic’s Porter's Five Forces Analysis distills competitive pressures—buyer and supplier power, rivalry, substitutes, and entry threats—into a clear, actionable view of industry dynamics, strategic vulnerabilities, and growth levers.
This brief snapshot only scratches the surface; unlock the full report for force-by-force ratings, visuals, and a consultant-grade breakdown tailored to Harmonic to guide investment or strategic decisions.
Suppliers Bargaining Power

Dependence on hyperscale clouds
Harmonic’s cloud-native delivery depends on AWS, Azure and GCP for compute, storage and AI services; in 2024 AWS/ Microsoft/ Google held about 32%/22%/12% of global cloud market (Synergy Research), concentrating supplier power. This gives hyperscalers leverage over pricing, egress fees and reserved-capacity terms. Multi-cloud reduces single-vendor risk but switching cloud primitives is complex and costly. Periodic price moves and API/service deprecations can quickly erode margins and disrupt SLAs.
Codec and IP licensing costs
Licenses for MPEG-2/4, HEVC and emerging codecs (VVC, LCEVC) remain concentrated in patent pools and key licensors, giving suppliers royalty leverage and compliance conditions that can materially affect margins; reported HEVC/license disputes have resulted in varied fees. AV1 is royalty-free via AOMedia, but AV1 encoding/compute costs are roughly 2–3x HEVC, raising operational trade-offs. Harmonic’s bargaining power therefore rests on purchase volumes and roadmap optionality to pivot codecs and hardware acceleration.

Specialized silicon and server OEMs
Encoders/transcoders rely on GPUs, ASICs, FPGAs and high-density servers from a concentrated supplier set; Nvidia held roughly 80% of the datacenter GPU market in 2024, concentrating power. Supply constraints and node transitions have pushed lead times to 16–24 weeks, raising COGS. Design-in cycles create chipset/board lock-in; volume commitments mitigate risk but supplier bargaining rises sharply during shortages.

CDN and network interconnect partners
Delivery economics hinge on CDN contracts, peering and regional carriers; concentrated capacity among Akamai (~$3.3B 2024), Cloudflare (~$1.3B 2024) and major cloud CDNs drives pricing and prioritization power, while the global CDN market was roughly $20B in 2024. Harmonic offsets risk via multi-CDN orchestration, but integration complexity and performance variability create switching frictions, and edge program participation can tie terms to broader ecosystems.
- Concentration: top CDNs wield pricing leverage
- Costs: contracts and peering determine delivery economics
- Switching friction: multi-CDN integration/perf variability
- Lock-in: edge programs can bundle ecosystem terms
Standards bodies and open-source stacks
Standards consortia (HLS 2009, DASH 2012, SCTE profiles such as SCTE‑35) and open-source cores (FFmpeg ~38k GitHub stars in 2024, x265 ~2.6k) determine compatibility and upgrade tempo; open-source lowers licensing fees but forces compliance and security patching work that creates indirect supplier dependence. Rapid upstream changes drove unplanned engineering spend in 2024 for many streaming vendors, and influence is diffuse, raising coordination costs more than direct bargaining power.
- Standards: HLS/DASH/SCTE dictate interoperability
- Open-source: FFmpeg/x265 central to stacks
- Costs: compliance/patching = indirect dependence
- Risk: rapid upstream changes → unplanned spend
- Power: diffuse influence, higher coordination costs
Concentrated cloud, GPU and CDN suppliers tighten pricing, boosting delivery and codec costs
Supplier power is high: hyperscalers (AWS 32%/MSFT 22%/GCP 12% 2024) and Nvidia (≈80% datacenter GPU 2024) concentrate pricing and capacity, while CDN leaders (Akamai $3.3B, Cloudflare $1.3B; global CDN ≈$20B 2024) set delivery terms. Codec patent pools and licensors drive royalty risk; AV1 is royalty-free but 2–3x encoding cost vs HEVC. Multi-cloud/multi-CDN and volume commitments blunt but do not eliminate switching friction and margin exposure.
| Supplier | 2024 metric |
|---|---|
| Cloud | AWS 32% / MSFT 22% / GCP 12% (Synergy) |
| GPU | Nvidia ≈80% DC GPU share |
| CDN | Market ≈$20B; Akamai $3.3B; Cloudflare $1.3B |
| Codecs | AV1 royalty-free; AV1 encode cost 2–3x HEVC |
What is included in the product
 Detailed Word Document
Comprehensive Porter's Five Forces analysis tailored to Harmonic, uncovering competitive drivers, supplier and buyer power, substitutes and entrant threats; identifies disruptive forces and market dynamics affecting pricing, profitability and barriers to entry, delivered in fully editable Word format for investor materials, strategy decks, or academic use.

 Customizable Excel Spreadsheet
A harmonized Porter's Five Forces one-sheet that converts complex competitive pressure into an adjustable radar visualization and clean summary—customize levels, swap in your data, and drop directly into decks or dashboards without macros.
Customers Bargaining Power

Concentrated tier-1 customers
Large service providers and media conglomerates drive a disproportionate share of Harmonic’s bookings; their scale forces rigorous RFPs, bespoke contract terms, and frequent price concessions. Losing a single tier-1 account can materially affect quarterly bookings and backlog, reflecting high customer concentration risk. Reference value of Harmonic’s streaming and video-processing tech is strong, but purchasing leverage remains firmly with these buyers.
High switching costs yet multi-vendor
Deep workflow integration, strict SLAs, and specialized operational tooling create strong switching frictions for Harmonic customers, locking in multi-stage pipelines and support commitments. Still, many operators dual-source encoding, delivery, and DRM to avoid vendor lock-in, increasing competitive exposure and tempering pure pricing power. Proofs-of-concept are routinely used to extract better commercial terms. Major cloud providers held roughly 66% of the global IaaS/PaaS market in 2024 (Synergy Research Group), influencing sourcing strategies.

Outcome-based and SLA-heavy deals
Buyers now insist on outcome-based SLAs with uptime (commonly 99.99% = 52.6 minutes downtime/year), latency and QoE guarantees and penalty clauses that shift operational risk to Harmonic and compress margins if costs rise. Demonstrated reliability and historic low-failure rates justify premium pricing; SLA breaches typically trigger service credits often up to ~5–10% of monthly fees and can accelerate vendor reviews.

Price transparency and benchmarks
RFPs now benchmark TCO, density and per-channel/per-gig pricing across rivals, driving negotiations toward measurable per-unit metrics; public cloud services market surpassed $600 billion in 2024, and cloud cost curves plus open-source baselines anchor buyer expectations. Buyers demand volume discounts and elastic pricing (term, capacity or consumption), while competitive bids limit upward pricing flexibility and compress margins.
- RFPs: per-channel/per-gig TCO comparisons
- Anchors: public cloud $600B+ (2024) and open-source baselines
- Buyer asks: volume discounts, elastic pricing
- Market effect: competitive bids cap price increases
Feature velocity expectations
Customers demand rapid support for new codecs, ad-tech, FAST and low-latency protocols; 2024 industry reports show FAST channel count grew ~25% YoY, raising buyer expectations and increasing roadmap leverage over vendors.
When deliveries slip, buyers often extract concessions or expand scope at fixed price, whereas a predictable feature cadence can cut churn risk materially.
- Roadmap influence: increases buyer bargaining power
- Delays: trigger concessions or fixed-price scope creep
- Cadence: reduces churn and retention costs
- FAST growth ~25% YoY (2024)
Tier-1 clients drive RFPs, elastic pricing and SLA demands that compress margins
Large customers (tier-1 media/service providers) concentrate bookings, forcing RFPs, bespoke terms and frequent price concessions; losing one account can materially hit bookings. Deep workflow integration creates switching frictions, but dual-sourcing and PoCs preserve buyer leverage. Buyers demand outcome SLAs (99.99% = 52.6 min/yr), volume discounts and elastic pricing, compressing margins amid cloud benchmarking.
| Metric | 2024 value |
|---|---|
| Top cloud IaaS/PaaS share | ~66% (Synergy) |
| Public cloud market | >$600B |
| FAST channel growth | ~25% YoY |
| SLA target | 99.99% (52.6 min/yr) |
| Typical service credit | ~5–10% |
Preview Before You Purchase
Harmonic Porter's Five Forces Analysis
This preview is the exact Harmonic Porter’s Five Forces analysis you’ll receive upon purchase—fully formatted and ready for immediate use. It contains the complete, professionally written evaluation of competitive rivalry, supplier and buyer power, threat of entrants, and substitutes with no placeholders. No mockups or samples—what you see is the deliverable. Instant download follows payment.

From Overview to Strategy Blueprint
Harmonic’s Porter's Five Forces Analysis distills competitive pressures—buyer and supplier power, rivalry, substitutes, and entry threats—into a clear, actionable view of industry dynamics, strategic vulnerabilities, and growth levers.
This brief snapshot only scratches the surface; unlock the full report for force-by-force ratings, visuals, and a consultant-grade breakdown tailored to Harmonic to guide investment or strategic decisions.
Suppliers Bargaining Power
Dependence on hyperscale clouds
Harmonic’s cloud-native delivery depends on AWS, Azure and GCP for compute, storage and AI services; in 2024 AWS/ Microsoft/ Google held about 32%/22%/12% of global cloud market (Synergy Research), concentrating supplier power. This gives hyperscalers leverage over pricing, egress fees and reserved-capacity terms. Multi-cloud reduces single-vendor risk but switching cloud primitives is complex and costly. Periodic price moves and API/service deprecations can quickly erode margins and disrupt SLAs.
Codec and IP licensing costs
Licenses for MPEG-2/4, HEVC and emerging codecs (VVC, LCEVC) remain concentrated in patent pools and key licensors, giving suppliers royalty leverage and compliance conditions that can materially affect margins; reported HEVC/license disputes have resulted in varied fees. AV1 is royalty-free via AOMedia, but AV1 encoding/compute costs are roughly 2–3x HEVC, raising operational trade-offs. Harmonic’s bargaining power therefore rests on purchase volumes and roadmap optionality to pivot codecs and hardware acceleration.
Specialized silicon and server OEMs
Encoders/transcoders rely on GPUs, ASICs, FPGAs and high-density servers from a concentrated supplier set; Nvidia held roughly 80% of the datacenter GPU market in 2024, concentrating power. Supply constraints and node transitions have pushed lead times to 16–24 weeks, raising COGS. Design-in cycles create chipset/board lock-in; volume commitments mitigate risk but supplier bargaining rises sharply during shortages.
CDN and network interconnect partners
Delivery economics hinge on CDN contracts, peering and regional carriers; concentrated capacity among Akamai (~$3.3B 2024), Cloudflare (~$1.3B 2024) and major cloud CDNs drives pricing and prioritization power, while the global CDN market was roughly $20B in 2024. Harmonic offsets risk via multi-CDN orchestration, but integration complexity and performance variability create switching frictions, and edge program participation can tie terms to broader ecosystems.
- Concentration: top CDNs wield pricing leverage
- Costs: contracts and peering determine delivery economics
- Switching friction: multi-CDN integration/perf variability
- Lock-in: edge programs can bundle ecosystem terms
Standards bodies and open-source stacks
Standards consortia (HLS 2009, DASH 2012, SCTE profiles such as SCTE‑35) and open-source cores (FFmpeg ~38k GitHub stars in 2024, x265 ~2.6k) determine compatibility and upgrade tempo; open-source lowers licensing fees but forces compliance and security patching work that creates indirect supplier dependence. Rapid upstream changes drove unplanned engineering spend in 2024 for many streaming vendors, and influence is diffuse, raising coordination costs more than direct bargaining power.
- Standards: HLS/DASH/SCTE dictate interoperability
- Open-source: FFmpeg/x265 central to stacks
- Costs: compliance/patching = indirect dependence
- Risk: rapid upstream changes → unplanned spend
- Power: diffuse influence, higher coordination costs
Concentrated cloud, GPU and CDN suppliers tighten pricing, boosting delivery and codec costs
Supplier power is high: hyperscalers (AWS 32%/MSFT 22%/GCP 12% 2024) and Nvidia (≈80% datacenter GPU 2024) concentrate pricing and capacity, while CDN leaders (Akamai $3.3B, Cloudflare $1.3B; global CDN ≈$20B 2024) set delivery terms. Codec patent pools and licensors drive royalty risk; AV1 is royalty-free but 2–3x encoding cost vs HEVC. Multi-cloud/multi-CDN and volume commitments blunt but do not eliminate switching friction and margin exposure.
| Supplier | 2024 metric |
|---|---|
| Cloud | AWS 32% / MSFT 22% / GCP 12% (Synergy) |
| GPU | Nvidia ≈80% DC GPU share |
| CDN | Market ≈$20B; Akamai $3.3B; Cloudflare $1.3B |
| Codecs | AV1 royalty-free; AV1 encode cost 2–3x HEVC |
What is included in the product
Detailed Word Document
Comprehensive Porter's Five Forces analysis tailored to Harmonic, uncovering competitive drivers, supplier and buyer power, substitutes and entrant threats; identifies disruptive forces and market dynamics affecting pricing, profitability and barriers to entry, delivered in fully editable Word format for investor materials, strategy decks, or academic use.
Customizable Excel Spreadsheet
A harmonized Porter's Five Forces one-sheet that converts complex competitive pressure into an adjustable radar visualization and clean summary—customize levels, swap in your data, and drop directly into decks or dashboards without macros.
Customers Bargaining Power
Concentrated tier-1 customers
Large service providers and media conglomerates drive a disproportionate share of Harmonic’s bookings; their scale forces rigorous RFPs, bespoke contract terms, and frequent price concessions. Losing a single tier-1 account can materially affect quarterly bookings and backlog, reflecting high customer concentration risk. Reference value of Harmonic’s streaming and video-processing tech is strong, but purchasing leverage remains firmly with these buyers.
High switching costs yet multi-vendor
Deep workflow integration, strict SLAs, and specialized operational tooling create strong switching frictions for Harmonic customers, locking in multi-stage pipelines and support commitments. Still, many operators dual-source encoding, delivery, and DRM to avoid vendor lock-in, increasing competitive exposure and tempering pure pricing power. Proofs-of-concept are routinely used to extract better commercial terms. Major cloud providers held roughly 66% of the global IaaS/PaaS market in 2024 (Synergy Research Group), influencing sourcing strategies.
Outcome-based and SLA-heavy deals
Buyers now insist on outcome-based SLAs with uptime (commonly 99.99% = 52.6 minutes downtime/year), latency and QoE guarantees and penalty clauses that shift operational risk to Harmonic and compress margins if costs rise. Demonstrated reliability and historic low-failure rates justify premium pricing; SLA breaches typically trigger service credits often up to ~5–10% of monthly fees and can accelerate vendor reviews.
Price transparency and benchmarks
RFPs now benchmark TCO, density and per-channel/per-gig pricing across rivals, driving negotiations toward measurable per-unit metrics; public cloud services market surpassed $600 billion in 2024, and cloud cost curves plus open-source baselines anchor buyer expectations. Buyers demand volume discounts and elastic pricing (term, capacity or consumption), while competitive bids limit upward pricing flexibility and compress margins.
- RFPs: per-channel/per-gig TCO comparisons
- Anchors: public cloud $600B+ (2024) and open-source baselines
- Buyer asks: volume discounts, elastic pricing
- Market effect: competitive bids cap price increases
Feature velocity expectations
Customers demand rapid support for new codecs, ad-tech, FAST and low-latency protocols; 2024 industry reports show FAST channel count grew ~25% YoY, raising buyer expectations and increasing roadmap leverage over vendors.
When deliveries slip, buyers often extract concessions or expand scope at fixed price, whereas a predictable feature cadence can cut churn risk materially.
- Roadmap influence: increases buyer bargaining power
- Delays: trigger concessions or fixed-price scope creep
- Cadence: reduces churn and retention costs
- FAST growth ~25% YoY (2024)
Tier-1 clients drive RFPs, elastic pricing and SLA demands that compress margins
Large customers (tier-1 media/service providers) concentrate bookings, forcing RFPs, bespoke terms and frequent price concessions; losing one account can materially hit bookings. Deep workflow integration creates switching frictions, but dual-sourcing and PoCs preserve buyer leverage. Buyers demand outcome SLAs (99.99% = 52.6 min/yr), volume discounts and elastic pricing, compressing margins amid cloud benchmarking.
| Metric | 2024 value |
|---|---|
| Top cloud IaaS/PaaS share | ~66% (Synergy) |
| Public cloud market | >$600B |
| FAST channel growth | ~25% YoY |
| SLA target | 99.99% (52.6 min/yr) |
| Typical service credit | ~5–10% |
Preview Before You Purchase
Harmonic Porter's Five Forces Analysis
This preview is the exact Harmonic Porter’s Five Forces analysis you’ll receive upon purchase—fully formatted and ready for immediate use. It contains the complete, professionally written evaluation of competitive rivalry, supplier and buyer power, threat of entrants, and substitutes with no placeholders. No mockups or samples—what you see is the deliverable. Instant download follows payment.
Description
From Overview to Strategy Blueprint
Harmonic’s Porter's Five Forces Analysis distills competitive pressures—buyer and supplier power, rivalry, substitutes, and entry threats—into a clear, actionable view of industry dynamics, strategic vulnerabilities, and growth levers.
This brief snapshot only scratches the surface; unlock the full report for force-by-force ratings, visuals, and a consultant-grade breakdown tailored to Harmonic to guide investment or strategic decisions.
Suppliers Bargaining Power
Dependence on hyperscale clouds
Harmonic’s cloud-native delivery depends on AWS, Azure and GCP for compute, storage and AI services; in 2024 AWS/ Microsoft/ Google held about 32%/22%/12% of global cloud market (Synergy Research), concentrating supplier power. This gives hyperscalers leverage over pricing, egress fees and reserved-capacity terms. Multi-cloud reduces single-vendor risk but switching cloud primitives is complex and costly. Periodic price moves and API/service deprecations can quickly erode margins and disrupt SLAs.
Codec and IP licensing costs
Licenses for MPEG-2/4, HEVC and emerging codecs (VVC, LCEVC) remain concentrated in patent pools and key licensors, giving suppliers royalty leverage and compliance conditions that can materially affect margins; reported HEVC/license disputes have resulted in varied fees. AV1 is royalty-free via AOMedia, but AV1 encoding/compute costs are roughly 2–3x HEVC, raising operational trade-offs. Harmonic’s bargaining power therefore rests on purchase volumes and roadmap optionality to pivot codecs and hardware acceleration.
Specialized silicon and server OEMs
Encoders/transcoders rely on GPUs, ASICs, FPGAs and high-density servers from a concentrated supplier set; Nvidia held roughly 80% of the datacenter GPU market in 2024, concentrating power. Supply constraints and node transitions have pushed lead times to 16–24 weeks, raising COGS. Design-in cycles create chipset/board lock-in; volume commitments mitigate risk but supplier bargaining rises sharply during shortages.
CDN and network interconnect partners
Delivery economics hinge on CDN contracts, peering and regional carriers; concentrated capacity among Akamai (~$3.3B 2024), Cloudflare (~$1.3B 2024) and major cloud CDNs drives pricing and prioritization power, while the global CDN market was roughly $20B in 2024. Harmonic offsets risk via multi-CDN orchestration, but integration complexity and performance variability create switching frictions, and edge program participation can tie terms to broader ecosystems.
- Concentration: top CDNs wield pricing leverage
- Costs: contracts and peering determine delivery economics
- Switching friction: multi-CDN integration/perf variability
- Lock-in: edge programs can bundle ecosystem terms
Standards bodies and open-source stacks
Standards consortia (HLS 2009, DASH 2012, SCTE profiles such as SCTE‑35) and open-source cores (FFmpeg ~38k GitHub stars in 2024, x265 ~2.6k) determine compatibility and upgrade tempo; open-source lowers licensing fees but forces compliance and security patching work that creates indirect supplier dependence. Rapid upstream changes drove unplanned engineering spend in 2024 for many streaming vendors, and influence is diffuse, raising coordination costs more than direct bargaining power.
- Standards: HLS/DASH/SCTE dictate interoperability
- Open-source: FFmpeg/x265 central to stacks
- Costs: compliance/patching = indirect dependence
- Risk: rapid upstream changes → unplanned spend
- Power: diffuse influence, higher coordination costs
Concentrated cloud, GPU and CDN suppliers tighten pricing, boosting delivery and codec costs
Supplier power is high: hyperscalers (AWS 32%/MSFT 22%/GCP 12% 2024) and Nvidia (≈80% datacenter GPU 2024) concentrate pricing and capacity, while CDN leaders (Akamai $3.3B, Cloudflare $1.3B; global CDN ≈$20B 2024) set delivery terms. Codec patent pools and licensors drive royalty risk; AV1 is royalty-free but 2–3x encoding cost vs HEVC. Multi-cloud/multi-CDN and volume commitments blunt but do not eliminate switching friction and margin exposure.
| Supplier | 2024 metric |
|---|---|
| Cloud | AWS 32% / MSFT 22% / GCP 12% (Synergy) |
| GPU | Nvidia ≈80% DC GPU share |
| CDN | Market ≈$20B; Akamai $3.3B; Cloudflare $1.3B |
| Codecs | AV1 royalty-free; AV1 encode cost 2–3x HEVC |
What is included in the product
Detailed Word Document
Comprehensive Porter's Five Forces analysis tailored to Harmonic, uncovering competitive drivers, supplier and buyer power, substitutes and entrant threats; identifies disruptive forces and market dynamics affecting pricing, profitability and barriers to entry, delivered in fully editable Word format for investor materials, strategy decks, or academic use.
Customizable Excel Spreadsheet
A harmonized Porter's Five Forces one-sheet that converts complex competitive pressure into an adjustable radar visualization and clean summary—customize levels, swap in your data, and drop directly into decks or dashboards without macros.
Customers Bargaining Power
Concentrated tier-1 customers
Large service providers and media conglomerates drive a disproportionate share of Harmonic’s bookings; their scale forces rigorous RFPs, bespoke contract terms, and frequent price concessions. Losing a single tier-1 account can materially affect quarterly bookings and backlog, reflecting high customer concentration risk. Reference value of Harmonic’s streaming and video-processing tech is strong, but purchasing leverage remains firmly with these buyers.
High switching costs yet multi-vendor
Deep workflow integration, strict SLAs, and specialized operational tooling create strong switching frictions for Harmonic customers, locking in multi-stage pipelines and support commitments. Still, many operators dual-source encoding, delivery, and DRM to avoid vendor lock-in, increasing competitive exposure and tempering pure pricing power. Proofs-of-concept are routinely used to extract better commercial terms. Major cloud providers held roughly 66% of the global IaaS/PaaS market in 2024 (Synergy Research Group), influencing sourcing strategies.
Outcome-based and SLA-heavy deals
Buyers now insist on outcome-based SLAs with uptime (commonly 99.99% = 52.6 minutes downtime/year), latency and QoE guarantees and penalty clauses that shift operational risk to Harmonic and compress margins if costs rise. Demonstrated reliability and historic low-failure rates justify premium pricing; SLA breaches typically trigger service credits often up to ~5–10% of monthly fees and can accelerate vendor reviews.
Price transparency and benchmarks
RFPs now benchmark TCO, density and per-channel/per-gig pricing across rivals, driving negotiations toward measurable per-unit metrics; public cloud services market surpassed $600 billion in 2024, and cloud cost curves plus open-source baselines anchor buyer expectations. Buyers demand volume discounts and elastic pricing (term, capacity or consumption), while competitive bids limit upward pricing flexibility and compress margins.
- RFPs: per-channel/per-gig TCO comparisons
- Anchors: public cloud $600B+ (2024) and open-source baselines
- Buyer asks: volume discounts, elastic pricing
- Market effect: competitive bids cap price increases
Feature velocity expectations
Customers demand rapid support for new codecs, ad-tech, FAST and low-latency protocols; 2024 industry reports show FAST channel count grew ~25% YoY, raising buyer expectations and increasing roadmap leverage over vendors.
When deliveries slip, buyers often extract concessions or expand scope at fixed price, whereas a predictable feature cadence can cut churn risk materially.
- Roadmap influence: increases buyer bargaining power
- Delays: trigger concessions or fixed-price scope creep
- Cadence: reduces churn and retention costs
- FAST growth ~25% YoY (2024)
Tier-1 clients drive RFPs, elastic pricing and SLA demands that compress margins
Large customers (tier-1 media/service providers) concentrate bookings, forcing RFPs, bespoke terms and frequent price concessions; losing one account can materially hit bookings. Deep workflow integration creates switching frictions, but dual-sourcing and PoCs preserve buyer leverage. Buyers demand outcome SLAs (99.99% = 52.6 min/yr), volume discounts and elastic pricing, compressing margins amid cloud benchmarking.
| Metric | 2024 value |
|---|---|
| Top cloud IaaS/PaaS share | ~66% (Synergy) |
| Public cloud market | >$600B |
| FAST channel growth | ~25% YoY |
| SLA target | 99.99% (52.6 min/yr) |
| Typical service credit | ~5–10% |
Preview Before You Purchase
Harmonic Porter's Five Forces Analysis
This preview is the exact Harmonic Porter’s Five Forces analysis you’ll receive upon purchase—fully formatted and ready for immediate use. It contains the complete, professionally written evaluation of competitive rivalry, supplier and buyer power, threat of entrants, and substitutes with no placeholders. No mockups or samples—what you see is the deliverable. Instant download follows payment.











