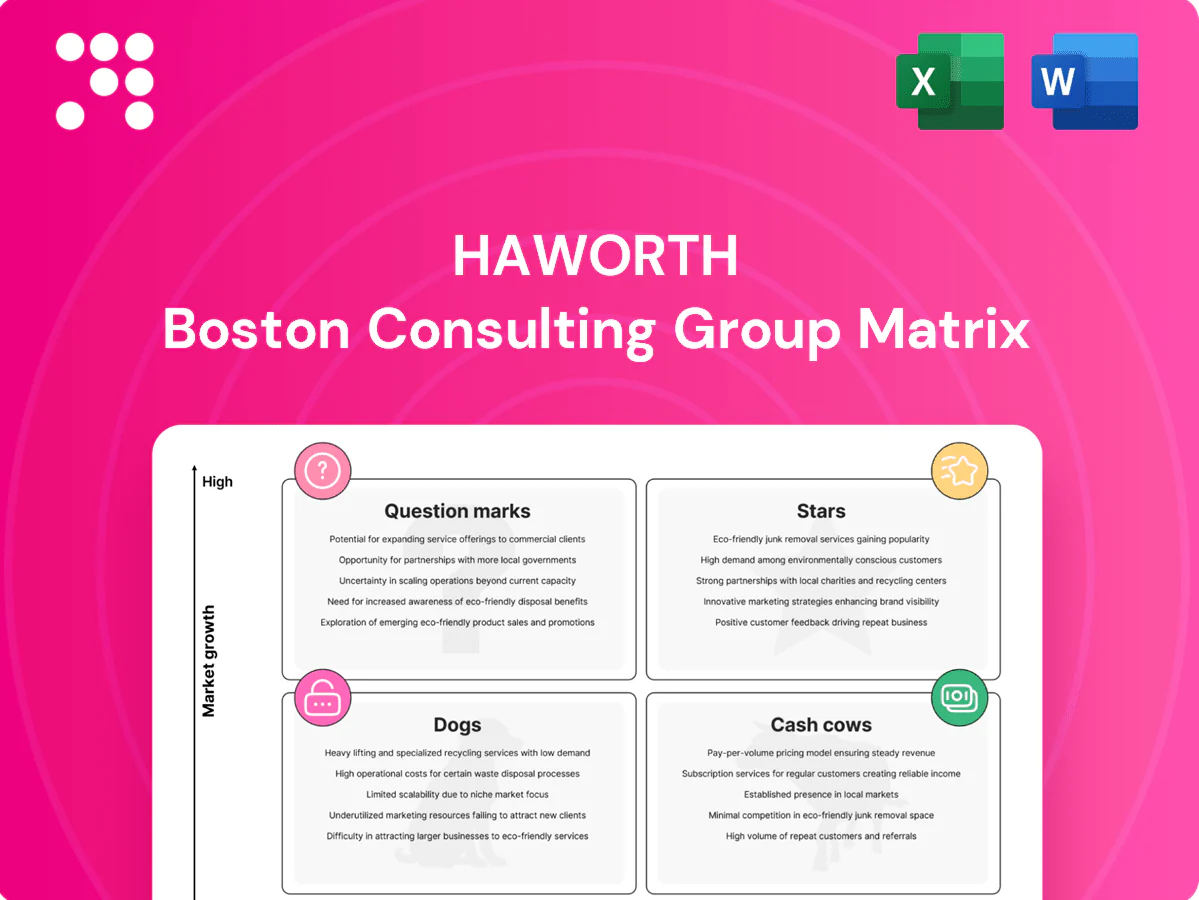
Haworth Boston Consulting Group Matrix

Visual. Strategic. Downloadable.
Curious where Haworth’s product lines sit in the market — Stars, Cash Cows, Dogs, or Question Marks? This snapshot teases the story; the full Haworth BCG Matrix gives quadrant-by-quadrant placements, data-backed recommendations, and a clear roadmap for capital allocation. Buy the complete report for a ready-to-use Word analysis plus an Excel summary you can present and act on. Get instant access and stop guessing—make confident, strategic moves now.
Stars

Architectural interiors (moveable walls)
Architectural interiors (moveable walls) sits in high-growth demand as companies reconfigure faster and cheaper than fixed build-outs; the global demountable partition market was about USD 5.2 billion in 2023 and is forecast to grow ~5% CAGR to 2030. Haworth’s design credibility and sustainability give it real share, leveraging its dealer network. Ongoing spec wins and dealer enablement are required to stay front-of-mind. Feed A&D relationships and case studies—this can mature into a major cash engine.
Height-adjustable benching systems
Height-adjustable benching systems stay in rising demand as well-being and flexibility drive cross-sector adoption; ergonomic furniture market forecast CAGR 6.2% (2024–2032, Grand View Research) supports continued uptake. Haworth’s integrated power, cable management and ergonomic options secure large standards and enterprise wins. Sales remain promo-heavy—pilots, mockups and change-management deliver conversion. As growth moderates it should hold share and mature into a cash cow.

High-performance ergonomic task seating
Hybrid work raised fit and feel to table stakes, keeping task chairs a Stars in a global office-furniture market near $60B in 2024 with the seating segment growing ~5.5% CAGR; Haworth competes at the top via innovation and breadth. Volume is large but marketing and 3–5 year refresh cycles drive cost; invest in BIFMA/GREENGUARD certifications, quick-ship (2–4 week) SKUs and sustainability proofs to lock leadership.

Acoustic pods and focus rooms
Open offices need private space yesterday; acoustic pods and focus rooms are a Stars in Haworth’s BCG view as demand surged in 2024 with pod deployments up ~38% and the global office pod market near $1.1B. Haworth’s architectural know-how and premium aesthetics capture higher ASPs, but capital and logistics intensity mean cash can burn as fast as revenue scales. Keep pushing modularity, faster installs, and global compliance to sustain growth.
- Market-2024: ~$1.1B
- Growth-2024: +38% YoY
- Strength: premium specs/architecture
- Risk: high capex/logistics, cash burn
Collaborative lounge and meeting settings
Collaborative lounge and meeting settings are replacing dead zones as decision-makers convert 2024 footprints into social + project spaces; Haworth’s curated ecosystems of power, surfaces and soft seating align with this shift, supporting a category that saw ~12% growth in 2024 and high buyer sensitivity to brand experience.
- Category: hot, fragmented
- Drivers: brand & dealer advocacy
- Tactics: vignette seeding, showroom stories, vertical bundles
Pods, seating and partitions: convert rapid market growth into reliable cash cows
Architectural interiors, benching, task chairs, pods and collaborative lounges are Stars for Haworth: demountable partitions $5.2B (2023, ~5% CAGR), seating ~$60B (2024, ~5.5% CAGR), pods $1.1B (2024, +38% YoY), ergonomic benching 6.2% CAGR (2024–32). Haworth’s design, sustainability and dealer network drive share; risks are capex, logistics and promo-led sales. Execute specs, quick-ship and certifications to convert to cash cows.
| Category | Market | Growth | Strength | Risk |
|---|---|---|---|---|
| Partitions | $5.2B (2023) | ~5% CAGR | Design/sustainability | Install cost |
| Seating | $60B (2024) | ~5.5% CAGR | Innovation/scale | Refresh cycles |
| Pods | $1.1B (2024) | +38% YoY | Premium ASPs | Logistics/capex |
| Benching | — | 6.2% CAGR (24–32) | Ergonomics/integration | Promo heavy |
What is included in the product
 Detailed Word Document
BCG Matrix review that maps Stars, Cash Cows, Question Marks and Dogs, with clear invest, hold or divest guidance.

 Customizable Excel Spreadsheet
One-page Haworth BCG Matrix easing portfolio decisions with quadrant clarity and export-ready slides.
Cash Cows

Systems furniture (panel + workstation platforms)
Systems furniture (panel + workstation platforms) sits in a mature global office-furniture market estimated at about USD 75 billion in 2024 with roughly a 4% CAGR, yet remains the backbone of large deployments. Haworth’s top-5 positioning and installed base drive steady margins from standards and spec-led repeat orders. Low incremental promo spend—specifications and reconfig cycles—keep revenue recurring. Focus capex on ops efficiency and lead-time reduction to sustainably milk cash flow.
Core task chairs (proven models)
Core task chairs are legacy lines selling on reputation, ergonomics, and reliability, driving high repeat orders with low education lift; the global office furniture market was about $60B in 2024 (Grand View Research), keeping demand steady. Margin-friendly SKUs use streamlined upholstery and finishes to protect gross margins while simplifying supply. Maintain assortments, protect price integrity, and keep parts/service tight to preserve aftermarket revenue and lifecycle profitability.

Storage solutions (lockers, credenzas, integrated)
Paper shrank but personal and team storage evolved; in 2024 Haworth saw steady demand for lockers, credenzas and integrated storage as organizations prioritized clean, flexible footprints. Lockers and integrated solutions continued flowing into corporate and education channels, with order volumes stable year-over-year. Predictable specs mean low growth but solid contribution to margins. Leaning into configurators and tool-free install widens cash spread and lowers service cost.

Conference and training tables
Conference and training tables
Steady 7–10 year replacement cycles in enterprise and 10–12 years in public sector sustain dependable volume with limited sizzle; 2024 procurement patterns favor standardized platforms. Controlled customization preserves margin durability while preferred-vendor relationships lock recurring institutional orders. SKU rationalization and simplified power options reduce costs and defend contract status.- Replacement cycle: 7–12 years (enterprise/public)
- Dependable volume: institutional contracts drive repeat orders
- Margin driver: controlled customization
- Operational focus: fewer SKUs, simplified power
- Strategy: defend preferred-vendor position
Government and education standards programs
Government and education standards programs are cash cows for Haworth: contracted pricing and compliance drive consistent orders, utilization remains high and admin costs are covered, while FY2024 U.S. education discretionary funding near 81 billion USD supports steady procurement demand.
- Contracted pricing ensures predictable revenue
- High utilization, admin covered
- Strong dealer network reduces delivery cost
- Maintain contract vehicles and SLAs to keep cash predictable
Systems furniture USD 75B, task chairs USD 60B, gov/edu USD 81B
Systems furniture: USD 75B global market in 2024, ~4% CAGR, high installed base and repeat specs yield steady margins; task chairs: legacy SKUs in a ~$60B 2024 market, high repeat demand and margin protection; gov/edu contracts (US discretionary ~$81B FY2024) deliver predictable orders and low promo spend, replacement cycles 7–12 years sustain cash flow.
| Category | 2024 size | CAGR/notes | Repl. cycle | Margin impact |
|---|---|---|---|---|
| Systems furniture | USD 75B | ~4% CAGR | 7–12y | High |
| Task chairs | USD 60B | Stable demand | 5–8y | High |
| Storage | — | Steady | 7–10y | Mid |
| Gov/Ed | USD 81B (US) | Contracted | Varies | Stable |
Delivered as Shown
Haworth BCG Matrix
The Haworth BCG Matrix you’re previewing here is the exact file you’ll receive after purchase — no watermarks, no sample pages, just the finished, ready-to-use report. Built for strategic clarity and quick decision-making, it’s formatted for easy editing, printing, or dropping into presentations. Buy once and download immediately; the full document lands in your inbox with no surprises or extra steps. Trust the design and analysis: it’s the real, analysis-ready deliverable.

Visual. Strategic. Downloadable.
Curious where Haworth’s product lines sit in the market — Stars, Cash Cows, Dogs, or Question Marks? This snapshot teases the story; the full Haworth BCG Matrix gives quadrant-by-quadrant placements, data-backed recommendations, and a clear roadmap for capital allocation. Buy the complete report for a ready-to-use Word analysis plus an Excel summary you can present and act on. Get instant access and stop guessing—make confident, strategic moves now.
Stars
Architectural interiors (moveable walls)
Architectural interiors (moveable walls) sits in high-growth demand as companies reconfigure faster and cheaper than fixed build-outs; the global demountable partition market was about USD 5.2 billion in 2023 and is forecast to grow ~5% CAGR to 2030. Haworth’s design credibility and sustainability give it real share, leveraging its dealer network. Ongoing spec wins and dealer enablement are required to stay front-of-mind. Feed A&D relationships and case studies—this can mature into a major cash engine.
Height-adjustable benching systems
Height-adjustable benching systems stay in rising demand as well-being and flexibility drive cross-sector adoption; ergonomic furniture market forecast CAGR 6.2% (2024–2032, Grand View Research) supports continued uptake. Haworth’s integrated power, cable management and ergonomic options secure large standards and enterprise wins. Sales remain promo-heavy—pilots, mockups and change-management deliver conversion. As growth moderates it should hold share and mature into a cash cow.
High-performance ergonomic task seating
Hybrid work raised fit and feel to table stakes, keeping task chairs a Stars in a global office-furniture market near $60B in 2024 with the seating segment growing ~5.5% CAGR; Haworth competes at the top via innovation and breadth. Volume is large but marketing and 3–5 year refresh cycles drive cost; invest in BIFMA/GREENGUARD certifications, quick-ship (2–4 week) SKUs and sustainability proofs to lock leadership.
Acoustic pods and focus rooms
Open offices need private space yesterday; acoustic pods and focus rooms are a Stars in Haworth’s BCG view as demand surged in 2024 with pod deployments up ~38% and the global office pod market near $1.1B. Haworth’s architectural know-how and premium aesthetics capture higher ASPs, but capital and logistics intensity mean cash can burn as fast as revenue scales. Keep pushing modularity, faster installs, and global compliance to sustain growth.
- Market-2024: ~$1.1B
- Growth-2024: +38% YoY
- Strength: premium specs/architecture
- Risk: high capex/logistics, cash burn
Collaborative lounge and meeting settings
Collaborative lounge and meeting settings are replacing dead zones as decision-makers convert 2024 footprints into social + project spaces; Haworth’s curated ecosystems of power, surfaces and soft seating align with this shift, supporting a category that saw ~12% growth in 2024 and high buyer sensitivity to brand experience.
- Category: hot, fragmented
- Drivers: brand & dealer advocacy
- Tactics: vignette seeding, showroom stories, vertical bundles
Pods, seating and partitions: convert rapid market growth into reliable cash cows
Architectural interiors, benching, task chairs, pods and collaborative lounges are Stars for Haworth: demountable partitions $5.2B (2023, ~5% CAGR), seating ~$60B (2024, ~5.5% CAGR), pods $1.1B (2024, +38% YoY), ergonomic benching 6.2% CAGR (2024–32). Haworth’s design, sustainability and dealer network drive share; risks are capex, logistics and promo-led sales. Execute specs, quick-ship and certifications to convert to cash cows.
| Category | Market | Growth | Strength | Risk |
|---|---|---|---|---|
| Partitions | $5.2B (2023) | ~5% CAGR | Design/sustainability | Install cost |
| Seating | $60B (2024) | ~5.5% CAGR | Innovation/scale | Refresh cycles |
| Pods | $1.1B (2024) | +38% YoY | Premium ASPs | Logistics/capex |
| Benching | — | 6.2% CAGR (24–32) | Ergonomics/integration | Promo heavy |
What is included in the product
Detailed Word Document
BCG Matrix review that maps Stars, Cash Cows, Question Marks and Dogs, with clear invest, hold or divest guidance.
Customizable Excel Spreadsheet
One-page Haworth BCG Matrix easing portfolio decisions with quadrant clarity and export-ready slides.
Cash Cows
Systems furniture (panel + workstation platforms)
Systems furniture (panel + workstation platforms) sits in a mature global office-furniture market estimated at about USD 75 billion in 2024 with roughly a 4% CAGR, yet remains the backbone of large deployments. Haworth’s top-5 positioning and installed base drive steady margins from standards and spec-led repeat orders. Low incremental promo spend—specifications and reconfig cycles—keep revenue recurring. Focus capex on ops efficiency and lead-time reduction to sustainably milk cash flow.
Core task chairs (proven models)
Core task chairs are legacy lines selling on reputation, ergonomics, and reliability, driving high repeat orders with low education lift; the global office furniture market was about $60B in 2024 (Grand View Research), keeping demand steady. Margin-friendly SKUs use streamlined upholstery and finishes to protect gross margins while simplifying supply. Maintain assortments, protect price integrity, and keep parts/service tight to preserve aftermarket revenue and lifecycle profitability.
Storage solutions (lockers, credenzas, integrated)
Paper shrank but personal and team storage evolved; in 2024 Haworth saw steady demand for lockers, credenzas and integrated storage as organizations prioritized clean, flexible footprints. Lockers and integrated solutions continued flowing into corporate and education channels, with order volumes stable year-over-year. Predictable specs mean low growth but solid contribution to margins. Leaning into configurators and tool-free install widens cash spread and lowers service cost.
Conference and training tables
Conference and training tables
Steady 7–10 year replacement cycles in enterprise and 10–12 years in public sector sustain dependable volume with limited sizzle; 2024 procurement patterns favor standardized platforms. Controlled customization preserves margin durability while preferred-vendor relationships lock recurring institutional orders. SKU rationalization and simplified power options reduce costs and defend contract status.- Replacement cycle: 7–12 years (enterprise/public)
- Dependable volume: institutional contracts drive repeat orders
- Margin driver: controlled customization
- Operational focus: fewer SKUs, simplified power
- Strategy: defend preferred-vendor position
Government and education standards programs
Government and education standards programs are cash cows for Haworth: contracted pricing and compliance drive consistent orders, utilization remains high and admin costs are covered, while FY2024 U.S. education discretionary funding near 81 billion USD supports steady procurement demand.
- Contracted pricing ensures predictable revenue
- High utilization, admin covered
- Strong dealer network reduces delivery cost
- Maintain contract vehicles and SLAs to keep cash predictable
Systems furniture USD 75B, task chairs USD 60B, gov/edu USD 81B
Systems furniture: USD 75B global market in 2024, ~4% CAGR, high installed base and repeat specs yield steady margins; task chairs: legacy SKUs in a ~$60B 2024 market, high repeat demand and margin protection; gov/edu contracts (US discretionary ~$81B FY2024) deliver predictable orders and low promo spend, replacement cycles 7–12 years sustain cash flow.
| Category | 2024 size | CAGR/notes | Repl. cycle | Margin impact |
|---|---|---|---|---|
| Systems furniture | USD 75B | ~4% CAGR | 7–12y | High |
| Task chairs | USD 60B | Stable demand | 5–8y | High |
| Storage | — | Steady | 7–10y | Mid |
| Gov/Ed | USD 81B (US) | Contracted | Varies | Stable |
Delivered as Shown
Haworth BCG Matrix
The Haworth BCG Matrix you’re previewing here is the exact file you’ll receive after purchase — no watermarks, no sample pages, just the finished, ready-to-use report. Built for strategic clarity and quick decision-making, it’s formatted for easy editing, printing, or dropping into presentations. Buy once and download immediately; the full document lands in your inbox with no surprises or extra steps. Trust the design and analysis: it’s the real, analysis-ready deliverable.
Original: $10.00
-65%$10.00
$3.50Description
Visual. Strategic. Downloadable.
Curious where Haworth’s product lines sit in the market — Stars, Cash Cows, Dogs, or Question Marks? This snapshot teases the story; the full Haworth BCG Matrix gives quadrant-by-quadrant placements, data-backed recommendations, and a clear roadmap for capital allocation. Buy the complete report for a ready-to-use Word analysis plus an Excel summary you can present and act on. Get instant access and stop guessing—make confident, strategic moves now.
Stars
Architectural interiors (moveable walls)
Architectural interiors (moveable walls) sits in high-growth demand as companies reconfigure faster and cheaper than fixed build-outs; the global demountable partition market was about USD 5.2 billion in 2023 and is forecast to grow ~5% CAGR to 2030. Haworth’s design credibility and sustainability give it real share, leveraging its dealer network. Ongoing spec wins and dealer enablement are required to stay front-of-mind. Feed A&D relationships and case studies—this can mature into a major cash engine.
Height-adjustable benching systems
Height-adjustable benching systems stay in rising demand as well-being and flexibility drive cross-sector adoption; ergonomic furniture market forecast CAGR 6.2% (2024–2032, Grand View Research) supports continued uptake. Haworth’s integrated power, cable management and ergonomic options secure large standards and enterprise wins. Sales remain promo-heavy—pilots, mockups and change-management deliver conversion. As growth moderates it should hold share and mature into a cash cow.
High-performance ergonomic task seating
Hybrid work raised fit and feel to table stakes, keeping task chairs a Stars in a global office-furniture market near $60B in 2024 with the seating segment growing ~5.5% CAGR; Haworth competes at the top via innovation and breadth. Volume is large but marketing and 3–5 year refresh cycles drive cost; invest in BIFMA/GREENGUARD certifications, quick-ship (2–4 week) SKUs and sustainability proofs to lock leadership.
Acoustic pods and focus rooms
Open offices need private space yesterday; acoustic pods and focus rooms are a Stars in Haworth’s BCG view as demand surged in 2024 with pod deployments up ~38% and the global office pod market near $1.1B. Haworth’s architectural know-how and premium aesthetics capture higher ASPs, but capital and logistics intensity mean cash can burn as fast as revenue scales. Keep pushing modularity, faster installs, and global compliance to sustain growth.
- Market-2024: ~$1.1B
- Growth-2024: +38% YoY
- Strength: premium specs/architecture
- Risk: high capex/logistics, cash burn
Collaborative lounge and meeting settings
Collaborative lounge and meeting settings are replacing dead zones as decision-makers convert 2024 footprints into social + project spaces; Haworth’s curated ecosystems of power, surfaces and soft seating align with this shift, supporting a category that saw ~12% growth in 2024 and high buyer sensitivity to brand experience.
- Category: hot, fragmented
- Drivers: brand & dealer advocacy
- Tactics: vignette seeding, showroom stories, vertical bundles
Pods, seating and partitions: convert rapid market growth into reliable cash cows
Architectural interiors, benching, task chairs, pods and collaborative lounges are Stars for Haworth: demountable partitions $5.2B (2023, ~5% CAGR), seating ~$60B (2024, ~5.5% CAGR), pods $1.1B (2024, +38% YoY), ergonomic benching 6.2% CAGR (2024–32). Haworth’s design, sustainability and dealer network drive share; risks are capex, logistics and promo-led sales. Execute specs, quick-ship and certifications to convert to cash cows.
| Category | Market | Growth | Strength | Risk |
|---|---|---|---|---|
| Partitions | $5.2B (2023) | ~5% CAGR | Design/sustainability | Install cost |
| Seating | $60B (2024) | ~5.5% CAGR | Innovation/scale | Refresh cycles |
| Pods | $1.1B (2024) | +38% YoY | Premium ASPs | Logistics/capex |
| Benching | — | 6.2% CAGR (24–32) | Ergonomics/integration | Promo heavy |
What is included in the product
Detailed Word Document
BCG Matrix review that maps Stars, Cash Cows, Question Marks and Dogs, with clear invest, hold or divest guidance.
Customizable Excel Spreadsheet
One-page Haworth BCG Matrix easing portfolio decisions with quadrant clarity and export-ready slides.
Cash Cows
Systems furniture (panel + workstation platforms)
Systems furniture (panel + workstation platforms) sits in a mature global office-furniture market estimated at about USD 75 billion in 2024 with roughly a 4% CAGR, yet remains the backbone of large deployments. Haworth’s top-5 positioning and installed base drive steady margins from standards and spec-led repeat orders. Low incremental promo spend—specifications and reconfig cycles—keep revenue recurring. Focus capex on ops efficiency and lead-time reduction to sustainably milk cash flow.
Core task chairs (proven models)
Core task chairs are legacy lines selling on reputation, ergonomics, and reliability, driving high repeat orders with low education lift; the global office furniture market was about $60B in 2024 (Grand View Research), keeping demand steady. Margin-friendly SKUs use streamlined upholstery and finishes to protect gross margins while simplifying supply. Maintain assortments, protect price integrity, and keep parts/service tight to preserve aftermarket revenue and lifecycle profitability.
Storage solutions (lockers, credenzas, integrated)
Paper shrank but personal and team storage evolved; in 2024 Haworth saw steady demand for lockers, credenzas and integrated storage as organizations prioritized clean, flexible footprints. Lockers and integrated solutions continued flowing into corporate and education channels, with order volumes stable year-over-year. Predictable specs mean low growth but solid contribution to margins. Leaning into configurators and tool-free install widens cash spread and lowers service cost.
Conference and training tables
Conference and training tables
Steady 7–10 year replacement cycles in enterprise and 10–12 years in public sector sustain dependable volume with limited sizzle; 2024 procurement patterns favor standardized platforms. Controlled customization preserves margin durability while preferred-vendor relationships lock recurring institutional orders. SKU rationalization and simplified power options reduce costs and defend contract status.- Replacement cycle: 7–12 years (enterprise/public)
- Dependable volume: institutional contracts drive repeat orders
- Margin driver: controlled customization
- Operational focus: fewer SKUs, simplified power
- Strategy: defend preferred-vendor position
Government and education standards programs
Government and education standards programs are cash cows for Haworth: contracted pricing and compliance drive consistent orders, utilization remains high and admin costs are covered, while FY2024 U.S. education discretionary funding near 81 billion USD supports steady procurement demand.
- Contracted pricing ensures predictable revenue
- High utilization, admin covered
- Strong dealer network reduces delivery cost
- Maintain contract vehicles and SLAs to keep cash predictable
Systems furniture USD 75B, task chairs USD 60B, gov/edu USD 81B
Systems furniture: USD 75B global market in 2024, ~4% CAGR, high installed base and repeat specs yield steady margins; task chairs: legacy SKUs in a ~$60B 2024 market, high repeat demand and margin protection; gov/edu contracts (US discretionary ~$81B FY2024) deliver predictable orders and low promo spend, replacement cycles 7–12 years sustain cash flow.
| Category | 2024 size | CAGR/notes | Repl. cycle | Margin impact |
|---|---|---|---|---|
| Systems furniture | USD 75B | ~4% CAGR | 7–12y | High |
| Task chairs | USD 60B | Stable demand | 5–8y | High |
| Storage | — | Steady | 7–10y | Mid |
| Gov/Ed | USD 81B (US) | Contracted | Varies | Stable |
Delivered as Shown
Haworth BCG Matrix
The Haworth BCG Matrix you’re previewing here is the exact file you’ll receive after purchase — no watermarks, no sample pages, just the finished, ready-to-use report. Built for strategic clarity and quick decision-making, it’s formatted for easy editing, printing, or dropping into presentations. Buy once and download immediately; the full document lands in your inbox with no surprises or extra steps. Trust the design and analysis: it’s the real, analysis-ready deliverable.











