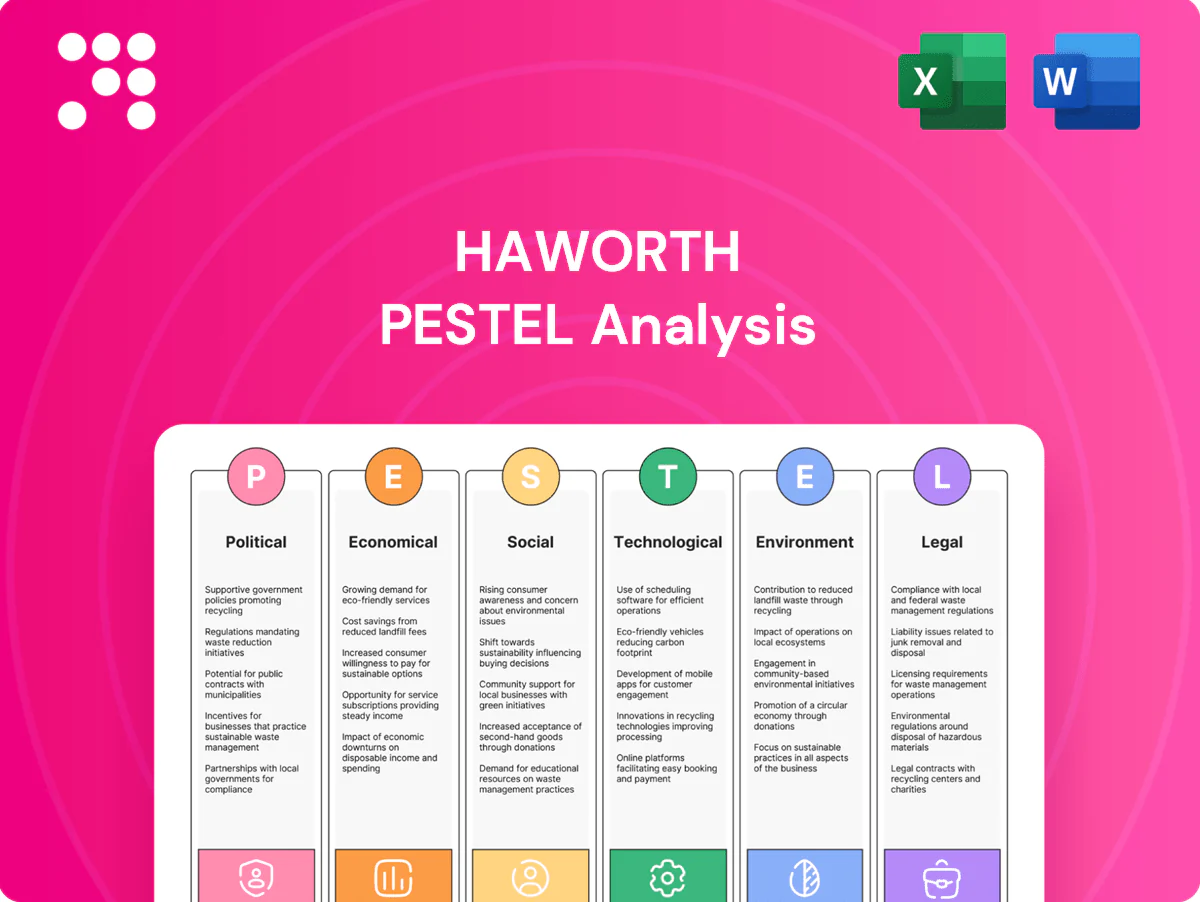
Haworth PESTLE Analysis

Make Smarter Strategic Decisions with a Complete PESTEL View
Unlock strategic advantage with our PESTLE analysis of Haworth—concise insight into political, economic, social, technological, legal and environmental forces shaping its future. Ideal for investors and strategists, it’s fully editable and boardroom-ready. Purchase the full report now for the complete, actionable breakdown.
Political factors

Trade and tariffs
Import duties—notably US Section 232 steel at 25% and aluminum at 10%, plus Section 301 tariffs up to 25% on many China-origin goods—raise input and finished-furniture costs across Haworth’s global footprint, pressuring margins and pricing. Recent trade disputes and selective bilateral deals have shifted sourcing risk toward Asia and North America. Haworth can mitigate via supplier diversification and regionalized production to avoid duties, and by tapping manufacturing incentives such as the US Inflation Reduction Act and EU state-aid programs.
Public procurement
Government purchasing rules span corporate, education, healthcare and defense with FAR-based federal contracts, state procurement boards, and tighter Buy American/local content rules; OECD estimates public procurement ~12% of GDP. Certifications (ISO, GSA schedules), transparent e-bidding and stricter local content rose after ARPA $350B and IIJA $550B. Fiscal cycles (US FY Oct–Sep) and stimulus timing drive workspace modernization spend; CHIPS $280B and rising defense budgets heighten geopolitical risk to contract continuity.

Geopolitical stability
Haworth faces exposure from regional unrest and logistics chokepoints such as the Suez Canal (about 12% of global trade transits), prompting multi-sourcing across Asia and Eastern Europe and contingency inventory near key markets. China retains capital controls and FX reserves near $3.2 trillion (end-2024), affecting repatriation timing; Haworth emphasizes trade-credit insurance and FX hedges to protect margins and cash flow.

Industrial policy
Industrial policy materially affects Haworth: US infrastructure law (IIJA) channels about 1.2 trillion USD and the Inflation Reduction Act directs roughly 369 billion USD toward clean energy, while the CHIPS Act provides ~52 billion USD for domestic advanced manufacturing, creating demand for adaptable interiors and office retrofits; tax credits for energy-efficient facilities and federal R&D credits lower capex, but subsidies often carry domestic-content and reporting compliance obligations.
- Manufacturing incentives: IIJA 1.2T, CHIPS 52B, IRA ~369B
- Tax credits: energy-efficiency + federal R&D credit
- Demand: infrastructure-driven retrofit/office fit-outs
- Risk: subsidy-linked domestic content/compliance
Standards diplomacy
International standards bodies and national regulations—EN standards across the EU, BIFMA/NFPA-influenced frameworks in the US, and heterogeneous GB/national standards in APAC—shape furniture, fire-safety and ergonomic norms; manufacturers must secure market-specific certifications and monitor regional divergence to sell into 27 EU states, US federal/state jurisdictions, and diverse APAC regimes. Participation in standards consultations can shift technical requirements and reduce compliance costs.
- EN vs BIFMA/NFPA vs GB/national
- Certify per market before entry
- Engage in policy consultations
Political shocks reshape supply chains: tariffs, subsidies, chokepoints drive regionalization
Political risks—tariffs (US Sec232: steel 25%, alu 10%; Sec301 up to 25%) and procurement rules (public procurement ~12% GDP) raise costs and shape sourcing; IIJA, IRA, CHIPS (IIJA 1.2T, IRA ~369B, CHIPS ~52B) create retrofit/domestic-manufacturing demand but carry domestic-content conditions; export controls, FX reserves (~3.2T China end-2024) and chokepoints (Suez ~12% trade) drive regionalization and hedging.
| Factor | Metric | Impact |
|---|---|---|
| Tariffs | 25%/10%/up to25% | Higher input costs |
| Industrial policy | IIJA 1.2T; IRA 369B; CHIPS 52B | Demand + domestic rules |
| Logistics | Suez ~12% trade | Supply risk |
What is included in the product
 Detailed Word Document
Explores how macro-environmental factors uniquely affect Haworth across Political, Economic, Social, Technological, Environmental and Legal dimensions, with data-backed trends and forward-looking insights that reflect market and regulatory dynamics to help executives, consultants and entrepreneurs identify threats, opportunities and scenario-driven strategies.

 Customizable Excel Spreadsheet
A concise, visually segmented PESTLE summary of Haworth for quick reference in meetings or presentations, easily dropped into slides or shared across teams; editable notes let users adapt insights to local markets, regions, or specific business lines for faster alignment and decision-making.
Economic factors

Demand cycles
Demand for Haworth products tracks macro growth — IMF projected global GDP growth 3.0% in 2024 — and corporate capex cycles; CBRE/JLL reported office vacancy elevated in 2024, pressuring new-build spend while boosting reconfiguration demand. Healthcare, education and government remain more resilient with steadier procurement versus cyclical corporate clients. Hybrid work shifts spending toward reconfiguration and flexible furniture over new-builds, increasing emphasis on near-term pipeline visibility and backlog quality to manage margin timing.
Input inflation
Track commodity shifts: LME copper near $9,500/ton and Brent around $85/bbl in H1 2025, with global container rates (Drewry WCI) roughly $1,500/FEU, plus persistent foam and fabric cost inflation from 2024–25. Analyze pass-through capacity and quarterly pricing cadence to protect margins. Use long-term supplier contracts and design-to-cost to stabilize gross margin. Monitor supplier financial health and lead-time KPIs to avoid disruptions.

FX volatility
Measure currency exposures across production, sourcing and sales regions, noting Haworth’s mix of North American production vs 30–40% sales in EMEA/APAC; track transaction vs translation effects and quantify in P&L lines. Maintain documented hedging policies and exploit natural offsets (local sourcing, local invoicing) to reduce transaction volatility. Consider pricing localization and invoicing currencies to protect margins. Monitor FX backdrop: DXY averaged about 104 in 2024, affecting translation/transaction impacts on earnings.

Labor markets
- tags: skilled-talent, wage-pressure, productivity, automation-ROI, upskilling, regional-competition
Credit conditions
Rising benchmark borrowing costs (US federal funds target 5.25–5.50% as of June 2025) tighten customer financing for fit-outs and slow developer project starts, while leasing shows longer payment schedules and more concessions across North American and EMEA markets; Haworth must preserve balance sheet flexibility for working capital and capex and monitor customer credit risk and receivables quality closely.
- Interest rates: US 5.25–5.50% (Jun 2025)
- Leasing: longer terms, higher concessions
- Balance sheet: prioritize liquidity for capex/WC
- Credit risk: tighten receivables monitoring
Political shocks reshape supply chains: tariffs, subsidies, chokepoints drive regionalization
Demand follows IMF 2024 GDP 3.0%; elevated office vacancy cuts new-builds but lifts reconfiguration; healthcare/education stay resilient. Input costs: LME copper ~$9,500/t, Brent ~$85/bbl (H1 2025) and Drewry WCI ~$1,500/FEU—pricing pass-through and contracts vital. DXY ~104 (2024) and US rates 5.25–5.50% (Jun 2025) raise FX and financing risk; prioritize hedging and liquidity.
| Metric | Value |
|---|---|
| Global GDP (IMF 2024) | 3.0% |
| LME copper (H1 2025) | $9,500/t |
| Brent (H1 2025) | $85/bbl |
| DXY (2024) | ~104 |
| US rates (Jun 2025) | 5.25–5.50% |
Preview Before You Purchase
Haworth PESTLE Analysis
This Haworth PESTLE Analysis provides a concise, professionally structured review of political, economic, social, technological, legal and environmental factors affecting Haworth. The preview shown here is the exact document you’ll receive after purchase—fully formatted and ready to use. Immediate download after payment; no placeholders, just the final file.

Make Smarter Strategic Decisions with a Complete PESTEL View
Unlock strategic advantage with our PESTLE analysis of Haworth—concise insight into political, economic, social, technological, legal and environmental forces shaping its future. Ideal for investors and strategists, it’s fully editable and boardroom-ready. Purchase the full report now for the complete, actionable breakdown.
Political factors
Trade and tariffs
Import duties—notably US Section 232 steel at 25% and aluminum at 10%, plus Section 301 tariffs up to 25% on many China-origin goods—raise input and finished-furniture costs across Haworth’s global footprint, pressuring margins and pricing. Recent trade disputes and selective bilateral deals have shifted sourcing risk toward Asia and North America. Haworth can mitigate via supplier diversification and regionalized production to avoid duties, and by tapping manufacturing incentives such as the US Inflation Reduction Act and EU state-aid programs.
Public procurement
Government purchasing rules span corporate, education, healthcare and defense with FAR-based federal contracts, state procurement boards, and tighter Buy American/local content rules; OECD estimates public procurement ~12% of GDP. Certifications (ISO, GSA schedules), transparent e-bidding and stricter local content rose after ARPA $350B and IIJA $550B. Fiscal cycles (US FY Oct–Sep) and stimulus timing drive workspace modernization spend; CHIPS $280B and rising defense budgets heighten geopolitical risk to contract continuity.
Geopolitical stability
Haworth faces exposure from regional unrest and logistics chokepoints such as the Suez Canal (about 12% of global trade transits), prompting multi-sourcing across Asia and Eastern Europe and contingency inventory near key markets. China retains capital controls and FX reserves near $3.2 trillion (end-2024), affecting repatriation timing; Haworth emphasizes trade-credit insurance and FX hedges to protect margins and cash flow.
Industrial policy
Industrial policy materially affects Haworth: US infrastructure law (IIJA) channels about 1.2 trillion USD and the Inflation Reduction Act directs roughly 369 billion USD toward clean energy, while the CHIPS Act provides ~52 billion USD for domestic advanced manufacturing, creating demand for adaptable interiors and office retrofits; tax credits for energy-efficient facilities and federal R&D credits lower capex, but subsidies often carry domestic-content and reporting compliance obligations.
- Manufacturing incentives: IIJA 1.2T, CHIPS 52B, IRA ~369B
- Tax credits: energy-efficiency + federal R&D credit
- Demand: infrastructure-driven retrofit/office fit-outs
- Risk: subsidy-linked domestic content/compliance
Standards diplomacy
International standards bodies and national regulations—EN standards across the EU, BIFMA/NFPA-influenced frameworks in the US, and heterogeneous GB/national standards in APAC—shape furniture, fire-safety and ergonomic norms; manufacturers must secure market-specific certifications and monitor regional divergence to sell into 27 EU states, US federal/state jurisdictions, and diverse APAC regimes. Participation in standards consultations can shift technical requirements and reduce compliance costs.
- EN vs BIFMA/NFPA vs GB/national
- Certify per market before entry
- Engage in policy consultations
Political shocks reshape supply chains: tariffs, subsidies, chokepoints drive regionalization
Political risks—tariffs (US Sec232: steel 25%, alu 10%; Sec301 up to 25%) and procurement rules (public procurement ~12% GDP) raise costs and shape sourcing; IIJA, IRA, CHIPS (IIJA 1.2T, IRA ~369B, CHIPS ~52B) create retrofit/domestic-manufacturing demand but carry domestic-content conditions; export controls, FX reserves (~3.2T China end-2024) and chokepoints (Suez ~12% trade) drive regionalization and hedging.
| Factor | Metric | Impact |
|---|---|---|
| Tariffs | 25%/10%/up to25% | Higher input costs |
| Industrial policy | IIJA 1.2T; IRA 369B; CHIPS 52B | Demand + domestic rules |
| Logistics | Suez ~12% trade | Supply risk |
What is included in the product
Detailed Word Document
Explores how macro-environmental factors uniquely affect Haworth across Political, Economic, Social, Technological, Environmental and Legal dimensions, with data-backed trends and forward-looking insights that reflect market and regulatory dynamics to help executives, consultants and entrepreneurs identify threats, opportunities and scenario-driven strategies.
Customizable Excel Spreadsheet
A concise, visually segmented PESTLE summary of Haworth for quick reference in meetings or presentations, easily dropped into slides or shared across teams; editable notes let users adapt insights to local markets, regions, or specific business lines for faster alignment and decision-making.
Economic factors
Demand cycles
Demand for Haworth products tracks macro growth — IMF projected global GDP growth 3.0% in 2024 — and corporate capex cycles; CBRE/JLL reported office vacancy elevated in 2024, pressuring new-build spend while boosting reconfiguration demand. Healthcare, education and government remain more resilient with steadier procurement versus cyclical corporate clients. Hybrid work shifts spending toward reconfiguration and flexible furniture over new-builds, increasing emphasis on near-term pipeline visibility and backlog quality to manage margin timing.
Input inflation
Track commodity shifts: LME copper near $9,500/ton and Brent around $85/bbl in H1 2025, with global container rates (Drewry WCI) roughly $1,500/FEU, plus persistent foam and fabric cost inflation from 2024–25. Analyze pass-through capacity and quarterly pricing cadence to protect margins. Use long-term supplier contracts and design-to-cost to stabilize gross margin. Monitor supplier financial health and lead-time KPIs to avoid disruptions.
FX volatility
Measure currency exposures across production, sourcing and sales regions, noting Haworth’s mix of North American production vs 30–40% sales in EMEA/APAC; track transaction vs translation effects and quantify in P&L lines. Maintain documented hedging policies and exploit natural offsets (local sourcing, local invoicing) to reduce transaction volatility. Consider pricing localization and invoicing currencies to protect margins. Monitor FX backdrop: DXY averaged about 104 in 2024, affecting translation/transaction impacts on earnings.
Labor markets
- tags: skilled-talent, wage-pressure, productivity, automation-ROI, upskilling, regional-competition
Credit conditions
Rising benchmark borrowing costs (US federal funds target 5.25–5.50% as of June 2025) tighten customer financing for fit-outs and slow developer project starts, while leasing shows longer payment schedules and more concessions across North American and EMEA markets; Haworth must preserve balance sheet flexibility for working capital and capex and monitor customer credit risk and receivables quality closely.
- Interest rates: US 5.25–5.50% (Jun 2025)
- Leasing: longer terms, higher concessions
- Balance sheet: prioritize liquidity for capex/WC
- Credit risk: tighten receivables monitoring
Political shocks reshape supply chains: tariffs, subsidies, chokepoints drive regionalization
Demand follows IMF 2024 GDP 3.0%; elevated office vacancy cuts new-builds but lifts reconfiguration; healthcare/education stay resilient. Input costs: LME copper ~$9,500/t, Brent ~$85/bbl (H1 2025) and Drewry WCI ~$1,500/FEU—pricing pass-through and contracts vital. DXY ~104 (2024) and US rates 5.25–5.50% (Jun 2025) raise FX and financing risk; prioritize hedging and liquidity.
| Metric | Value |
|---|---|
| Global GDP (IMF 2024) | 3.0% |
| LME copper (H1 2025) | $9,500/t |
| Brent (H1 2025) | $85/bbl |
| DXY (2024) | ~104 |
| US rates (Jun 2025) | 5.25–5.50% |
Preview Before You Purchase
Haworth PESTLE Analysis
This Haworth PESTLE Analysis provides a concise, professionally structured review of political, economic, social, technological, legal and environmental factors affecting Haworth. The preview shown here is the exact document you’ll receive after purchase—fully formatted and ready to use. Immediate download after payment; no placeholders, just the final file.
Original: $10.00
-65%$10.00
$3.50Description
Make Smarter Strategic Decisions with a Complete PESTEL View
Unlock strategic advantage with our PESTLE analysis of Haworth—concise insight into political, economic, social, technological, legal and environmental forces shaping its future. Ideal for investors and strategists, it’s fully editable and boardroom-ready. Purchase the full report now for the complete, actionable breakdown.
Political factors
Trade and tariffs
Import duties—notably US Section 232 steel at 25% and aluminum at 10%, plus Section 301 tariffs up to 25% on many China-origin goods—raise input and finished-furniture costs across Haworth’s global footprint, pressuring margins and pricing. Recent trade disputes and selective bilateral deals have shifted sourcing risk toward Asia and North America. Haworth can mitigate via supplier diversification and regionalized production to avoid duties, and by tapping manufacturing incentives such as the US Inflation Reduction Act and EU state-aid programs.
Public procurement
Government purchasing rules span corporate, education, healthcare and defense with FAR-based federal contracts, state procurement boards, and tighter Buy American/local content rules; OECD estimates public procurement ~12% of GDP. Certifications (ISO, GSA schedules), transparent e-bidding and stricter local content rose after ARPA $350B and IIJA $550B. Fiscal cycles (US FY Oct–Sep) and stimulus timing drive workspace modernization spend; CHIPS $280B and rising defense budgets heighten geopolitical risk to contract continuity.
Geopolitical stability
Haworth faces exposure from regional unrest and logistics chokepoints such as the Suez Canal (about 12% of global trade transits), prompting multi-sourcing across Asia and Eastern Europe and contingency inventory near key markets. China retains capital controls and FX reserves near $3.2 trillion (end-2024), affecting repatriation timing; Haworth emphasizes trade-credit insurance and FX hedges to protect margins and cash flow.
Industrial policy
Industrial policy materially affects Haworth: US infrastructure law (IIJA) channels about 1.2 trillion USD and the Inflation Reduction Act directs roughly 369 billion USD toward clean energy, while the CHIPS Act provides ~52 billion USD for domestic advanced manufacturing, creating demand for adaptable interiors and office retrofits; tax credits for energy-efficient facilities and federal R&D credits lower capex, but subsidies often carry domestic-content and reporting compliance obligations.
- Manufacturing incentives: IIJA 1.2T, CHIPS 52B, IRA ~369B
- Tax credits: energy-efficiency + federal R&D credit
- Demand: infrastructure-driven retrofit/office fit-outs
- Risk: subsidy-linked domestic content/compliance
Standards diplomacy
International standards bodies and national regulations—EN standards across the EU, BIFMA/NFPA-influenced frameworks in the US, and heterogeneous GB/national standards in APAC—shape furniture, fire-safety and ergonomic norms; manufacturers must secure market-specific certifications and monitor regional divergence to sell into 27 EU states, US federal/state jurisdictions, and diverse APAC regimes. Participation in standards consultations can shift technical requirements and reduce compliance costs.
- EN vs BIFMA/NFPA vs GB/national
- Certify per market before entry
- Engage in policy consultations
Political shocks reshape supply chains: tariffs, subsidies, chokepoints drive regionalization
Political risks—tariffs (US Sec232: steel 25%, alu 10%; Sec301 up to 25%) and procurement rules (public procurement ~12% GDP) raise costs and shape sourcing; IIJA, IRA, CHIPS (IIJA 1.2T, IRA ~369B, CHIPS ~52B) create retrofit/domestic-manufacturing demand but carry domestic-content conditions; export controls, FX reserves (~3.2T China end-2024) and chokepoints (Suez ~12% trade) drive regionalization and hedging.
| Factor | Metric | Impact |
|---|---|---|
| Tariffs | 25%/10%/up to25% | Higher input costs |
| Industrial policy | IIJA 1.2T; IRA 369B; CHIPS 52B | Demand + domestic rules |
| Logistics | Suez ~12% trade | Supply risk |
What is included in the product
Detailed Word Document
Explores how macro-environmental factors uniquely affect Haworth across Political, Economic, Social, Technological, Environmental and Legal dimensions, with data-backed trends and forward-looking insights that reflect market and regulatory dynamics to help executives, consultants and entrepreneurs identify threats, opportunities and scenario-driven strategies.
Customizable Excel Spreadsheet
A concise, visually segmented PESTLE summary of Haworth for quick reference in meetings or presentations, easily dropped into slides or shared across teams; editable notes let users adapt insights to local markets, regions, or specific business lines for faster alignment and decision-making.
Economic factors
Demand cycles
Demand for Haworth products tracks macro growth — IMF projected global GDP growth 3.0% in 2024 — and corporate capex cycles; CBRE/JLL reported office vacancy elevated in 2024, pressuring new-build spend while boosting reconfiguration demand. Healthcare, education and government remain more resilient with steadier procurement versus cyclical corporate clients. Hybrid work shifts spending toward reconfiguration and flexible furniture over new-builds, increasing emphasis on near-term pipeline visibility and backlog quality to manage margin timing.
Input inflation
Track commodity shifts: LME copper near $9,500/ton and Brent around $85/bbl in H1 2025, with global container rates (Drewry WCI) roughly $1,500/FEU, plus persistent foam and fabric cost inflation from 2024–25. Analyze pass-through capacity and quarterly pricing cadence to protect margins. Use long-term supplier contracts and design-to-cost to stabilize gross margin. Monitor supplier financial health and lead-time KPIs to avoid disruptions.
FX volatility
Measure currency exposures across production, sourcing and sales regions, noting Haworth’s mix of North American production vs 30–40% sales in EMEA/APAC; track transaction vs translation effects and quantify in P&L lines. Maintain documented hedging policies and exploit natural offsets (local sourcing, local invoicing) to reduce transaction volatility. Consider pricing localization and invoicing currencies to protect margins. Monitor FX backdrop: DXY averaged about 104 in 2024, affecting translation/transaction impacts on earnings.
Labor markets
- tags: skilled-talent, wage-pressure, productivity, automation-ROI, upskilling, regional-competition
Credit conditions
Rising benchmark borrowing costs (US federal funds target 5.25–5.50% as of June 2025) tighten customer financing for fit-outs and slow developer project starts, while leasing shows longer payment schedules and more concessions across North American and EMEA markets; Haworth must preserve balance sheet flexibility for working capital and capex and monitor customer credit risk and receivables quality closely.
- Interest rates: US 5.25–5.50% (Jun 2025)
- Leasing: longer terms, higher concessions
- Balance sheet: prioritize liquidity for capex/WC
- Credit risk: tighten receivables monitoring
Political shocks reshape supply chains: tariffs, subsidies, chokepoints drive regionalization
Demand follows IMF 2024 GDP 3.0%; elevated office vacancy cuts new-builds but lifts reconfiguration; healthcare/education stay resilient. Input costs: LME copper ~$9,500/t, Brent ~$85/bbl (H1 2025) and Drewry WCI ~$1,500/FEU—pricing pass-through and contracts vital. DXY ~104 (2024) and US rates 5.25–5.50% (Jun 2025) raise FX and financing risk; prioritize hedging and liquidity.
| Metric | Value |
|---|---|
| Global GDP (IMF 2024) | 3.0% |
| LME copper (H1 2025) | $9,500/t |
| Brent (H1 2025) | $85/bbl |
| DXY (2024) | ~104 |
| US rates (Jun 2025) | 5.25–5.50% |
Preview Before You Purchase
Haworth PESTLE Analysis
This Haworth PESTLE Analysis provides a concise, professionally structured review of political, economic, social, technological, legal and environmental factors affecting Haworth. The preview shown here is the exact document you’ll receive after purchase—fully formatted and ready to use. Immediate download after payment; no placeholders, just the final file.











