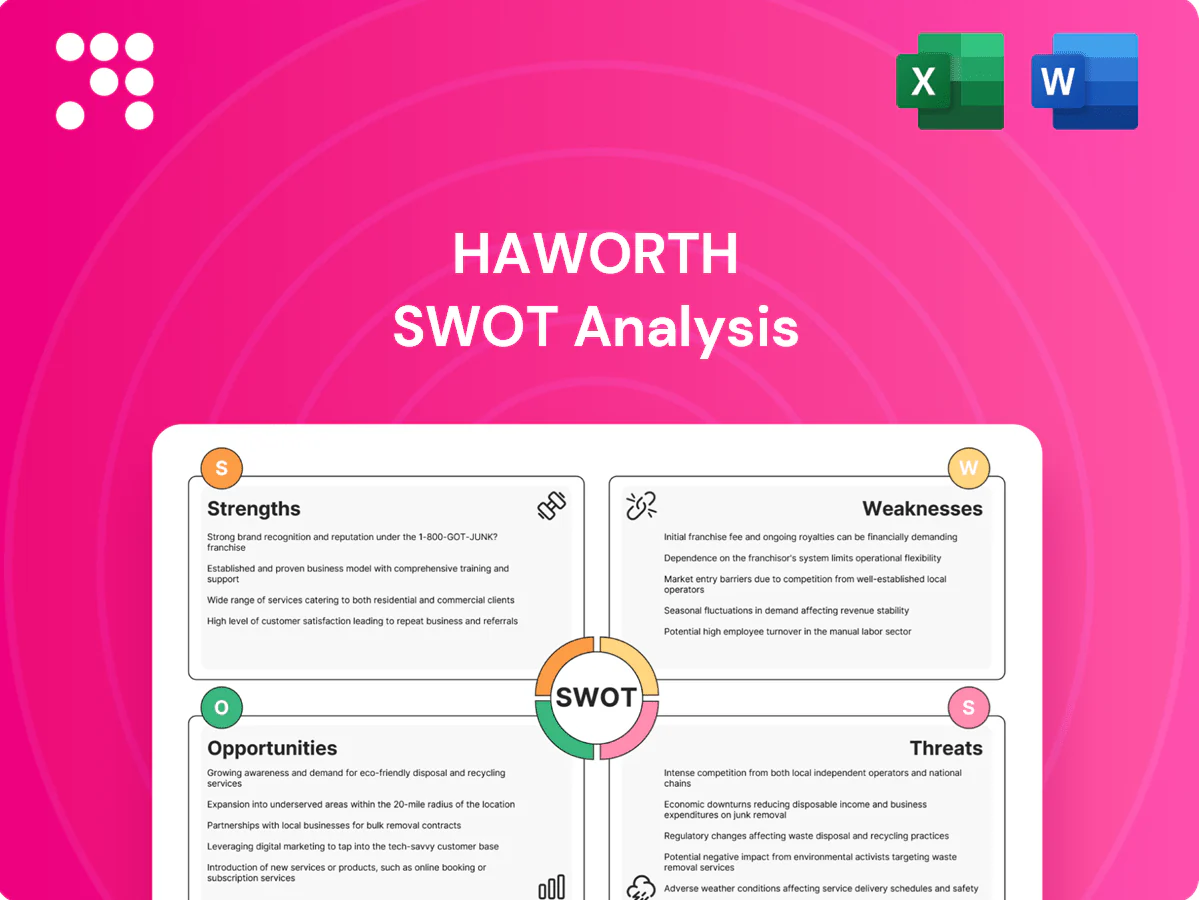
Haworth SWOT Analysis

Make Insightful Decisions Backed by Expert Research
Haworth’s SWOT reveals resilient product-design strengths, global supply-chain expertise, and sustainability-driven growth opportunities, alongside competitive pressures and margin risks. Want the full story behind these drivers and threats? Purchase the complete SWOT analysis to get a professionally formatted, editable Word report plus an Excel matrix for strategy, pitching, and investment planning.
Strengths

Global adaptable workspace portfolio
Haworth’s global, adaptable workspace portfolio—rooted in a company founded in 1948—covers systems furniture, seating, storage and architectural interiors, reducing vendor complexity and increasing share of wallet; its adaptability matches hybrid work trends and supports corporate, healthcare, education and government sectors worldwide.
Design and innovation leadership
Haworth emphasizes innovative design that boosts employee well‑being and productivity, leveraging ergonomics, premium materials and modular systems to sustain a premium market position. Strong R&D and design partnerships enable rapid collection refreshes and trend responsiveness. Founded in 1948, Haworth sells through over 700 dealers in 120 countries, which strengthens brand equity and pricing resilience.

Sustainability embedded in operations
Sustainability embedded across sourcing, manufacturing and product lifecycle positions Haworth to meet growing ESG demand, with sustainable investing assets exceeding $35 trillion globally in 2023. Certifications and circularity initiatives improve eligibility for enterprise and government work, with public procurement representing roughly 14% of GDP in many markets. Lower environmental impact reduces regulatory and supply risks while improving long‑term cost efficiency and specification‑market reputation.

Diversified sector exposure
Haworth’s presence across corporate, healthcare, education and government smooths revenue cycles by balancing private-sector volatility with countercyclical public and institutional spending; the company operates in 120+ countries. US health spending is about 18% of GDP, supporting steady institutional demand, while multi‑year government projects boost planning visibility and utilization, stabilizing revenue and capacity.
- Sector mix: corporate, healthcare, education, government
- Geographic reach: 120+ countries
- Healthcare stability: ~18% of US GDP (health spending)
- Government: multi-year contracts improve visibility
Architectural interiors capability
Haworth's architectural interiors capability—moveable walls and integrated interior systems—creates recurring retrofit opportunities beyond periodic furniture refreshes, embedding the company earlier in design specifications and increasing pull-through for seating and storage portfolios. The solution-centric approach raises client switching costs by tying space planning, finishes and furniture into a single ecosystem.
- Retrofit revenue stream
- Earlier design engagement
- Cross-sell: seating & storage
- Higher client retention
Modular interiors: 700+ dealers, 120+ countries, ESG focus
Haworth, founded 1948, leverages a global portfolio—systems furniture, seating, storage, interiors—sold via 700+ dealers in 120+ countries, aligning with hybrid-work demand. Strong R&D and modular design drive premium pricing and fast refresh cycles; sustainability and circularity meet ESG procurement rules. Sector mix (corporate, healthcare, education, government) stabilizes revenue versus cycles.
| Metric | Value |
|---|---|
| Dealers | 700+ |
| Countries | 120+ |
| Founded | 1948 |
| US health spend | ~18% GDP (2023) |
What is included in the product
 Detailed Word Document
Provides a concise SWOT analysis of Haworth's internal capabilities and external market conditions, outlining strengths, weaknesses, opportunities, and threats to inform strategic decision-making and competitive positioning.

 Customizable Excel Spreadsheet
Provides a concise, executive-ready SWOT matrix for Haworth to quickly identify strategic strengths, weaknesses, opportunities and threats, enabling faster decision-making and stakeholder alignment.
Weaknesses

Exposure to macro capex cycles
Office fit-outs and large capex projects are highly discretionary and cyclical, exposing Haworth to demand swings as US office vacancy rose to about 16% in 2024 (CBRE). Slowdowns in commercial real estate and enterprise budgets can delay orders, creating revenue lumpiness; typical fit-out lead times of 6–12 months and concentrated backlogs further magnify volatility and complicate inventory planning.
Complex global supply chain
Haworth’s multi-category manufacturing across North America, EMEA, APAC and LATAM raises logistics and supplier risk, with 2021–22 component shortages driving lead-times up roughly 30% and causing cost variability. Complex component dependencies create bottlenecks and margin pressure, and maintaining quality/delivery consistency ties up significant working capital. Currency swings (USD strength post-2021) further compress margins on imported inputs.

Premium pricing vs low-cost rivals
Design and sustainability differentiation command price premiums, but the global office furniture market—estimated at about $61.6 billion in 2023—is increasingly price-competitive, pushing cost-sensitive buyers toward value brands. In commoditized categories clients often trade down, and aggressive discounting in public bids has eroded margins by double-digit percentage points for some suppliers. Price realization for Haworth depends on retaining spec influence and proving ROI through lifecycle and sustainability metrics.

Project-based sales concentration
Project-based sales concentrate Haworth's revenue into large enterprise deals, creating win/lose quarter dynamics and amplifying volatility; lengthy project sales cycles and specification-driven A&D approvals increase forecasting risk. Dependence on dealer execution and post-award change orders, plus site constraints, frequently compress margins and extend cash conversion timelines.
- Deal concentration → quarter volatility
- Long sales cycles → forecast risk
- A&D & dealer dependency → execution variability
- Change orders/site limits → margin compression
Integration and customization complexity
Highly modular Haworth solutions demand precise planning and installation expertise, raising project management burden; Haworth serves customers in over 120 countries and reports annual revenue above $1 billion, amplifying exposure. Custom finishes and configurations increase production complexity and unit costs; mistakes cause rework, schedule delays and warranty claims, while scaling bespoke projects strains operational efficiency.
- Planning: high installation expertise required
- Cost: customization raises unit production costs
- Risk: errors → rework, delays, warranty exposure
- Scale: bespoke projects impair operational efficiency
Fit-out business hit by office vacancy, supply lead-time spikes and margin pressure
Haworth faces demand cyclicality as US office vacancy hit ~16% in 2024 (CBRE) and fit-outs (6–12 month lead times) drive revenue lumpiness; project concentration creates win/lose quarters. Global supply complexity—2021–22 shortages lengthened lead times ~30%—raises costs and working capital needs. Price competition in a $61.6B market (2023) pressures margins; revenue >$1B amplifies scale risk.
| Metric | Value |
|---|---|
| US office vacancy (2024) | ~16% (CBRE) |
| Global market (2023) | $61.6B |
| Lead-time increase (2021–22) | ~30% |
| Haworth revenue | >$1B |
Preview the Actual Deliverable
Haworth SWOT Analysis
This is the actual SWOT analysis document you’ll receive upon purchase—no surprises, just professional quality. The preview below is taken directly from the full SWOT report you'll get, and purchase unlocks the complete, editable version. You’re viewing a live preview of the same file; the full report is available immediately after checkout.

Make Insightful Decisions Backed by Expert Research
Haworth’s SWOT reveals resilient product-design strengths, global supply-chain expertise, and sustainability-driven growth opportunities, alongside competitive pressures and margin risks. Want the full story behind these drivers and threats? Purchase the complete SWOT analysis to get a professionally formatted, editable Word report plus an Excel matrix for strategy, pitching, and investment planning.
Strengths
Global adaptable workspace portfolio
Haworth’s global, adaptable workspace portfolio—rooted in a company founded in 1948—covers systems furniture, seating, storage and architectural interiors, reducing vendor complexity and increasing share of wallet; its adaptability matches hybrid work trends and supports corporate, healthcare, education and government sectors worldwide.
Design and innovation leadership
Haworth emphasizes innovative design that boosts employee well‑being and productivity, leveraging ergonomics, premium materials and modular systems to sustain a premium market position. Strong R&D and design partnerships enable rapid collection refreshes and trend responsiveness. Founded in 1948, Haworth sells through over 700 dealers in 120 countries, which strengthens brand equity and pricing resilience.
Sustainability embedded in operations
Sustainability embedded across sourcing, manufacturing and product lifecycle positions Haworth to meet growing ESG demand, with sustainable investing assets exceeding $35 trillion globally in 2023. Certifications and circularity initiatives improve eligibility for enterprise and government work, with public procurement representing roughly 14% of GDP in many markets. Lower environmental impact reduces regulatory and supply risks while improving long‑term cost efficiency and specification‑market reputation.
Diversified sector exposure
Haworth’s presence across corporate, healthcare, education and government smooths revenue cycles by balancing private-sector volatility with countercyclical public and institutional spending; the company operates in 120+ countries. US health spending is about 18% of GDP, supporting steady institutional demand, while multi‑year government projects boost planning visibility and utilization, stabilizing revenue and capacity.
- Sector mix: corporate, healthcare, education, government
- Geographic reach: 120+ countries
- Healthcare stability: ~18% of US GDP (health spending)
- Government: multi-year contracts improve visibility
Architectural interiors capability
Haworth's architectural interiors capability—moveable walls and integrated interior systems—creates recurring retrofit opportunities beyond periodic furniture refreshes, embedding the company earlier in design specifications and increasing pull-through for seating and storage portfolios. The solution-centric approach raises client switching costs by tying space planning, finishes and furniture into a single ecosystem.
- Retrofit revenue stream
- Earlier design engagement
- Cross-sell: seating & storage
- Higher client retention
Modular interiors: 700+ dealers, 120+ countries, ESG focus
Haworth, founded 1948, leverages a global portfolio—systems furniture, seating, storage, interiors—sold via 700+ dealers in 120+ countries, aligning with hybrid-work demand. Strong R&D and modular design drive premium pricing and fast refresh cycles; sustainability and circularity meet ESG procurement rules. Sector mix (corporate, healthcare, education, government) stabilizes revenue versus cycles.
| Metric | Value |
|---|---|
| Dealers | 700+ |
| Countries | 120+ |
| Founded | 1948 |
| US health spend | ~18% GDP (2023) |
What is included in the product
Detailed Word Document
Provides a concise SWOT analysis of Haworth's internal capabilities and external market conditions, outlining strengths, weaknesses, opportunities, and threats to inform strategic decision-making and competitive positioning.
Customizable Excel Spreadsheet
Provides a concise, executive-ready SWOT matrix for Haworth to quickly identify strategic strengths, weaknesses, opportunities and threats, enabling faster decision-making and stakeholder alignment.
Weaknesses
Exposure to macro capex cycles
Office fit-outs and large capex projects are highly discretionary and cyclical, exposing Haworth to demand swings as US office vacancy rose to about 16% in 2024 (CBRE). Slowdowns in commercial real estate and enterprise budgets can delay orders, creating revenue lumpiness; typical fit-out lead times of 6–12 months and concentrated backlogs further magnify volatility and complicate inventory planning.
Complex global supply chain
Haworth’s multi-category manufacturing across North America, EMEA, APAC and LATAM raises logistics and supplier risk, with 2021–22 component shortages driving lead-times up roughly 30% and causing cost variability. Complex component dependencies create bottlenecks and margin pressure, and maintaining quality/delivery consistency ties up significant working capital. Currency swings (USD strength post-2021) further compress margins on imported inputs.
Premium pricing vs low-cost rivals
Design and sustainability differentiation command price premiums, but the global office furniture market—estimated at about $61.6 billion in 2023—is increasingly price-competitive, pushing cost-sensitive buyers toward value brands. In commoditized categories clients often trade down, and aggressive discounting in public bids has eroded margins by double-digit percentage points for some suppliers. Price realization for Haworth depends on retaining spec influence and proving ROI through lifecycle and sustainability metrics.
Project-based sales concentration
Project-based sales concentrate Haworth's revenue into large enterprise deals, creating win/lose quarter dynamics and amplifying volatility; lengthy project sales cycles and specification-driven A&D approvals increase forecasting risk. Dependence on dealer execution and post-award change orders, plus site constraints, frequently compress margins and extend cash conversion timelines.
- Deal concentration → quarter volatility
- Long sales cycles → forecast risk
- A&D & dealer dependency → execution variability
- Change orders/site limits → margin compression
Integration and customization complexity
Highly modular Haworth solutions demand precise planning and installation expertise, raising project management burden; Haworth serves customers in over 120 countries and reports annual revenue above $1 billion, amplifying exposure. Custom finishes and configurations increase production complexity and unit costs; mistakes cause rework, schedule delays and warranty claims, while scaling bespoke projects strains operational efficiency.
- Planning: high installation expertise required
- Cost: customization raises unit production costs
- Risk: errors → rework, delays, warranty exposure
- Scale: bespoke projects impair operational efficiency
Fit-out business hit by office vacancy, supply lead-time spikes and margin pressure
Haworth faces demand cyclicality as US office vacancy hit ~16% in 2024 (CBRE) and fit-outs (6–12 month lead times) drive revenue lumpiness; project concentration creates win/lose quarters. Global supply complexity—2021–22 shortages lengthened lead times ~30%—raises costs and working capital needs. Price competition in a $61.6B market (2023) pressures margins; revenue >$1B amplifies scale risk.
| Metric | Value |
|---|---|
| US office vacancy (2024) | ~16% (CBRE) |
| Global market (2023) | $61.6B |
| Lead-time increase (2021–22) | ~30% |
| Haworth revenue | >$1B |
Preview the Actual Deliverable
Haworth SWOT Analysis
This is the actual SWOT analysis document you’ll receive upon purchase—no surprises, just professional quality. The preview below is taken directly from the full SWOT report you'll get, and purchase unlocks the complete, editable version. You’re viewing a live preview of the same file; the full report is available immediately after checkout.
Original: $10.00
-65%$10.00
$3.50Description
Make Insightful Decisions Backed by Expert Research
Haworth’s SWOT reveals resilient product-design strengths, global supply-chain expertise, and sustainability-driven growth opportunities, alongside competitive pressures and margin risks. Want the full story behind these drivers and threats? Purchase the complete SWOT analysis to get a professionally formatted, editable Word report plus an Excel matrix for strategy, pitching, and investment planning.
Strengths
Global adaptable workspace portfolio
Haworth’s global, adaptable workspace portfolio—rooted in a company founded in 1948—covers systems furniture, seating, storage and architectural interiors, reducing vendor complexity and increasing share of wallet; its adaptability matches hybrid work trends and supports corporate, healthcare, education and government sectors worldwide.
Design and innovation leadership
Haworth emphasizes innovative design that boosts employee well‑being and productivity, leveraging ergonomics, premium materials and modular systems to sustain a premium market position. Strong R&D and design partnerships enable rapid collection refreshes and trend responsiveness. Founded in 1948, Haworth sells through over 700 dealers in 120 countries, which strengthens brand equity and pricing resilience.
Sustainability embedded in operations
Sustainability embedded across sourcing, manufacturing and product lifecycle positions Haworth to meet growing ESG demand, with sustainable investing assets exceeding $35 trillion globally in 2023. Certifications and circularity initiatives improve eligibility for enterprise and government work, with public procurement representing roughly 14% of GDP in many markets. Lower environmental impact reduces regulatory and supply risks while improving long‑term cost efficiency and specification‑market reputation.
Diversified sector exposure
Haworth’s presence across corporate, healthcare, education and government smooths revenue cycles by balancing private-sector volatility with countercyclical public and institutional spending; the company operates in 120+ countries. US health spending is about 18% of GDP, supporting steady institutional demand, while multi‑year government projects boost planning visibility and utilization, stabilizing revenue and capacity.
- Sector mix: corporate, healthcare, education, government
- Geographic reach: 120+ countries
- Healthcare stability: ~18% of US GDP (health spending)
- Government: multi-year contracts improve visibility
Architectural interiors capability
Haworth's architectural interiors capability—moveable walls and integrated interior systems—creates recurring retrofit opportunities beyond periodic furniture refreshes, embedding the company earlier in design specifications and increasing pull-through for seating and storage portfolios. The solution-centric approach raises client switching costs by tying space planning, finishes and furniture into a single ecosystem.
- Retrofit revenue stream
- Earlier design engagement
- Cross-sell: seating & storage
- Higher client retention
Modular interiors: 700+ dealers, 120+ countries, ESG focus
Haworth, founded 1948, leverages a global portfolio—systems furniture, seating, storage, interiors—sold via 700+ dealers in 120+ countries, aligning with hybrid-work demand. Strong R&D and modular design drive premium pricing and fast refresh cycles; sustainability and circularity meet ESG procurement rules. Sector mix (corporate, healthcare, education, government) stabilizes revenue versus cycles.
| Metric | Value |
|---|---|
| Dealers | 700+ |
| Countries | 120+ |
| Founded | 1948 |
| US health spend | ~18% GDP (2023) |
What is included in the product
Detailed Word Document
Provides a concise SWOT analysis of Haworth's internal capabilities and external market conditions, outlining strengths, weaknesses, opportunities, and threats to inform strategic decision-making and competitive positioning.
Customizable Excel Spreadsheet
Provides a concise, executive-ready SWOT matrix for Haworth to quickly identify strategic strengths, weaknesses, opportunities and threats, enabling faster decision-making and stakeholder alignment.
Weaknesses
Exposure to macro capex cycles
Office fit-outs and large capex projects are highly discretionary and cyclical, exposing Haworth to demand swings as US office vacancy rose to about 16% in 2024 (CBRE). Slowdowns in commercial real estate and enterprise budgets can delay orders, creating revenue lumpiness; typical fit-out lead times of 6–12 months and concentrated backlogs further magnify volatility and complicate inventory planning.
Complex global supply chain
Haworth’s multi-category manufacturing across North America, EMEA, APAC and LATAM raises logistics and supplier risk, with 2021–22 component shortages driving lead-times up roughly 30% and causing cost variability. Complex component dependencies create bottlenecks and margin pressure, and maintaining quality/delivery consistency ties up significant working capital. Currency swings (USD strength post-2021) further compress margins on imported inputs.
Premium pricing vs low-cost rivals
Design and sustainability differentiation command price premiums, but the global office furniture market—estimated at about $61.6 billion in 2023—is increasingly price-competitive, pushing cost-sensitive buyers toward value brands. In commoditized categories clients often trade down, and aggressive discounting in public bids has eroded margins by double-digit percentage points for some suppliers. Price realization for Haworth depends on retaining spec influence and proving ROI through lifecycle and sustainability metrics.
Project-based sales concentration
Project-based sales concentrate Haworth's revenue into large enterprise deals, creating win/lose quarter dynamics and amplifying volatility; lengthy project sales cycles and specification-driven A&D approvals increase forecasting risk. Dependence on dealer execution and post-award change orders, plus site constraints, frequently compress margins and extend cash conversion timelines.
- Deal concentration → quarter volatility
- Long sales cycles → forecast risk
- A&D & dealer dependency → execution variability
- Change orders/site limits → margin compression
Integration and customization complexity
Highly modular Haworth solutions demand precise planning and installation expertise, raising project management burden; Haworth serves customers in over 120 countries and reports annual revenue above $1 billion, amplifying exposure. Custom finishes and configurations increase production complexity and unit costs; mistakes cause rework, schedule delays and warranty claims, while scaling bespoke projects strains operational efficiency.
- Planning: high installation expertise required
- Cost: customization raises unit production costs
- Risk: errors → rework, delays, warranty exposure
- Scale: bespoke projects impair operational efficiency
Fit-out business hit by office vacancy, supply lead-time spikes and margin pressure
Haworth faces demand cyclicality as US office vacancy hit ~16% in 2024 (CBRE) and fit-outs (6–12 month lead times) drive revenue lumpiness; project concentration creates win/lose quarters. Global supply complexity—2021–22 shortages lengthened lead times ~30%—raises costs and working capital needs. Price competition in a $61.6B market (2023) pressures margins; revenue >$1B amplifies scale risk.
| Metric | Value |
|---|---|
| US office vacancy (2024) | ~16% (CBRE) |
| Global market (2023) | $61.6B |
| Lead-time increase (2021–22) | ~30% |
| Haworth revenue | >$1B |
Preview the Actual Deliverable
Haworth SWOT Analysis
This is the actual SWOT analysis document you’ll receive upon purchase—no surprises, just professional quality. The preview below is taken directly from the full SWOT report you'll get, and purchase unlocks the complete, editable version. You’re viewing a live preview of the same file; the full report is available immediately after checkout.











