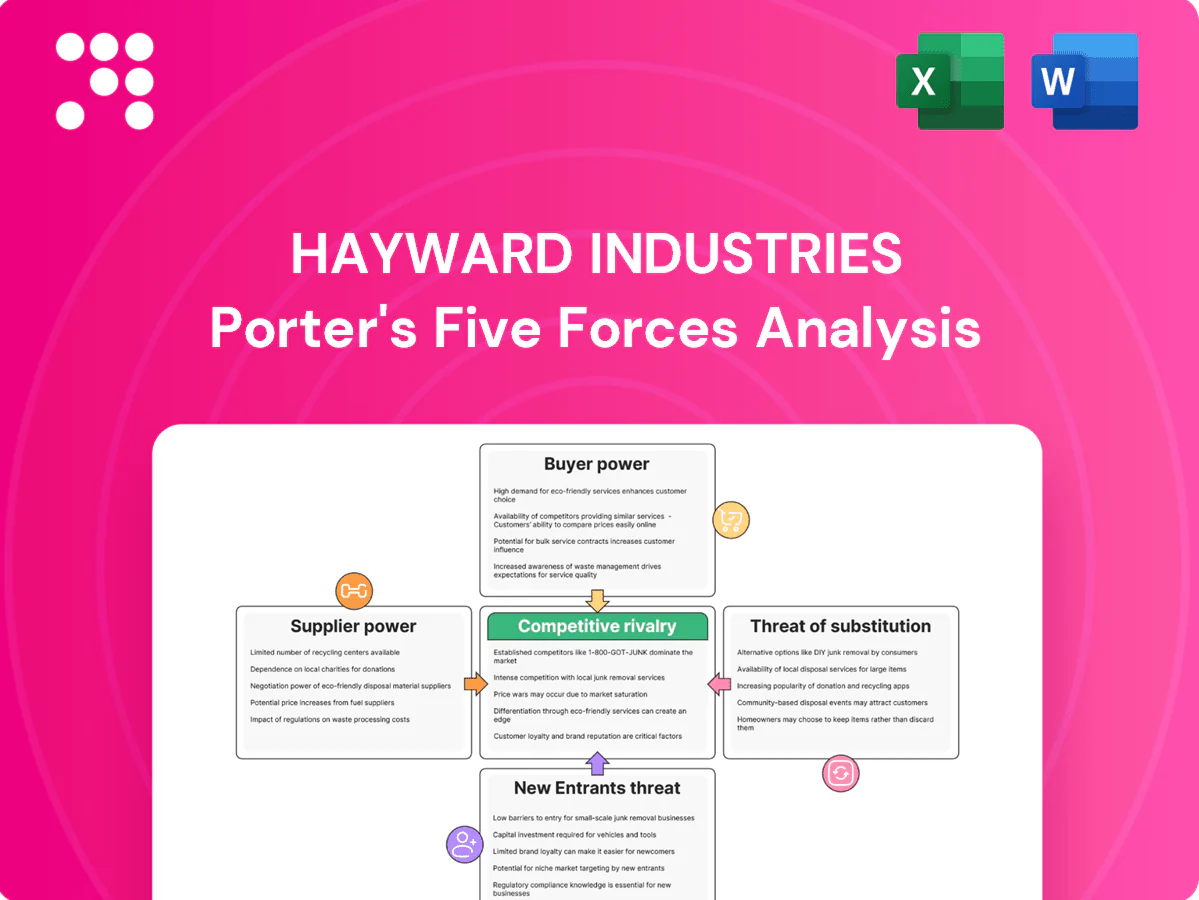
Hayward Industries Porter's Five Forces Analysis

Go Beyond the Preview—Access the Full Strategic Report
Hayward Industries faces moderate competitive intensity driven by consolidated rivals and steady demand for pool equipment, while supplier power is tempered by diversified component sourcing and scale advantages. Threats from substitutes and new entrants remain low due to brand strength and distribution networks, though technological shifts pose emerging risks. This brief snapshot only scratches the surface; unlock the full Porter's Five Forces Analysis for force-by-force ratings and strategic guidance.
Suppliers Bargaining Power

Concentrated critical components
Motors, electronics and specialty resins for Hayward come from relatively concentrated global suppliers, giving suppliers leverage on pricing and lead times and making semiconductor and motor cores potential bottlenecks in tight cycles.
The Semiconductor Industry Association reported global chip sales of $527.2 billion in 2023, with supply constraints persisting into 2024, amplifying risk for pool-equipment OEMs.
Hayward mitigates via multi-sourcing and inventory planning, but long qualification cycles (often many months) keep dependence on proven vendors and allow supply shocks to ripple through.
Commodity input volatility
Metals, plastics and freight inputs swung widely—container freight rates fell about 60% from 2021 peaks into 2024 while steel and resin prices experienced episodic 10–30% moves, pressuring margins. Suppliers rapidly impose surcharges, yet product pricing lags, creating margin squeeze for Hayward. Hedging and value-engineering blunt but do not eliminate spikes; scale purchasing reduces costs but volatility keeps supplier power episodically high.

Switching and qualification costs
Safety, performance, and certifications such as NSF/ANSI 50 or UL often require 6–12 months and $10,000–$50,000 to requalify new suppliers, making switches costly and slow. Tooling and injection molds for pumps and filters typically run $50,000–$300,000, locking relationships. This elevates supplier power for key parts even when alternates exist. Dual-qualification lowers disruption risk but commonly adds about 5% overhead.

Technology and IP in components
Variable-speed drives, sensors and controls often embed supplier firmware and IP, increasing vendor lock-in and pricing power when proprietary modules are used; co-development agreements with suppliers can rebalance influence but create mutual dependence. Design-for-dual-source and open-interface standards reduce supplier leverage and enable competitive sourcing.
- Vendor lock-in
- Co-development mutual dependence
- Dual-source design
Logistics and regional risk
Global supply chains expose Hayward to port congestion (LA/Long Beach peaked at >100 vessel queues in 2021), geopolitical risk and rising compliance costs after 2022–23 trade restrictions; nearshore suppliers commanded premiums (up to ~20% in some sectors) during disruptions. Inventory buffers (commonly 40–60 days in capital goods) reduce exposure but tie up working capital; preferred logistics partners gain seasonal leverage.
- Port congestion: LA peak >100 vessels
- Nearshore premium: ~20%
- Inventory buffer: 40–60 days
- Logistics partners: higher bargaining power in peak season
Supplier concentration raises bargaining power amid $527.2B chip shortages
Supplier base concentrated for motors, semiconductors and resins, giving episodic pricing and lead-time leverage; semiconductor sales were $527.2B in 2023 with constraints into 2024.
Qualification costs $10k–$50k and tooling $50k–$300k lock in vendors; dual-qualification adds ~5% overhead.
Freight and nearshore premia (up to ~20%) plus 40–60 day inventory buffers raise supplier bargaining power during shocks.
| Metric | Value | Near-term impact |
|---|---|---|
| Chip market | $527.2B (2023) | Supply risk |
| Qualification | $10k–$50k | Switching cost |
| Tooling | $50k–$300k | Vendor lock |
| Inventory | 40–60 days | Working capital |
What is included in the product
 Detailed Word Document
Uncovers key drivers of competition, customer influence, and market entry risks tailored to Hayward Industries, with detailed analysis of suppliers, buyers, substitutes, and new entrants.

 Customizable Excel Spreadsheet
A clear, one-sheet Porter's Five Forces summary for Hayward Industries—perfect for rapid decisions on pricing, supplier leverage, and competitive positioning to relieve strategic uncertainty.
Customers Bargaining Power

Fragmented yet informed buyers
Distributors, pool builders, service pros and homeowners form a fragmented buyer base that limits single-party leverage, even as Hayward reported roughly $1.1B in FY2023 revenue. Online reviews and published specs boost transparency, enabling easy price comparison across models. Buyers increasingly use energy-efficiency ratings and government/utility rebates to negotiate, while professional installers still prioritize reliability and after-sales service over lowest cost.
Channel concentration in distributors
Large distributors and builder networks aggregate demand—e.g., Home Depot and Lowe’s reported combined FY2024 sales of about $259 billion—letting them secure volume discounts and preferred-vendor status. Their control of shelf space and installer/spec lists shapes pool product mix and rollout timing. This concentration strengthens negotiating leverage over price, payment terms and returns. Co-op marketing and training investments frequently offset distributor demands and protect margins.

Aftermarket stickiness vs price sensitivity
Installed-base compatibility and transferable warranties for Hayward replacement parts materially reduce customer switching by preserving system performance and resale value. Homeowners remain price sensitive on commoditized consumables such as cleaners and lights, where low-margin alternatives compete. Bundled systems and Hayward app ecosystems raise switching costs through integration and data continuity. Seasonal promotions frequently tip buying decisions during peak pool months.

Performance and energy ROI focus
Hayward's variable-speed pumps and efficient heaters justify premium pricing via utility savings, with variable-speed technology reported to cut pool pump energy use 30–70% (industry sources, 2024). Buyers scrutinize lifecycle costs, warranties and service responsiveness; demonstrable ROI on high-efficiency SKUs (commonly 1–5 year payback reported) tempers buyer power. Poor service or warranty delays quickly erode this advantage, increasing buyer leverage.
- Energy savings: variable-speed pumps 30–70% (2024)
- Buyer focus: lifecycle cost, warranty, service
- ROI: 1–5 year payback commonly cited
- Risk: poor service amplifies buyer bargaining power
Seasonality and timing leverage
Seasonal peaks in spring and summer 2024 drive last-minute pool and HVAC project needs, letting buyers demand expedited delivery and favorable payment terms; conversely off-season promotions in late fall shift bargaining power back to Hayward by moving inventory and margins. Builders locking preseason purchases secure bulk discounts, while tight project deadlines make lead-time reliability often more valuable than price.
- Demand peaks → expedited-term leverage
- Off-season promos → manufacturer power
- Preseason buys → price discounts
- Lead-time reliability > price under deadlines
Fragmented buyers, retailer squeeze, installers value reliability; pumps save 30–70%
Customers are fragmented (distributors, pros, homeowners) limiting single-party leverage despite Hayward’s ~$1.1B FY2023 revenue. Large retailers (Home Depot+Lowe’s ~ $259B FY2024) exert strong price/terms pressure; installers value reliability over price. Efficiency (pumps save 30–70%) supports premium pricing and reduces buyer power.
| Metric | Value |
|---|---|
| Hayward revenue | $1.1B (FY2023) |
| Retailer sales | $259B combined (FY2024) |
| Pump energy saving | 30–70% (2024) |
Full Version Awaits
Hayward Industries Porter's Five Forces Analysis
You’re looking at the actual Hayward Industries Porter's Five Forces Analysis—this preview is the exact, fully formatted document you’ll receive after purchase. It contains a complete assessment of competitive rivalry, supplier and buyer power, threat of substitutes, and barriers to entry. No samples or placeholders—what you see is ready to download and use immediately. Purchase grants instant access to this identical file.

Go Beyond the Preview—Access the Full Strategic Report
Hayward Industries faces moderate competitive intensity driven by consolidated rivals and steady demand for pool equipment, while supplier power is tempered by diversified component sourcing and scale advantages. Threats from substitutes and new entrants remain low due to brand strength and distribution networks, though technological shifts pose emerging risks. This brief snapshot only scratches the surface; unlock the full Porter's Five Forces Analysis for force-by-force ratings and strategic guidance.
Suppliers Bargaining Power
Concentrated critical components
Motors, electronics and specialty resins for Hayward come from relatively concentrated global suppliers, giving suppliers leverage on pricing and lead times and making semiconductor and motor cores potential bottlenecks in tight cycles.
The Semiconductor Industry Association reported global chip sales of $527.2 billion in 2023, with supply constraints persisting into 2024, amplifying risk for pool-equipment OEMs.
Hayward mitigates via multi-sourcing and inventory planning, but long qualification cycles (often many months) keep dependence on proven vendors and allow supply shocks to ripple through.
Commodity input volatility
Metals, plastics and freight inputs swung widely—container freight rates fell about 60% from 2021 peaks into 2024 while steel and resin prices experienced episodic 10–30% moves, pressuring margins. Suppliers rapidly impose surcharges, yet product pricing lags, creating margin squeeze for Hayward. Hedging and value-engineering blunt but do not eliminate spikes; scale purchasing reduces costs but volatility keeps supplier power episodically high.
Switching and qualification costs
Safety, performance, and certifications such as NSF/ANSI 50 or UL often require 6–12 months and $10,000–$50,000 to requalify new suppliers, making switches costly and slow. Tooling and injection molds for pumps and filters typically run $50,000–$300,000, locking relationships. This elevates supplier power for key parts even when alternates exist. Dual-qualification lowers disruption risk but commonly adds about 5% overhead.
Technology and IP in components
Variable-speed drives, sensors and controls often embed supplier firmware and IP, increasing vendor lock-in and pricing power when proprietary modules are used; co-development agreements with suppliers can rebalance influence but create mutual dependence. Design-for-dual-source and open-interface standards reduce supplier leverage and enable competitive sourcing.
- Vendor lock-in
- Co-development mutual dependence
- Dual-source design
Logistics and regional risk
Global supply chains expose Hayward to port congestion (LA/Long Beach peaked at >100 vessel queues in 2021), geopolitical risk and rising compliance costs after 2022–23 trade restrictions; nearshore suppliers commanded premiums (up to ~20% in some sectors) during disruptions. Inventory buffers (commonly 40–60 days in capital goods) reduce exposure but tie up working capital; preferred logistics partners gain seasonal leverage.
- Port congestion: LA peak >100 vessels
- Nearshore premium: ~20%
- Inventory buffer: 40–60 days
- Logistics partners: higher bargaining power in peak season
Supplier concentration raises bargaining power amid $527.2B chip shortages
Supplier base concentrated for motors, semiconductors and resins, giving episodic pricing and lead-time leverage; semiconductor sales were $527.2B in 2023 with constraints into 2024.
Qualification costs $10k–$50k and tooling $50k–$300k lock in vendors; dual-qualification adds ~5% overhead.
Freight and nearshore premia (up to ~20%) plus 40–60 day inventory buffers raise supplier bargaining power during shocks.
| Metric | Value | Near-term impact |
|---|---|---|
| Chip market | $527.2B (2023) | Supply risk |
| Qualification | $10k–$50k | Switching cost |
| Tooling | $50k–$300k | Vendor lock |
| Inventory | 40–60 days | Working capital |
What is included in the product
Detailed Word Document
Uncovers key drivers of competition, customer influence, and market entry risks tailored to Hayward Industries, with detailed analysis of suppliers, buyers, substitutes, and new entrants.
Customizable Excel Spreadsheet
A clear, one-sheet Porter's Five Forces summary for Hayward Industries—perfect for rapid decisions on pricing, supplier leverage, and competitive positioning to relieve strategic uncertainty.
Customers Bargaining Power
Fragmented yet informed buyers
Distributors, pool builders, service pros and homeowners form a fragmented buyer base that limits single-party leverage, even as Hayward reported roughly $1.1B in FY2023 revenue. Online reviews and published specs boost transparency, enabling easy price comparison across models. Buyers increasingly use energy-efficiency ratings and government/utility rebates to negotiate, while professional installers still prioritize reliability and after-sales service over lowest cost.
Channel concentration in distributors
Large distributors and builder networks aggregate demand—e.g., Home Depot and Lowe’s reported combined FY2024 sales of about $259 billion—letting them secure volume discounts and preferred-vendor status. Their control of shelf space and installer/spec lists shapes pool product mix and rollout timing. This concentration strengthens negotiating leverage over price, payment terms and returns. Co-op marketing and training investments frequently offset distributor demands and protect margins.
Aftermarket stickiness vs price sensitivity
Installed-base compatibility and transferable warranties for Hayward replacement parts materially reduce customer switching by preserving system performance and resale value. Homeowners remain price sensitive on commoditized consumables such as cleaners and lights, where low-margin alternatives compete. Bundled systems and Hayward app ecosystems raise switching costs through integration and data continuity. Seasonal promotions frequently tip buying decisions during peak pool months.
Performance and energy ROI focus
Hayward's variable-speed pumps and efficient heaters justify premium pricing via utility savings, with variable-speed technology reported to cut pool pump energy use 30–70% (industry sources, 2024). Buyers scrutinize lifecycle costs, warranties and service responsiveness; demonstrable ROI on high-efficiency SKUs (commonly 1–5 year payback reported) tempers buyer power. Poor service or warranty delays quickly erode this advantage, increasing buyer leverage.
- Energy savings: variable-speed pumps 30–70% (2024)
- Buyer focus: lifecycle cost, warranty, service
- ROI: 1–5 year payback commonly cited
- Risk: poor service amplifies buyer bargaining power
Seasonality and timing leverage
Seasonal peaks in spring and summer 2024 drive last-minute pool and HVAC project needs, letting buyers demand expedited delivery and favorable payment terms; conversely off-season promotions in late fall shift bargaining power back to Hayward by moving inventory and margins. Builders locking preseason purchases secure bulk discounts, while tight project deadlines make lead-time reliability often more valuable than price.
- Demand peaks → expedited-term leverage
- Off-season promos → manufacturer power
- Preseason buys → price discounts
- Lead-time reliability > price under deadlines
Fragmented buyers, retailer squeeze, installers value reliability; pumps save 30–70%
Customers are fragmented (distributors, pros, homeowners) limiting single-party leverage despite Hayward’s ~$1.1B FY2023 revenue. Large retailers (Home Depot+Lowe’s ~ $259B FY2024) exert strong price/terms pressure; installers value reliability over price. Efficiency (pumps save 30–70%) supports premium pricing and reduces buyer power.
| Metric | Value |
|---|---|
| Hayward revenue | $1.1B (FY2023) |
| Retailer sales | $259B combined (FY2024) |
| Pump energy saving | 30–70% (2024) |
Full Version Awaits
Hayward Industries Porter's Five Forces Analysis
You’re looking at the actual Hayward Industries Porter's Five Forces Analysis—this preview is the exact, fully formatted document you’ll receive after purchase. It contains a complete assessment of competitive rivalry, supplier and buyer power, threat of substitutes, and barriers to entry. No samples or placeholders—what you see is ready to download and use immediately. Purchase grants instant access to this identical file.
Description
Go Beyond the Preview—Access the Full Strategic Report
Hayward Industries faces moderate competitive intensity driven by consolidated rivals and steady demand for pool equipment, while supplier power is tempered by diversified component sourcing and scale advantages. Threats from substitutes and new entrants remain low due to brand strength and distribution networks, though technological shifts pose emerging risks. This brief snapshot only scratches the surface; unlock the full Porter's Five Forces Analysis for force-by-force ratings and strategic guidance.
Suppliers Bargaining Power
Concentrated critical components
Motors, electronics and specialty resins for Hayward come from relatively concentrated global suppliers, giving suppliers leverage on pricing and lead times and making semiconductor and motor cores potential bottlenecks in tight cycles.
The Semiconductor Industry Association reported global chip sales of $527.2 billion in 2023, with supply constraints persisting into 2024, amplifying risk for pool-equipment OEMs.
Hayward mitigates via multi-sourcing and inventory planning, but long qualification cycles (often many months) keep dependence on proven vendors and allow supply shocks to ripple through.
Commodity input volatility
Metals, plastics and freight inputs swung widely—container freight rates fell about 60% from 2021 peaks into 2024 while steel and resin prices experienced episodic 10–30% moves, pressuring margins. Suppliers rapidly impose surcharges, yet product pricing lags, creating margin squeeze for Hayward. Hedging and value-engineering blunt but do not eliminate spikes; scale purchasing reduces costs but volatility keeps supplier power episodically high.
Switching and qualification costs
Safety, performance, and certifications such as NSF/ANSI 50 or UL often require 6–12 months and $10,000–$50,000 to requalify new suppliers, making switches costly and slow. Tooling and injection molds for pumps and filters typically run $50,000–$300,000, locking relationships. This elevates supplier power for key parts even when alternates exist. Dual-qualification lowers disruption risk but commonly adds about 5% overhead.
Technology and IP in components
Variable-speed drives, sensors and controls often embed supplier firmware and IP, increasing vendor lock-in and pricing power when proprietary modules are used; co-development agreements with suppliers can rebalance influence but create mutual dependence. Design-for-dual-source and open-interface standards reduce supplier leverage and enable competitive sourcing.
- Vendor lock-in
- Co-development mutual dependence
- Dual-source design
Logistics and regional risk
Global supply chains expose Hayward to port congestion (LA/Long Beach peaked at >100 vessel queues in 2021), geopolitical risk and rising compliance costs after 2022–23 trade restrictions; nearshore suppliers commanded premiums (up to ~20% in some sectors) during disruptions. Inventory buffers (commonly 40–60 days in capital goods) reduce exposure but tie up working capital; preferred logistics partners gain seasonal leverage.
- Port congestion: LA peak >100 vessels
- Nearshore premium: ~20%
- Inventory buffer: 40–60 days
- Logistics partners: higher bargaining power in peak season
Supplier concentration raises bargaining power amid $527.2B chip shortages
Supplier base concentrated for motors, semiconductors and resins, giving episodic pricing and lead-time leverage; semiconductor sales were $527.2B in 2023 with constraints into 2024.
Qualification costs $10k–$50k and tooling $50k–$300k lock in vendors; dual-qualification adds ~5% overhead.
Freight and nearshore premia (up to ~20%) plus 40–60 day inventory buffers raise supplier bargaining power during shocks.
| Metric | Value | Near-term impact |
|---|---|---|
| Chip market | $527.2B (2023) | Supply risk |
| Qualification | $10k–$50k | Switching cost |
| Tooling | $50k–$300k | Vendor lock |
| Inventory | 40–60 days | Working capital |
What is included in the product
Detailed Word Document
Uncovers key drivers of competition, customer influence, and market entry risks tailored to Hayward Industries, with detailed analysis of suppliers, buyers, substitutes, and new entrants.
Customizable Excel Spreadsheet
A clear, one-sheet Porter's Five Forces summary for Hayward Industries—perfect for rapid decisions on pricing, supplier leverage, and competitive positioning to relieve strategic uncertainty.
Customers Bargaining Power
Fragmented yet informed buyers
Distributors, pool builders, service pros and homeowners form a fragmented buyer base that limits single-party leverage, even as Hayward reported roughly $1.1B in FY2023 revenue. Online reviews and published specs boost transparency, enabling easy price comparison across models. Buyers increasingly use energy-efficiency ratings and government/utility rebates to negotiate, while professional installers still prioritize reliability and after-sales service over lowest cost.
Channel concentration in distributors
Large distributors and builder networks aggregate demand—e.g., Home Depot and Lowe’s reported combined FY2024 sales of about $259 billion—letting them secure volume discounts and preferred-vendor status. Their control of shelf space and installer/spec lists shapes pool product mix and rollout timing. This concentration strengthens negotiating leverage over price, payment terms and returns. Co-op marketing and training investments frequently offset distributor demands and protect margins.
Aftermarket stickiness vs price sensitivity
Installed-base compatibility and transferable warranties for Hayward replacement parts materially reduce customer switching by preserving system performance and resale value. Homeowners remain price sensitive on commoditized consumables such as cleaners and lights, where low-margin alternatives compete. Bundled systems and Hayward app ecosystems raise switching costs through integration and data continuity. Seasonal promotions frequently tip buying decisions during peak pool months.
Performance and energy ROI focus
Hayward's variable-speed pumps and efficient heaters justify premium pricing via utility savings, with variable-speed technology reported to cut pool pump energy use 30–70% (industry sources, 2024). Buyers scrutinize lifecycle costs, warranties and service responsiveness; demonstrable ROI on high-efficiency SKUs (commonly 1–5 year payback reported) tempers buyer power. Poor service or warranty delays quickly erode this advantage, increasing buyer leverage.
- Energy savings: variable-speed pumps 30–70% (2024)
- Buyer focus: lifecycle cost, warranty, service
- ROI: 1–5 year payback commonly cited
- Risk: poor service amplifies buyer bargaining power
Seasonality and timing leverage
Seasonal peaks in spring and summer 2024 drive last-minute pool and HVAC project needs, letting buyers demand expedited delivery and favorable payment terms; conversely off-season promotions in late fall shift bargaining power back to Hayward by moving inventory and margins. Builders locking preseason purchases secure bulk discounts, while tight project deadlines make lead-time reliability often more valuable than price.
- Demand peaks → expedited-term leverage
- Off-season promos → manufacturer power
- Preseason buys → price discounts
- Lead-time reliability > price under deadlines
Fragmented buyers, retailer squeeze, installers value reliability; pumps save 30–70%
Customers are fragmented (distributors, pros, homeowners) limiting single-party leverage despite Hayward’s ~$1.1B FY2023 revenue. Large retailers (Home Depot+Lowe’s ~ $259B FY2024) exert strong price/terms pressure; installers value reliability over price. Efficiency (pumps save 30–70%) supports premium pricing and reduces buyer power.
| Metric | Value |
|---|---|
| Hayward revenue | $1.1B (FY2023) |
| Retailer sales | $259B combined (FY2024) |
| Pump energy saving | 30–70% (2024) |
Full Version Awaits
Hayward Industries Porter's Five Forces Analysis
You’re looking at the actual Hayward Industries Porter's Five Forces Analysis—this preview is the exact, fully formatted document you’ll receive after purchase. It contains a complete assessment of competitive rivalry, supplier and buyer power, threat of substitutes, and barriers to entry. No samples or placeholders—what you see is ready to download and use immediately. Purchase grants instant access to this identical file.











