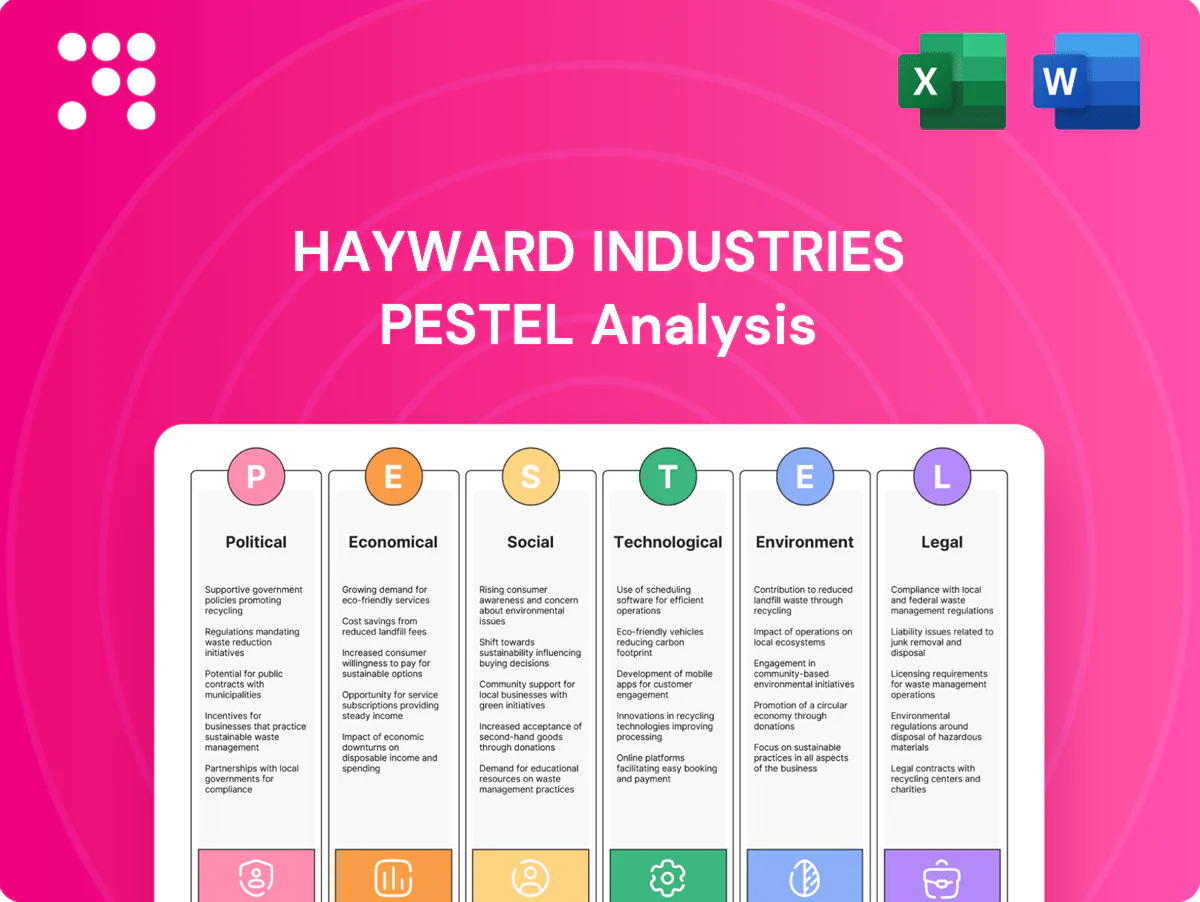
Hayward Industries PESTLE Analysis

Plan Smarter. Present Sharper. Compete Stronger.
Unlock the external forces shaping Hayward Industries with our concise PESTLE snapshot—covering regulatory risks, market shifts, tech trends, and environmental drivers that could impact growth and valuation; buy the full analysis for the complete, actionable breakdown ready for strategic use.
Political factors

Trade policy and tariffs
Import duties—notably US Section 301 tariffs of up to 25% on many China-origin goods—can materially raise Hayward’s BOM and compress pricing power. Shifts in US–China and EU trade relations lengthen lead times and constrain sourcing flexibility, exacerbated by export controls tightened in 2022–24 on advanced components. Proactive tariff engineering and multi-country sourcing reduce cost volatility and supply risk.
Energy and water policy priorities
National policies such as the Inflation Reduction Act and expanding state rebate programs in 2024 are accelerating uptake of variable-speed pumps and smart controls, with utility rebates frequently covering up to 50% of retrofit costs. Drought-driven water restrictions in parts of the US and Australia have slowed new pool builds but increased retrofit demand for efficiency upgrades. Public utility specifications now often mandate ENERGY STAR or equivalent performance, directly shaping Hayward Industries R&D priorities and marketing claims.

Public health and safety governance
Rules on recreational water safety and sanitation drive Hayward product features and certification needs, with the CDC estimating roughly 3.7 million recreational water-associated illnesses annually in the U.S., heightening demand for validated disinfection tech. Government guidance during health crises (COVID-19 era usage swings) can rapidly shift commercial pool demand and operating protocols. Compliance increases testing and certification costs but strengthens brand trust and liability protection. Formal alignment with public health agencies can open institutional procurement channels and retrofit contracts.

Infrastructure and housing agendas
Stimulus for housing and outdoor living—backed by the $1.2 trillion IIJA and continued 2024 housing support—bolsters new pool installations and drives bundled equipment sales as US housing starts run near 1.4M annualized (2024). Stricter building codes push demand for higher-efficiency pumps and heaters. Regional grants in 2024 favored local manufacturers, while political shifts risk funding continuity and planning certainty.
- Stimulus: $1.2T IIJA; 2024 housing starts ~1.4M
- Codes: higher-efficiency mandates raise ASPs
- Grants: 2024 regional awards favor local footprints
- Risk: political shifts threaten multi-year funding
Geopolitical supply chain risk
Instability in key supplier regions disrupts motors, chips and plastics, with semiconductor lead times remaining elevated (around 20+ weeks at peaks in 2021–23) and polymer feedstock price volatility raising procurement risk. Sanctions and chokepoints (Suez/Red Sea incidents, trade restrictions) extend lead times and push working capital needs higher; US CHIPS Act ($52 billion) and government partnerships can ease critical-component access. Diversification and nearshoring reduce exposure but typically increase unit costs.
- Supply disruption: motors/chips/plastics
- Chip lead times: ~20+ weeks (peaks 2021–23)
- Policy relief: CHIPS Act $52 billion
- Trade risk: sanctions & chokepoints raise WC
- Mitigation: nearshoring raises unit costs
Tariffs, supply shocks and US incentives reshape pump sourcing, costs, and demand
Trade barriers (US Section 301 tariffs up to 25%) and export controls raise BOM costs and sourcing lead times; nearshoring reduces risk but ups unit cost. US policies (IRA, IIJA $1.2T) plus 2024 rebates (up to 50%) accelerate efficient pump adoption, while housing starts (~1.4M in 2024) support demand. Supply shocks (chip lead times ~20+ weeks) and sanctions increase WC needs; CHIPS Act $52B eases parts access.
| Factor | Impact | 2024/25 Metric |
|---|---|---|
| Tariffs | Higher BOM/pricing pressure | Up to 25% (Section 301) |
| Policy stimulus | Demand for efficient retrofits | IIJA $1.2T; IRA rebates ≤50% |
| Housing | New pool installations | Starts ~1.4M (2024) |
| Supply | Lead-time & WC stress | Chip LT ~20+ weeks; CHIPS $52B |
What is included in the product
 Detailed Word Document
Explores how external macro-environmental factors uniquely affect Hayward Industries across Political, Economic, Social, Technological, Environmental and Legal dimensions, with data-driven insights and trend analysis. Designed to support executives and investors in identifying threats, opportunities and forward-looking scenarios specific to the pool equipment and controls sector.

 Customizable Excel Spreadsheet
Concise, visually segmented PESTLE summary of Hayward Industries that quickly surfaces external risks and opportunities for meetings or presentations, easily editable for regional or product-specific notes and instantly shareable across teams to streamline strategic alignment.
Economic factors

Housing cycle and construction
New pool installations track housing activity—U.S. housing starts averaged about 1.4 million units in 2024 and home-improvement spending topped roughly $450 billion, boosting first-fit equipment demand. During downturns sales mix shifts toward aftermarket replacement and service parts, raising margin-stable revenue share. Regional housing strength (Sun Belt outperformance) shapes distributor inventory and cadence. Forecasting relies on permits and builder backlogs, which ran about 3–5 months in 2024.
Consumer discretionary spending
Pool upgrades compete with other big-ticket purchases for household budgets; US median household income was $76,399 in 2023 (Census), constraining discretionary spend. Strong employment—unemployment near 3.7% mid-2025 (BLS)—and income gains support premium connected products. In slowdowns demand shifts to value tiers and deferred maintenance, and heightened promotions compress margins and strain channel relations.

Input costs and inflation
Resin (-≈20% from 2022 highs), copper (~US$9,000/tonne as of July 2025), steel (~US$800/tonne) and normalized freight (container rates down ≈70% from 2021 peaks) flow through Hayward Industries COGS and pricing cadence. Sticky inflation compresses margins if price realization lags, while cost deflation can reset market pricing and share dynamics. Active hedging and design-to-value programs stabilize profitability and protect gross margins.

FX and international mix
Currency swings have lowered reported international sales for Hayward, with a stronger US dollar in 2024 weighing on cross-border competitiveness and margins; Hayward reported roughly $1.1bn in net sales in FY2023, making FX movements material to top-line translation and pricing power. Localized production and regional pricing reduce FX pass-through risk, while distributors trimming orders to hedge currency exposure and EM volatility complicate demand planning.
- FX exposure: meaningful vs FY2023 $1.1bn sales
- Mitigation: localized production/pricing
- Distributor behavior: order timing to manage FX
- Risk: emerging-market volatility
Interest rates and channel financing
Rising policy rates (Fed funds 5.25–5.50% in 2024–25) lift mortgage and consumer loan costs, pushing homeowner pool/equipment financing yields higher and deferring projects. Dealers and distributors face working-capital stress, often trimming inventory or delaying buys. When rates ease, deferred install and retrofit demand can rebound quickly; vendor credit terms and consignment deals become key liquidity levers.
- Higher rates: tighter homeowner demand, inventory cuts
- Fed funds 5.25–5.50%: financing headwind
- Lower rates: unlock deferred projects
- Vendor terms/consignment: strategic liquidity tools
Tariffs, supply shocks and US incentives reshape pump sourcing, costs, and demand
Housing starts ~1.4M (2024) and US home‑improve spend ~$450B lift first‑fit demand; Sun Belt strength skews sales. Fed funds 5.25–5.50% (2024–25) and median household income $76,399 (2023) constrain big‑ticket upgrades; deferment shifts mix to aftermarket. Input costs (resin -≈20% from 2022 highs; copper ≈$9,000/t Jul 2025) and USD strength vs FY2023 $1.1B sales pressure margins.
| Metric | Value |
|---|---|
| Housing starts | ~1.4M (2024) |
| Fed funds | 5.25–5.50% (2024–25) |
| FY2023 sales | $1.1B |
Full Version Awaits
Hayward Industries PESTLE Analysis
This Hayward Industries PESTLE Analysis summarizes political, economic, social, technological, legal, and environmental factors affecting the pool-equipment manufacturer and its competitive positioning. The preview shown here is the exact document you’ll receive after purchase—fully formatted and ready to use. It offers concise, actionable insights for investors and strategists.

Plan Smarter. Present Sharper. Compete Stronger.
Unlock the external forces shaping Hayward Industries with our concise PESTLE snapshot—covering regulatory risks, market shifts, tech trends, and environmental drivers that could impact growth and valuation; buy the full analysis for the complete, actionable breakdown ready for strategic use.
Political factors
Trade policy and tariffs
Import duties—notably US Section 301 tariffs of up to 25% on many China-origin goods—can materially raise Hayward’s BOM and compress pricing power. Shifts in US–China and EU trade relations lengthen lead times and constrain sourcing flexibility, exacerbated by export controls tightened in 2022–24 on advanced components. Proactive tariff engineering and multi-country sourcing reduce cost volatility and supply risk.
Energy and water policy priorities
National policies such as the Inflation Reduction Act and expanding state rebate programs in 2024 are accelerating uptake of variable-speed pumps and smart controls, with utility rebates frequently covering up to 50% of retrofit costs. Drought-driven water restrictions in parts of the US and Australia have slowed new pool builds but increased retrofit demand for efficiency upgrades. Public utility specifications now often mandate ENERGY STAR or equivalent performance, directly shaping Hayward Industries R&D priorities and marketing claims.
Public health and safety governance
Rules on recreational water safety and sanitation drive Hayward product features and certification needs, with the CDC estimating roughly 3.7 million recreational water-associated illnesses annually in the U.S., heightening demand for validated disinfection tech. Government guidance during health crises (COVID-19 era usage swings) can rapidly shift commercial pool demand and operating protocols. Compliance increases testing and certification costs but strengthens brand trust and liability protection. Formal alignment with public health agencies can open institutional procurement channels and retrofit contracts.
Infrastructure and housing agendas
Stimulus for housing and outdoor living—backed by the $1.2 trillion IIJA and continued 2024 housing support—bolsters new pool installations and drives bundled equipment sales as US housing starts run near 1.4M annualized (2024). Stricter building codes push demand for higher-efficiency pumps and heaters. Regional grants in 2024 favored local manufacturers, while political shifts risk funding continuity and planning certainty.
- Stimulus: $1.2T IIJA; 2024 housing starts ~1.4M
- Codes: higher-efficiency mandates raise ASPs
- Grants: 2024 regional awards favor local footprints
- Risk: political shifts threaten multi-year funding
Geopolitical supply chain risk
Instability in key supplier regions disrupts motors, chips and plastics, with semiconductor lead times remaining elevated (around 20+ weeks at peaks in 2021–23) and polymer feedstock price volatility raising procurement risk. Sanctions and chokepoints (Suez/Red Sea incidents, trade restrictions) extend lead times and push working capital needs higher; US CHIPS Act ($52 billion) and government partnerships can ease critical-component access. Diversification and nearshoring reduce exposure but typically increase unit costs.
- Supply disruption: motors/chips/plastics
- Chip lead times: ~20+ weeks (peaks 2021–23)
- Policy relief: CHIPS Act $52 billion
- Trade risk: sanctions & chokepoints raise WC
- Mitigation: nearshoring raises unit costs
Tariffs, supply shocks and US incentives reshape pump sourcing, costs, and demand
Trade barriers (US Section 301 tariffs up to 25%) and export controls raise BOM costs and sourcing lead times; nearshoring reduces risk but ups unit cost. US policies (IRA, IIJA $1.2T) plus 2024 rebates (up to 50%) accelerate efficient pump adoption, while housing starts (~1.4M in 2024) support demand. Supply shocks (chip lead times ~20+ weeks) and sanctions increase WC needs; CHIPS Act $52B eases parts access.
| Factor | Impact | 2024/25 Metric |
|---|---|---|
| Tariffs | Higher BOM/pricing pressure | Up to 25% (Section 301) |
| Policy stimulus | Demand for efficient retrofits | IIJA $1.2T; IRA rebates ≤50% |
| Housing | New pool installations | Starts ~1.4M (2024) |
| Supply | Lead-time & WC stress | Chip LT ~20+ weeks; CHIPS $52B |
What is included in the product
Detailed Word Document
Explores how external macro-environmental factors uniquely affect Hayward Industries across Political, Economic, Social, Technological, Environmental and Legal dimensions, with data-driven insights and trend analysis. Designed to support executives and investors in identifying threats, opportunities and forward-looking scenarios specific to the pool equipment and controls sector.
Customizable Excel Spreadsheet
Concise, visually segmented PESTLE summary of Hayward Industries that quickly surfaces external risks and opportunities for meetings or presentations, easily editable for regional or product-specific notes and instantly shareable across teams to streamline strategic alignment.
Economic factors
Housing cycle and construction
New pool installations track housing activity—U.S. housing starts averaged about 1.4 million units in 2024 and home-improvement spending topped roughly $450 billion, boosting first-fit equipment demand. During downturns sales mix shifts toward aftermarket replacement and service parts, raising margin-stable revenue share. Regional housing strength (Sun Belt outperformance) shapes distributor inventory and cadence. Forecasting relies on permits and builder backlogs, which ran about 3–5 months in 2024.
Consumer discretionary spending
Pool upgrades compete with other big-ticket purchases for household budgets; US median household income was $76,399 in 2023 (Census), constraining discretionary spend. Strong employment—unemployment near 3.7% mid-2025 (BLS)—and income gains support premium connected products. In slowdowns demand shifts to value tiers and deferred maintenance, and heightened promotions compress margins and strain channel relations.
Input costs and inflation
Resin (-≈20% from 2022 highs), copper (~US$9,000/tonne as of July 2025), steel (~US$800/tonne) and normalized freight (container rates down ≈70% from 2021 peaks) flow through Hayward Industries COGS and pricing cadence. Sticky inflation compresses margins if price realization lags, while cost deflation can reset market pricing and share dynamics. Active hedging and design-to-value programs stabilize profitability and protect gross margins.
FX and international mix
Currency swings have lowered reported international sales for Hayward, with a stronger US dollar in 2024 weighing on cross-border competitiveness and margins; Hayward reported roughly $1.1bn in net sales in FY2023, making FX movements material to top-line translation and pricing power. Localized production and regional pricing reduce FX pass-through risk, while distributors trimming orders to hedge currency exposure and EM volatility complicate demand planning.
- FX exposure: meaningful vs FY2023 $1.1bn sales
- Mitigation: localized production/pricing
- Distributor behavior: order timing to manage FX
- Risk: emerging-market volatility
Interest rates and channel financing
Rising policy rates (Fed funds 5.25–5.50% in 2024–25) lift mortgage and consumer loan costs, pushing homeowner pool/equipment financing yields higher and deferring projects. Dealers and distributors face working-capital stress, often trimming inventory or delaying buys. When rates ease, deferred install and retrofit demand can rebound quickly; vendor credit terms and consignment deals become key liquidity levers.
- Higher rates: tighter homeowner demand, inventory cuts
- Fed funds 5.25–5.50%: financing headwind
- Lower rates: unlock deferred projects
- Vendor terms/consignment: strategic liquidity tools
Tariffs, supply shocks and US incentives reshape pump sourcing, costs, and demand
Housing starts ~1.4M (2024) and US home‑improve spend ~$450B lift first‑fit demand; Sun Belt strength skews sales. Fed funds 5.25–5.50% (2024–25) and median household income $76,399 (2023) constrain big‑ticket upgrades; deferment shifts mix to aftermarket. Input costs (resin -≈20% from 2022 highs; copper ≈$9,000/t Jul 2025) and USD strength vs FY2023 $1.1B sales pressure margins.
| Metric | Value |
|---|---|
| Housing starts | ~1.4M (2024) |
| Fed funds | 5.25–5.50% (2024–25) |
| FY2023 sales | $1.1B |
Full Version Awaits
Hayward Industries PESTLE Analysis
This Hayward Industries PESTLE Analysis summarizes political, economic, social, technological, legal, and environmental factors affecting the pool-equipment manufacturer and its competitive positioning. The preview shown here is the exact document you’ll receive after purchase—fully formatted and ready to use. It offers concise, actionable insights for investors and strategists.
Original: $10.00
-65%$10.00
$3.50Description
Plan Smarter. Present Sharper. Compete Stronger.
Unlock the external forces shaping Hayward Industries with our concise PESTLE snapshot—covering regulatory risks, market shifts, tech trends, and environmental drivers that could impact growth and valuation; buy the full analysis for the complete, actionable breakdown ready for strategic use.
Political factors
Trade policy and tariffs
Import duties—notably US Section 301 tariffs of up to 25% on many China-origin goods—can materially raise Hayward’s BOM and compress pricing power. Shifts in US–China and EU trade relations lengthen lead times and constrain sourcing flexibility, exacerbated by export controls tightened in 2022–24 on advanced components. Proactive tariff engineering and multi-country sourcing reduce cost volatility and supply risk.
Energy and water policy priorities
National policies such as the Inflation Reduction Act and expanding state rebate programs in 2024 are accelerating uptake of variable-speed pumps and smart controls, with utility rebates frequently covering up to 50% of retrofit costs. Drought-driven water restrictions in parts of the US and Australia have slowed new pool builds but increased retrofit demand for efficiency upgrades. Public utility specifications now often mandate ENERGY STAR or equivalent performance, directly shaping Hayward Industries R&D priorities and marketing claims.
Public health and safety governance
Rules on recreational water safety and sanitation drive Hayward product features and certification needs, with the CDC estimating roughly 3.7 million recreational water-associated illnesses annually in the U.S., heightening demand for validated disinfection tech. Government guidance during health crises (COVID-19 era usage swings) can rapidly shift commercial pool demand and operating protocols. Compliance increases testing and certification costs but strengthens brand trust and liability protection. Formal alignment with public health agencies can open institutional procurement channels and retrofit contracts.
Infrastructure and housing agendas
Stimulus for housing and outdoor living—backed by the $1.2 trillion IIJA and continued 2024 housing support—bolsters new pool installations and drives bundled equipment sales as US housing starts run near 1.4M annualized (2024). Stricter building codes push demand for higher-efficiency pumps and heaters. Regional grants in 2024 favored local manufacturers, while political shifts risk funding continuity and planning certainty.
- Stimulus: $1.2T IIJA; 2024 housing starts ~1.4M
- Codes: higher-efficiency mandates raise ASPs
- Grants: 2024 regional awards favor local footprints
- Risk: political shifts threaten multi-year funding
Geopolitical supply chain risk
Instability in key supplier regions disrupts motors, chips and plastics, with semiconductor lead times remaining elevated (around 20+ weeks at peaks in 2021–23) and polymer feedstock price volatility raising procurement risk. Sanctions and chokepoints (Suez/Red Sea incidents, trade restrictions) extend lead times and push working capital needs higher; US CHIPS Act ($52 billion) and government partnerships can ease critical-component access. Diversification and nearshoring reduce exposure but typically increase unit costs.
- Supply disruption: motors/chips/plastics
- Chip lead times: ~20+ weeks (peaks 2021–23)
- Policy relief: CHIPS Act $52 billion
- Trade risk: sanctions & chokepoints raise WC
- Mitigation: nearshoring raises unit costs
Tariffs, supply shocks and US incentives reshape pump sourcing, costs, and demand
Trade barriers (US Section 301 tariffs up to 25%) and export controls raise BOM costs and sourcing lead times; nearshoring reduces risk but ups unit cost. US policies (IRA, IIJA $1.2T) plus 2024 rebates (up to 50%) accelerate efficient pump adoption, while housing starts (~1.4M in 2024) support demand. Supply shocks (chip lead times ~20+ weeks) and sanctions increase WC needs; CHIPS Act $52B eases parts access.
| Factor | Impact | 2024/25 Metric |
|---|---|---|
| Tariffs | Higher BOM/pricing pressure | Up to 25% (Section 301) |
| Policy stimulus | Demand for efficient retrofits | IIJA $1.2T; IRA rebates ≤50% |
| Housing | New pool installations | Starts ~1.4M (2024) |
| Supply | Lead-time & WC stress | Chip LT ~20+ weeks; CHIPS $52B |
What is included in the product
Detailed Word Document
Explores how external macro-environmental factors uniquely affect Hayward Industries across Political, Economic, Social, Technological, Environmental and Legal dimensions, with data-driven insights and trend analysis. Designed to support executives and investors in identifying threats, opportunities and forward-looking scenarios specific to the pool equipment and controls sector.
Customizable Excel Spreadsheet
Concise, visually segmented PESTLE summary of Hayward Industries that quickly surfaces external risks and opportunities for meetings or presentations, easily editable for regional or product-specific notes and instantly shareable across teams to streamline strategic alignment.
Economic factors
Housing cycle and construction
New pool installations track housing activity—U.S. housing starts averaged about 1.4 million units in 2024 and home-improvement spending topped roughly $450 billion, boosting first-fit equipment demand. During downturns sales mix shifts toward aftermarket replacement and service parts, raising margin-stable revenue share. Regional housing strength (Sun Belt outperformance) shapes distributor inventory and cadence. Forecasting relies on permits and builder backlogs, which ran about 3–5 months in 2024.
Consumer discretionary spending
Pool upgrades compete with other big-ticket purchases for household budgets; US median household income was $76,399 in 2023 (Census), constraining discretionary spend. Strong employment—unemployment near 3.7% mid-2025 (BLS)—and income gains support premium connected products. In slowdowns demand shifts to value tiers and deferred maintenance, and heightened promotions compress margins and strain channel relations.
Input costs and inflation
Resin (-≈20% from 2022 highs), copper (~US$9,000/tonne as of July 2025), steel (~US$800/tonne) and normalized freight (container rates down ≈70% from 2021 peaks) flow through Hayward Industries COGS and pricing cadence. Sticky inflation compresses margins if price realization lags, while cost deflation can reset market pricing and share dynamics. Active hedging and design-to-value programs stabilize profitability and protect gross margins.
FX and international mix
Currency swings have lowered reported international sales for Hayward, with a stronger US dollar in 2024 weighing on cross-border competitiveness and margins; Hayward reported roughly $1.1bn in net sales in FY2023, making FX movements material to top-line translation and pricing power. Localized production and regional pricing reduce FX pass-through risk, while distributors trimming orders to hedge currency exposure and EM volatility complicate demand planning.
- FX exposure: meaningful vs FY2023 $1.1bn sales
- Mitigation: localized production/pricing
- Distributor behavior: order timing to manage FX
- Risk: emerging-market volatility
Interest rates and channel financing
Rising policy rates (Fed funds 5.25–5.50% in 2024–25) lift mortgage and consumer loan costs, pushing homeowner pool/equipment financing yields higher and deferring projects. Dealers and distributors face working-capital stress, often trimming inventory or delaying buys. When rates ease, deferred install and retrofit demand can rebound quickly; vendor credit terms and consignment deals become key liquidity levers.
- Higher rates: tighter homeowner demand, inventory cuts
- Fed funds 5.25–5.50%: financing headwind
- Lower rates: unlock deferred projects
- Vendor terms/consignment: strategic liquidity tools
Tariffs, supply shocks and US incentives reshape pump sourcing, costs, and demand
Housing starts ~1.4M (2024) and US home‑improve spend ~$450B lift first‑fit demand; Sun Belt strength skews sales. Fed funds 5.25–5.50% (2024–25) and median household income $76,399 (2023) constrain big‑ticket upgrades; deferment shifts mix to aftermarket. Input costs (resin -≈20% from 2022 highs; copper ≈$9,000/t Jul 2025) and USD strength vs FY2023 $1.1B sales pressure margins.
| Metric | Value |
|---|---|
| Housing starts | ~1.4M (2024) |
| Fed funds | 5.25–5.50% (2024–25) |
| FY2023 sales | $1.1B |
Full Version Awaits
Hayward Industries PESTLE Analysis
This Hayward Industries PESTLE Analysis summarizes political, economic, social, technological, legal, and environmental factors affecting the pool-equipment manufacturer and its competitive positioning. The preview shown here is the exact document you’ll receive after purchase—fully formatted and ready to use. It offers concise, actionable insights for investors and strategists.











