HCA Healthcare Boston Consulting Group Matrix

Actionable Strategy Starts Here
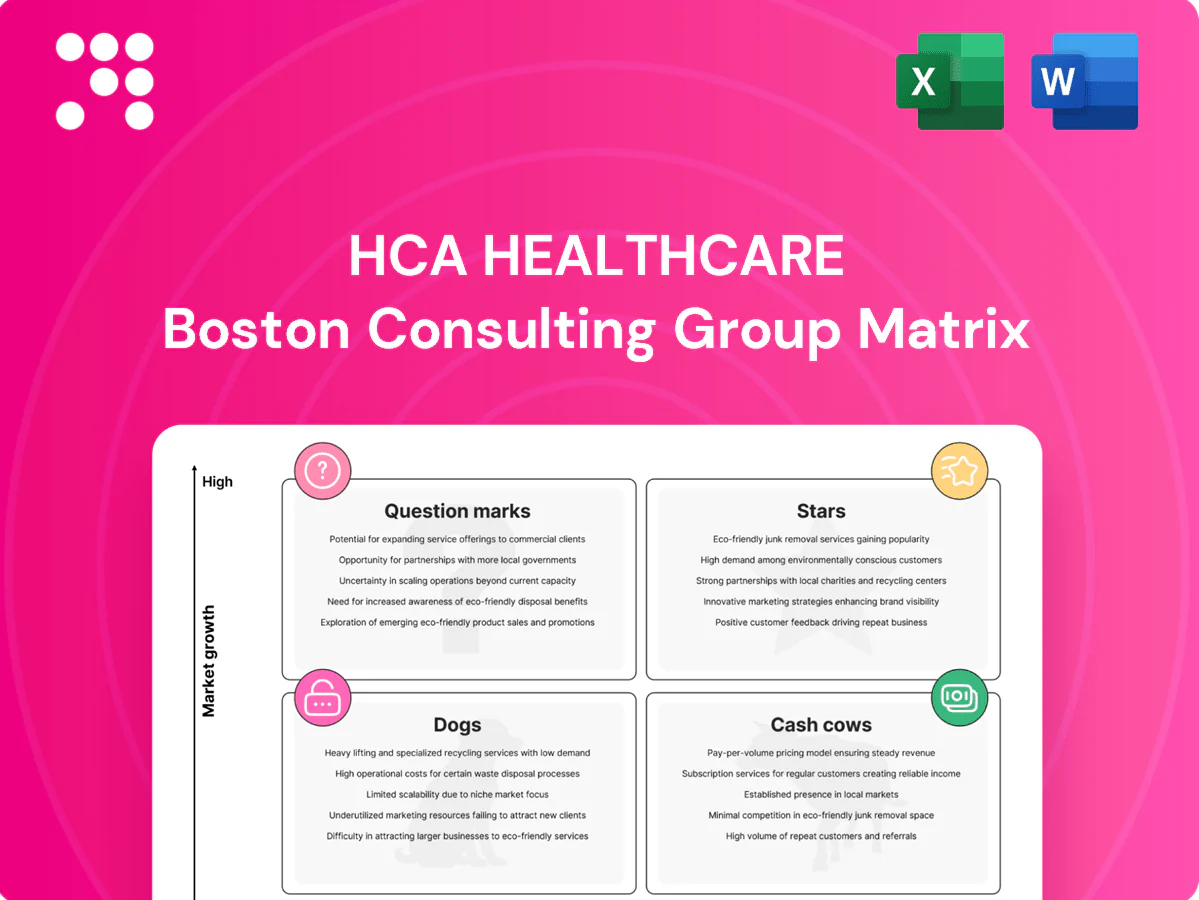
HCA Healthcare’s BCG Matrix snapshot shows which services are driving growth and which are quietly bleeding cash—insight that matters when you’re deciding where to invest or cut. This preview teases quadrant placements, but the full BCG Matrix delivers a quadrant-by-quadrant breakdown, data-backed recommendations, and a ready-to-use roadmap for strategic moves. Purchase the complete report for editable Word and Excel files that save you hours and give you clarity to act fast.
Stars

Freestanding ER clusters
Freestanding ER clusters in Sun Belt metros tap rising ER demand driven by fast population and net migration, and HCA’s scale—over 180 hospitals and ~2,300 sites of care—gives cost and referral advantages. These centers capture first-contact patients and funnel a disproportionate share of higher-acuity admissions, lifting inpatient volumes. They require heavy marketing and staffing investment, but market-share gains tend to persist; with continued investment they mature into steady cash generators.
Ambulatory surgery growth
Ambulatory surgery growth is a Stars play for HCA as outpatient procedures rapidly migrate to ASCs, where HCA’s convenience and deep surgeon relationships drive wins. HCA operates roughly 186 hospitals and over 2,200 ambulatory/outpatient sites, giving strong metro share while the ASC category continues to outpace hospital growth. Key levers are targeted capital deployment, advanced scheduling/throughput tech, and physician alignment. Nail utilization now, bank cash later.

Specialty centers of excellence
HCA specialty centers of excellence in cardiology, oncology and neuro drive referrals and payer steerage, capturing high-acuity, higher-margin cases. Aging and migration expand markets—Medicare enrollment reached about 65 million in 2024, lifting demand for complex care. These centers lead locally but need ongoing capex and brand spend to sustain access and outcomes; as growth cools they convert into cash cows.

Physician alignment engines
Employed and affiliated physician networks at HCA Healthcare drive volume capture across its 186 hospitals and 2,300+ sites of care, locking referral streams into hospital-owned assets and lifting system throughput. Recruiting and retention raise short-term labor and onboarding costs but secure market share in expanding metros where HCA is expanding capacity. Tight clinical and IT integration improves case mix, throughput, and payer leverage; invest now and the flywheel pays as markets mature.
- Volume capture: physician alignment channels referrals into owned sites
- Cost trade-off: up-front recruiting/retention vs long-term locked share
- Operational wins: integration boosts throughput, case mix, and payer leverage
Urgent care networks
In 2024 HCA’s urgent care networks are Stars: consumer-first access is scaling and dense clinic placement lets HCA dominate local catchment areas, serving as feeders into ERs, imaging and specialty referrals. Early-stage clinics consume cash for marketing and site density, but with scale they convert into steady referral machines and margin-accretive outpatient volumes.
- 2024: access-first growth
- feeds ERs, imaging, specialties
- high upfront cash burn: marketing, density
- scale → stable referral engine
Sun Belt ERs, ASCs gain share on first-contact care; 186 hospitals, 65M Medicare
Freestanding ER clusters in Sun Belt metros leverage HCA’s scale (186 hospitals, ~2,300 sites in 2024) to capture first-contact, higher-acuity admissions, requiring marketing and staffing spend but yielding persistent market share gains.
Ambulatory surgery centers and specialty centers (cardio/oncology/neuro) ride outpatient migration and Medicare-driven demand (≈65M enrollees in 2024), needing capex to convert growth into cash flow.
Employed physician networks and urgent care scale feed referrals, increasing throughput and payer leverage despite short-term recruitment and density costs.
| Asset | 2024 metric | BCG role |
|---|---|---|
| Freestanding ERs | 186 hospitals; ~2,300 sites | Star |
| ASCs | Outpatient shift accelerating | Star |
| Specialty centers | Medicare ≈65M | Star |
| Urgent care | Dense clinic growth 2024 | Star |
What is included in the product
 Detailed Word Document
Comprehensive BCG Matrix review of HCA units—identifies Stars, Cash Cows, Question Marks, Dogs with invest/hold/divest guidance.

 Customizable Excel Spreadsheet
One-page HCA Healthcare BCG Matrix placing each business unit in a quadrant for quick C-suite clarity and decisions.
Cash Cows

Core inpatient admissions
Core inpatient admissions are a mature cash cow, delivering steady volumes across HCA Healthcare’s 186 hospitals and ~2,300 care sites (2024), with entrenched market share in key markets. Optimized length-of-stay and strong capacity management sustain high margin throughput and predictable cash conversion. Incremental promotional spend is low, freeing surplus cash to underwrite growth bets and capital modernization.
Established emergency departments
Established emergency departments in mature neighborhoods deliver high market share and predictable volumes for HCA, leveraging the system footprint of about 185 hospitals and roughly 2,500 sites of care (2024). Operational efficiency and strong throughput convert steady visit counts into reliable margins, supporting HCA’s company-wide adjusted EBITDA margin near 17% in 2024. Growth is minimal but cash generation is steady; management focuses on milking these EDs while maintaining staffing levels and throughput KPIs.

Diagnostic imaging suites
Diagnostic imaging suites at HCA, supported by its network of ~180 hospitals and 2,400+ sites of care (2024), deliver stable CT/MRI/ultrasound volumes with strong referral capture; high fixed costs are already absorbed so utilization lifts margins materially. Limited marketing spend is needed, while targeted incremental tech upgrades squeeze incremental cash flow per scan.

Maternity & NICU programs
HCA Healthcare’s maternity and NICU programs leverage strong local brand trust across its network of about 186 hospitals and ~2,500 outpatient sites, producing steady birth volumes and predictable cash flow in many markets. Established clinician teams and standardized protocols keep unit costs tight, supporting high operating margins relative to growth services. Not high-growth but defensible share; focus on maintaining quality scores and capacity to harvest cash.
- Well-known programs; network scale ~186 hospitals
- Steady volumes → predictable cash flow
- Established teams/protocols → cost control
- Defensible market share; prioritize quality and capacity
Payer contracts & revenue cycle
Scale-based contracting and tuned revenue cycle management deliver dependable collections for HCA; with reported 2024 revenue of about $68 billion, these functions act as a margin backbone in a mature reimbursement environment. Growth in payer-driven volumes is low, but continuous RCM process improvements compound yield, preserving free cash flow. Ongoing investment in automation (AI-enabled denials, robotic billing) widens cash conversion and reduces days sales outstanding.
- Scale contracting: large payer leverage reduces volatility
- Tuned RCM: dependable collections sustain margins
- 2024 revenue: ~68B supports cash generation
- Action: invest in automation to widen cash flow
Scale hospital cash engine: $68B, ~17% EBITDA
HCA’s mature inpatient, ED, imaging and maternity cash cows generated predictable cash, supported by scale: ~186 hospitals and ~2,400 sites (2024), ~$68B revenue and ~17% adjusted EBITDA margin (2024). Low incremental marketing and high utilization sustain margins; surplus cash funds modernization and selective growth. RCM and scale contracting compress DSO and boost free cash flow.
| Segment | 2024 metric | Role |
|---|---|---|
| Inpatient | ~186 hospitals | Primary cash generator |
| ED | ~2,400 sites | Stable volumes |
| Imaging | High utilization | Margin lever |
| RCM | $68B revenue, ~17% EBITDA | Cash conversion |
Full Transparency, Always
HCA Healthcare BCG Matrix
The HCA Healthcare BCG Matrix you're previewing is the exact, final file you'll receive after purchase—no watermarks, no demo placeholders, just a fully formatted strategic report. Designed by healthcare strategy experts and grounded in market-backed analysis, it’s ready for immediate use. Buy once and download instantly; edit, print, or present to your board with zero surprises.

Actionable Strategy Starts Here
HCA Healthcare’s BCG Matrix snapshot shows which services are driving growth and which are quietly bleeding cash—insight that matters when you’re deciding where to invest or cut. This preview teases quadrant placements, but the full BCG Matrix delivers a quadrant-by-quadrant breakdown, data-backed recommendations, and a ready-to-use roadmap for strategic moves. Purchase the complete report for editable Word and Excel files that save you hours and give you clarity to act fast.
Stars
Freestanding ER clusters
Freestanding ER clusters in Sun Belt metros tap rising ER demand driven by fast population and net migration, and HCA’s scale—over 180 hospitals and ~2,300 sites of care—gives cost and referral advantages. These centers capture first-contact patients and funnel a disproportionate share of higher-acuity admissions, lifting inpatient volumes. They require heavy marketing and staffing investment, but market-share gains tend to persist; with continued investment they mature into steady cash generators.
Ambulatory surgery growth
Ambulatory surgery growth is a Stars play for HCA as outpatient procedures rapidly migrate to ASCs, where HCA’s convenience and deep surgeon relationships drive wins. HCA operates roughly 186 hospitals and over 2,200 ambulatory/outpatient sites, giving strong metro share while the ASC category continues to outpace hospital growth. Key levers are targeted capital deployment, advanced scheduling/throughput tech, and physician alignment. Nail utilization now, bank cash later.
Specialty centers of excellence
HCA specialty centers of excellence in cardiology, oncology and neuro drive referrals and payer steerage, capturing high-acuity, higher-margin cases. Aging and migration expand markets—Medicare enrollment reached about 65 million in 2024, lifting demand for complex care. These centers lead locally but need ongoing capex and brand spend to sustain access and outcomes; as growth cools they convert into cash cows.
Physician alignment engines
Employed and affiliated physician networks at HCA Healthcare drive volume capture across its 186 hospitals and 2,300+ sites of care, locking referral streams into hospital-owned assets and lifting system throughput. Recruiting and retention raise short-term labor and onboarding costs but secure market share in expanding metros where HCA is expanding capacity. Tight clinical and IT integration improves case mix, throughput, and payer leverage; invest now and the flywheel pays as markets mature.
- Volume capture: physician alignment channels referrals into owned sites
- Cost trade-off: up-front recruiting/retention vs long-term locked share
- Operational wins: integration boosts throughput, case mix, and payer leverage
Urgent care networks
In 2024 HCA’s urgent care networks are Stars: consumer-first access is scaling and dense clinic placement lets HCA dominate local catchment areas, serving as feeders into ERs, imaging and specialty referrals. Early-stage clinics consume cash for marketing and site density, but with scale they convert into steady referral machines and margin-accretive outpatient volumes.
- 2024: access-first growth
- feeds ERs, imaging, specialties
- high upfront cash burn: marketing, density
- scale → stable referral engine
Sun Belt ERs, ASCs gain share on first-contact care; 186 hospitals, 65M Medicare
Freestanding ER clusters in Sun Belt metros leverage HCA’s scale (186 hospitals, ~2,300 sites in 2024) to capture first-contact, higher-acuity admissions, requiring marketing and staffing spend but yielding persistent market share gains.
Ambulatory surgery centers and specialty centers (cardio/oncology/neuro) ride outpatient migration and Medicare-driven demand (≈65M enrollees in 2024), needing capex to convert growth into cash flow.
Employed physician networks and urgent care scale feed referrals, increasing throughput and payer leverage despite short-term recruitment and density costs.
| Asset | 2024 metric | BCG role |
|---|---|---|
| Freestanding ERs | 186 hospitals; ~2,300 sites | Star |
| ASCs | Outpatient shift accelerating | Star |
| Specialty centers | Medicare ≈65M | Star |
| Urgent care | Dense clinic growth 2024 | Star |
What is included in the product
Detailed Word Document
Comprehensive BCG Matrix review of HCA units—identifies Stars, Cash Cows, Question Marks, Dogs with invest/hold/divest guidance.
Customizable Excel Spreadsheet
One-page HCA Healthcare BCG Matrix placing each business unit in a quadrant for quick C-suite clarity and decisions.
Cash Cows
Core inpatient admissions
Core inpatient admissions are a mature cash cow, delivering steady volumes across HCA Healthcare’s 186 hospitals and ~2,300 care sites (2024), with entrenched market share in key markets. Optimized length-of-stay and strong capacity management sustain high margin throughput and predictable cash conversion. Incremental promotional spend is low, freeing surplus cash to underwrite growth bets and capital modernization.
Established emergency departments
Established emergency departments in mature neighborhoods deliver high market share and predictable volumes for HCA, leveraging the system footprint of about 185 hospitals and roughly 2,500 sites of care (2024). Operational efficiency and strong throughput convert steady visit counts into reliable margins, supporting HCA’s company-wide adjusted EBITDA margin near 17% in 2024. Growth is minimal but cash generation is steady; management focuses on milking these EDs while maintaining staffing levels and throughput KPIs.
Diagnostic imaging suites
Diagnostic imaging suites at HCA, supported by its network of ~180 hospitals and 2,400+ sites of care (2024), deliver stable CT/MRI/ultrasound volumes with strong referral capture; high fixed costs are already absorbed so utilization lifts margins materially. Limited marketing spend is needed, while targeted incremental tech upgrades squeeze incremental cash flow per scan.
Maternity & NICU programs
HCA Healthcare’s maternity and NICU programs leverage strong local brand trust across its network of about 186 hospitals and ~2,500 outpatient sites, producing steady birth volumes and predictable cash flow in many markets. Established clinician teams and standardized protocols keep unit costs tight, supporting high operating margins relative to growth services. Not high-growth but defensible share; focus on maintaining quality scores and capacity to harvest cash.
- Well-known programs; network scale ~186 hospitals
- Steady volumes → predictable cash flow
- Established teams/protocols → cost control
- Defensible market share; prioritize quality and capacity
Payer contracts & revenue cycle
Scale-based contracting and tuned revenue cycle management deliver dependable collections for HCA; with reported 2024 revenue of about $68 billion, these functions act as a margin backbone in a mature reimbursement environment. Growth in payer-driven volumes is low, but continuous RCM process improvements compound yield, preserving free cash flow. Ongoing investment in automation (AI-enabled denials, robotic billing) widens cash conversion and reduces days sales outstanding.
- Scale contracting: large payer leverage reduces volatility
- Tuned RCM: dependable collections sustain margins
- 2024 revenue: ~68B supports cash generation
- Action: invest in automation to widen cash flow
Scale hospital cash engine: $68B, ~17% EBITDA
HCA’s mature inpatient, ED, imaging and maternity cash cows generated predictable cash, supported by scale: ~186 hospitals and ~2,400 sites (2024), ~$68B revenue and ~17% adjusted EBITDA margin (2024). Low incremental marketing and high utilization sustain margins; surplus cash funds modernization and selective growth. RCM and scale contracting compress DSO and boost free cash flow.
| Segment | 2024 metric | Role |
|---|---|---|
| Inpatient | ~186 hospitals | Primary cash generator |
| ED | ~2,400 sites | Stable volumes |
| Imaging | High utilization | Margin lever |
| RCM | $68B revenue, ~17% EBITDA | Cash conversion |
Full Transparency, Always
HCA Healthcare BCG Matrix
The HCA Healthcare BCG Matrix you're previewing is the exact, final file you'll receive after purchase—no watermarks, no demo placeholders, just a fully formatted strategic report. Designed by healthcare strategy experts and grounded in market-backed analysis, it’s ready for immediate use. Buy once and download instantly; edit, print, or present to your board with zero surprises.
Description
Actionable Strategy Starts Here
HCA Healthcare’s BCG Matrix snapshot shows which services are driving growth and which are quietly bleeding cash—insight that matters when you’re deciding where to invest or cut. This preview teases quadrant placements, but the full BCG Matrix delivers a quadrant-by-quadrant breakdown, data-backed recommendations, and a ready-to-use roadmap for strategic moves. Purchase the complete report for editable Word and Excel files that save you hours and give you clarity to act fast.
Stars
Freestanding ER clusters
Freestanding ER clusters in Sun Belt metros tap rising ER demand driven by fast population and net migration, and HCA’s scale—over 180 hospitals and ~2,300 sites of care—gives cost and referral advantages. These centers capture first-contact patients and funnel a disproportionate share of higher-acuity admissions, lifting inpatient volumes. They require heavy marketing and staffing investment, but market-share gains tend to persist; with continued investment they mature into steady cash generators.
Ambulatory surgery growth
Ambulatory surgery growth is a Stars play for HCA as outpatient procedures rapidly migrate to ASCs, where HCA’s convenience and deep surgeon relationships drive wins. HCA operates roughly 186 hospitals and over 2,200 ambulatory/outpatient sites, giving strong metro share while the ASC category continues to outpace hospital growth. Key levers are targeted capital deployment, advanced scheduling/throughput tech, and physician alignment. Nail utilization now, bank cash later.
Specialty centers of excellence
HCA specialty centers of excellence in cardiology, oncology and neuro drive referrals and payer steerage, capturing high-acuity, higher-margin cases. Aging and migration expand markets—Medicare enrollment reached about 65 million in 2024, lifting demand for complex care. These centers lead locally but need ongoing capex and brand spend to sustain access and outcomes; as growth cools they convert into cash cows.
Physician alignment engines
Employed and affiliated physician networks at HCA Healthcare drive volume capture across its 186 hospitals and 2,300+ sites of care, locking referral streams into hospital-owned assets and lifting system throughput. Recruiting and retention raise short-term labor and onboarding costs but secure market share in expanding metros where HCA is expanding capacity. Tight clinical and IT integration improves case mix, throughput, and payer leverage; invest now and the flywheel pays as markets mature.
- Volume capture: physician alignment channels referrals into owned sites
- Cost trade-off: up-front recruiting/retention vs long-term locked share
- Operational wins: integration boosts throughput, case mix, and payer leverage
Urgent care networks
In 2024 HCA’s urgent care networks are Stars: consumer-first access is scaling and dense clinic placement lets HCA dominate local catchment areas, serving as feeders into ERs, imaging and specialty referrals. Early-stage clinics consume cash for marketing and site density, but with scale they convert into steady referral machines and margin-accretive outpatient volumes.
- 2024: access-first growth
- feeds ERs, imaging, specialties
- high upfront cash burn: marketing, density
- scale → stable referral engine
Sun Belt ERs, ASCs gain share on first-contact care; 186 hospitals, 65M Medicare
Freestanding ER clusters in Sun Belt metros leverage HCA’s scale (186 hospitals, ~2,300 sites in 2024) to capture first-contact, higher-acuity admissions, requiring marketing and staffing spend but yielding persistent market share gains.
Ambulatory surgery centers and specialty centers (cardio/oncology/neuro) ride outpatient migration and Medicare-driven demand (≈65M enrollees in 2024), needing capex to convert growth into cash flow.
Employed physician networks and urgent care scale feed referrals, increasing throughput and payer leverage despite short-term recruitment and density costs.
| Asset | 2024 metric | BCG role |
|---|---|---|
| Freestanding ERs | 186 hospitals; ~2,300 sites | Star |
| ASCs | Outpatient shift accelerating | Star |
| Specialty centers | Medicare ≈65M | Star |
| Urgent care | Dense clinic growth 2024 | Star |
What is included in the product
Detailed Word Document
Comprehensive BCG Matrix review of HCA units—identifies Stars, Cash Cows, Question Marks, Dogs with invest/hold/divest guidance.
Customizable Excel Spreadsheet
One-page HCA Healthcare BCG Matrix placing each business unit in a quadrant for quick C-suite clarity and decisions.
Cash Cows
Core inpatient admissions
Core inpatient admissions are a mature cash cow, delivering steady volumes across HCA Healthcare’s 186 hospitals and ~2,300 care sites (2024), with entrenched market share in key markets. Optimized length-of-stay and strong capacity management sustain high margin throughput and predictable cash conversion. Incremental promotional spend is low, freeing surplus cash to underwrite growth bets and capital modernization.
Established emergency departments
Established emergency departments in mature neighborhoods deliver high market share and predictable volumes for HCA, leveraging the system footprint of about 185 hospitals and roughly 2,500 sites of care (2024). Operational efficiency and strong throughput convert steady visit counts into reliable margins, supporting HCA’s company-wide adjusted EBITDA margin near 17% in 2024. Growth is minimal but cash generation is steady; management focuses on milking these EDs while maintaining staffing levels and throughput KPIs.
Diagnostic imaging suites
Diagnostic imaging suites at HCA, supported by its network of ~180 hospitals and 2,400+ sites of care (2024), deliver stable CT/MRI/ultrasound volumes with strong referral capture; high fixed costs are already absorbed so utilization lifts margins materially. Limited marketing spend is needed, while targeted incremental tech upgrades squeeze incremental cash flow per scan.
Maternity & NICU programs
HCA Healthcare’s maternity and NICU programs leverage strong local brand trust across its network of about 186 hospitals and ~2,500 outpatient sites, producing steady birth volumes and predictable cash flow in many markets. Established clinician teams and standardized protocols keep unit costs tight, supporting high operating margins relative to growth services. Not high-growth but defensible share; focus on maintaining quality scores and capacity to harvest cash.
- Well-known programs; network scale ~186 hospitals
- Steady volumes → predictable cash flow
- Established teams/protocols → cost control
- Defensible market share; prioritize quality and capacity
Payer contracts & revenue cycle
Scale-based contracting and tuned revenue cycle management deliver dependable collections for HCA; with reported 2024 revenue of about $68 billion, these functions act as a margin backbone in a mature reimbursement environment. Growth in payer-driven volumes is low, but continuous RCM process improvements compound yield, preserving free cash flow. Ongoing investment in automation (AI-enabled denials, robotic billing) widens cash conversion and reduces days sales outstanding.
- Scale contracting: large payer leverage reduces volatility
- Tuned RCM: dependable collections sustain margins
- 2024 revenue: ~68B supports cash generation
- Action: invest in automation to widen cash flow
Scale hospital cash engine: $68B, ~17% EBITDA
HCA’s mature inpatient, ED, imaging and maternity cash cows generated predictable cash, supported by scale: ~186 hospitals and ~2,400 sites (2024), ~$68B revenue and ~17% adjusted EBITDA margin (2024). Low incremental marketing and high utilization sustain margins; surplus cash funds modernization and selective growth. RCM and scale contracting compress DSO and boost free cash flow.
| Segment | 2024 metric | Role |
|---|---|---|
| Inpatient | ~186 hospitals | Primary cash generator |
| ED | ~2,400 sites | Stable volumes |
| Imaging | High utilization | Margin lever |
| RCM | $68B revenue, ~17% EBITDA | Cash conversion |
Full Transparency, Always
HCA Healthcare BCG Matrix
The HCA Healthcare BCG Matrix you're previewing is the exact, final file you'll receive after purchase—no watermarks, no demo placeholders, just a fully formatted strategic report. Designed by healthcare strategy experts and grounded in market-backed analysis, it’s ready for immediate use. Buy once and download instantly; edit, print, or present to your board with zero surprises.











