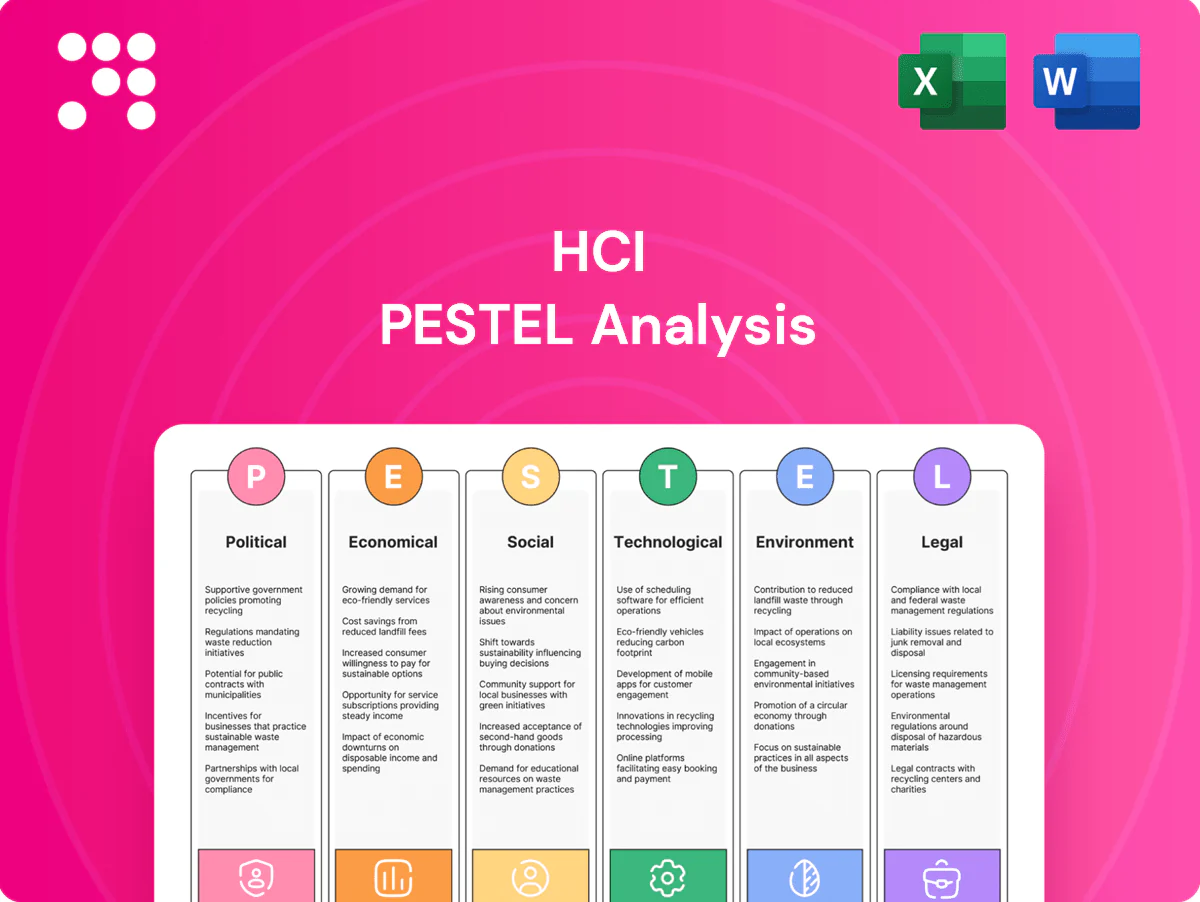
HCI PESTLE Analysis

Your Shortcut to Market Insight Starts Here
Discover how external political, economic, social, technological, legal, and environmental forces are reshaping HCI’s strategic outlook in our concise PESTLE snapshot. Ideal for investors, consultants, and planners, this analysis highlights risks and opportunities you can act on immediately. Purchase the full PESTLE for a deep-dive, editable report and practical recommendations to inform decisions today.
Political factors

State insurance policy
Florida’s political stance on property insurance directly shapes rates, coverage availability and depopulation from state-backed Citizens (Citizens insured about 362,000 policies as of Dec 2024), affecting HCI’s pricing and catastrophe exposure. Incentives or mandates for private carriers can quickly shift HCI’s market share and risk mix. Changes in leadership or legislative priorities during sessions (2024–25 reforms ongoing) may rapidly alter market dynamics, so close monitoring of session outcomes is critical.
Catastrophe funding programs
Public reinsurance layers and catastrophe funds materially affect HCI’s cost of capital and retention choices, since state-backed capacity shifts change available market limits and pricing. Adjustments to those layers can tighten or loosen capacity, and Aon reported global reinsurance pricing rose about 12% in 2024, tightening retention economics. Political support for programs shapes solvency expectations and therefore cascades into underwriting appetite and premium levels.

Disaster relief and resiliency spending
Federal and state allocations for mitigation, infrastructure, and recovery materially affect loss severities; the Bipartisan Infrastructure Law (2021) $1.2 trillion package and subsequent resilience grants redirect capital into risk reduction. Increased resiliency can reduce catastrophe claims volatility over time, lowering average annual losses where retrofits are implemented. Political willingness to fund retrofits changes long-term risk and informs geographic concentration strategy.

Trade and reinsurance diplomacy
- Global capital: ~USD 650B (Swiss Re, 2024)
- Sanctions/capacity withdrawals tighten supply
- Stability = increased capital for HCI
- Policy clarity reduces basis risk
Technology and cybersecurity policy
Public-sector cyber priorities shape IT roadmaps; global cybersecurity spending topped 200 billion USD in 2024 and EU Digital Europe allocates €7.5B (2021-27), accelerating standards adoption and insurtech partnerships. Political pressure for digital public services expands integration opportunities, while NIS2 and stricter controls across 27 EU states raise compliance costs and operational overhead.
- Public spend: >200B USD (2024)
- EU funding: €7.5B (Digital Europe)
- NIS2: 27 EU states → higher compliance costs
Florida HCI: state insurer ~362,000 policies; reinsurance pressure
Florida policy regime drives HCI pricing and exposure; Citizens insured ~362,000 policies (Dec 2024). Public reinsurance capacity and pricing shift retention economics—global reinsurance capital ~USD 650B and Aon reported ~+12% pricing (2024). Federal/state resilience funding (BIL $1.2T) reduces long‑term losses where applied. Cyber/public IT spend >USD 200B (2024) and NIS2 raise compliance costs.
| Factor | Metric | Value/Year |
|---|---|---|
| Citizens exposure | Policies | ~362,000 (Dec 2024) |
| Reinsurance capital | Global supply | ~USD 650B (2024) |
| Reins. pricing | Change | +12% (2024) |
| Cyber spend | Global | >USD 200B (2024) |
What is included in the product
 Detailed Word Document
Explores how Political, Economic, Social, Technological, Environmental and Legal forces uniquely shape the HCI, combining data‑backed trends, region‑specific insights and forward‑looking scenarios to help executives and investors spot risks, opportunities and actionable strategies.

 Customizable Excel Spreadsheet
A concise, visually segmented HCI PESTLE summary that relieves analysis pain by enabling quick interpretation and sharing across teams; editable notes let users localize insights to their region or business line for faster risk discussion and planning.
Economic factors

Cat risk pricing cycle
Reinsurance and primary rates harden after major events, with 2023–24 renewals posting double-digit increases in many property perils, compressing HCI margins. HCI’s earnings swing with the catastrophe cycle as supply–demand imbalances translate to volatile combined ratios. Peak-peril capital flows—driven by reinsurer retrenchment and ILS re‑pricing—raise the cost of risk transfer. Cycle timing directs renewal and capital allocation decisions.
Housing market and exposure
Florida home values rose about 7% year-over-year in 2024, while single-family building permits increased roughly 9%—both trends expanding insured exposures as in-migration and second-home buying continue. Rising replacement-cost inflation (around +18% since 2020) inflates sums insured and loss severities. Affordability pressures are driving higher lapse risk and underinsurance, and active geographic mix optimization remains vital to manage concentration and catastrophe exposure.

Interest rates and investment income
Higher yields (US 10-year ≈4.1% and fed funds 5.25–5.50% in July 2025) lift portfolio returns and can materially offset underwriting volatility, improving net investment income for insurers. Mark-to-market swings (price change ≈ -duration × yield change) can move capital ratios and surplus by multiple hundred basis points on 100bp moves. Active duration management becomes a key earnings lever and observed rate paths guide pricing adequacy targets.

Inflation and claims severity
Construction inflation and labor shortages continue to elevate loss costs—U.S. CPI eased to 3.4% in 2023 (BLS) but input and wage pressures in construction remain elevated, pushing repair and rebuild costs higher. Social inflation has increased liability severity and litigation expenses, forcing faster pricing and reserving updates to avoid margin erosion. Robust vendor networks and procurement discipline are essential to control supply-chain-driven cost spikes.
- construction-inflation: input/wage pressures
- social-inflation: higher jury awards/litigation costs
- pricing-reserving: must adapt quickly
- vendor-procurement: critical for cost control
Capital markets capacity
- Cat bonds/ILS: global market ~USD 50bn (mid‑2025)
- Abundant capital → compressed spreads; scarcity → wider spreads
- HCI access to ART → stabilizes underwriting volatility
- Investor sentiment ↔ macro risk appetite → impacts premia
Florida HCI: state insurer ~362,000 policies; reinsurance pressure
Rising re/primary rates after 2022–24 cat losses and cat-bond repricing compress HCI margins; underwriting cycles drive volatile combined ratios. Higher yields (US 10y ~4.1%, fed funds 5.25–5.50% Jul 2025) boost investment income offsetting underwriting swings. Replacement-cost inflation (~+18% since 2020) and FL home values +7% YoY 2024 raise insured exposures and loss severity.
| Metric | Value |
|---|---|
| US 10y (Jul 2025) | ~4.1% |
| Fed funds (Jul 2025) | 5.25–5.50% |
| Cat bond market (mid‑2025) | ~USD 50bn |
| FL home values (YoY 2024) | +7% |
| Replacement-cost inflation (since 2020) | ≈+18% |
Full Version Awaits
HCI PESTLE Analysis
The HCI PESTLE Analysis preview shown here is the exact document you’ll receive after purchase—fully formatted, professionally structured, and ready to use. The content, layout, and insights visible are the final file you’ll download immediately after checkout. No placeholders, no surprises.

Your Shortcut to Market Insight Starts Here
Discover how external political, economic, social, technological, legal, and environmental forces are reshaping HCI’s strategic outlook in our concise PESTLE snapshot. Ideal for investors, consultants, and planners, this analysis highlights risks and opportunities you can act on immediately. Purchase the full PESTLE for a deep-dive, editable report and practical recommendations to inform decisions today.
Political factors
State insurance policy
Florida’s political stance on property insurance directly shapes rates, coverage availability and depopulation from state-backed Citizens (Citizens insured about 362,000 policies as of Dec 2024), affecting HCI’s pricing and catastrophe exposure. Incentives or mandates for private carriers can quickly shift HCI’s market share and risk mix. Changes in leadership or legislative priorities during sessions (2024–25 reforms ongoing) may rapidly alter market dynamics, so close monitoring of session outcomes is critical.
Catastrophe funding programs
Public reinsurance layers and catastrophe funds materially affect HCI’s cost of capital and retention choices, since state-backed capacity shifts change available market limits and pricing. Adjustments to those layers can tighten or loosen capacity, and Aon reported global reinsurance pricing rose about 12% in 2024, tightening retention economics. Political support for programs shapes solvency expectations and therefore cascades into underwriting appetite and premium levels.
Disaster relief and resiliency spending
Federal and state allocations for mitigation, infrastructure, and recovery materially affect loss severities; the Bipartisan Infrastructure Law (2021) $1.2 trillion package and subsequent resilience grants redirect capital into risk reduction. Increased resiliency can reduce catastrophe claims volatility over time, lowering average annual losses where retrofits are implemented. Political willingness to fund retrofits changes long-term risk and informs geographic concentration strategy.
Trade and reinsurance diplomacy
- Global capital: ~USD 650B (Swiss Re, 2024)
- Sanctions/capacity withdrawals tighten supply
- Stability = increased capital for HCI
- Policy clarity reduces basis risk
Technology and cybersecurity policy
Public-sector cyber priorities shape IT roadmaps; global cybersecurity spending topped 200 billion USD in 2024 and EU Digital Europe allocates €7.5B (2021-27), accelerating standards adoption and insurtech partnerships. Political pressure for digital public services expands integration opportunities, while NIS2 and stricter controls across 27 EU states raise compliance costs and operational overhead.
- Public spend: >200B USD (2024)
- EU funding: €7.5B (Digital Europe)
- NIS2: 27 EU states → higher compliance costs
Florida HCI: state insurer ~362,000 policies; reinsurance pressure
Florida policy regime drives HCI pricing and exposure; Citizens insured ~362,000 policies (Dec 2024). Public reinsurance capacity and pricing shift retention economics—global reinsurance capital ~USD 650B and Aon reported ~+12% pricing (2024). Federal/state resilience funding (BIL $1.2T) reduces long‑term losses where applied. Cyber/public IT spend >USD 200B (2024) and NIS2 raise compliance costs.
| Factor | Metric | Value/Year |
|---|---|---|
| Citizens exposure | Policies | ~362,000 (Dec 2024) |
| Reinsurance capital | Global supply | ~USD 650B (2024) |
| Reins. pricing | Change | +12% (2024) |
| Cyber spend | Global | >USD 200B (2024) |
What is included in the product
Detailed Word Document
Explores how Political, Economic, Social, Technological, Environmental and Legal forces uniquely shape the HCI, combining data‑backed trends, region‑specific insights and forward‑looking scenarios to help executives and investors spot risks, opportunities and actionable strategies.
Customizable Excel Spreadsheet
A concise, visually segmented HCI PESTLE summary that relieves analysis pain by enabling quick interpretation and sharing across teams; editable notes let users localize insights to their region or business line for faster risk discussion and planning.
Economic factors
Cat risk pricing cycle
Reinsurance and primary rates harden after major events, with 2023–24 renewals posting double-digit increases in many property perils, compressing HCI margins. HCI’s earnings swing with the catastrophe cycle as supply–demand imbalances translate to volatile combined ratios. Peak-peril capital flows—driven by reinsurer retrenchment and ILS re‑pricing—raise the cost of risk transfer. Cycle timing directs renewal and capital allocation decisions.
Housing market and exposure
Florida home values rose about 7% year-over-year in 2024, while single-family building permits increased roughly 9%—both trends expanding insured exposures as in-migration and second-home buying continue. Rising replacement-cost inflation (around +18% since 2020) inflates sums insured and loss severities. Affordability pressures are driving higher lapse risk and underinsurance, and active geographic mix optimization remains vital to manage concentration and catastrophe exposure.
Interest rates and investment income
Higher yields (US 10-year ≈4.1% and fed funds 5.25–5.50% in July 2025) lift portfolio returns and can materially offset underwriting volatility, improving net investment income for insurers. Mark-to-market swings (price change ≈ -duration × yield change) can move capital ratios and surplus by multiple hundred basis points on 100bp moves. Active duration management becomes a key earnings lever and observed rate paths guide pricing adequacy targets.
Inflation and claims severity
Construction inflation and labor shortages continue to elevate loss costs—U.S. CPI eased to 3.4% in 2023 (BLS) but input and wage pressures in construction remain elevated, pushing repair and rebuild costs higher. Social inflation has increased liability severity and litigation expenses, forcing faster pricing and reserving updates to avoid margin erosion. Robust vendor networks and procurement discipline are essential to control supply-chain-driven cost spikes.
- construction-inflation: input/wage pressures
- social-inflation: higher jury awards/litigation costs
- pricing-reserving: must adapt quickly
- vendor-procurement: critical for cost control
Capital markets capacity
- Cat bonds/ILS: global market ~USD 50bn (mid‑2025)
- Abundant capital → compressed spreads; scarcity → wider spreads
- HCI access to ART → stabilizes underwriting volatility
- Investor sentiment ↔ macro risk appetite → impacts premia
Florida HCI: state insurer ~362,000 policies; reinsurance pressure
Rising re/primary rates after 2022–24 cat losses and cat-bond repricing compress HCI margins; underwriting cycles drive volatile combined ratios. Higher yields (US 10y ~4.1%, fed funds 5.25–5.50% Jul 2025) boost investment income offsetting underwriting swings. Replacement-cost inflation (~+18% since 2020) and FL home values +7% YoY 2024 raise insured exposures and loss severity.
| Metric | Value |
|---|---|
| US 10y (Jul 2025) | ~4.1% |
| Fed funds (Jul 2025) | 5.25–5.50% |
| Cat bond market (mid‑2025) | ~USD 50bn |
| FL home values (YoY 2024) | +7% |
| Replacement-cost inflation (since 2020) | ≈+18% |
Full Version Awaits
HCI PESTLE Analysis
The HCI PESTLE Analysis preview shown here is the exact document you’ll receive after purchase—fully formatted, professionally structured, and ready to use. The content, layout, and insights visible are the final file you’ll download immediately after checkout. No placeholders, no surprises.
Original: $10.00
-65%$10.00
$3.50Description
Your Shortcut to Market Insight Starts Here
Discover how external political, economic, social, technological, legal, and environmental forces are reshaping HCI’s strategic outlook in our concise PESTLE snapshot. Ideal for investors, consultants, and planners, this analysis highlights risks and opportunities you can act on immediately. Purchase the full PESTLE for a deep-dive, editable report and practical recommendations to inform decisions today.
Political factors
State insurance policy
Florida’s political stance on property insurance directly shapes rates, coverage availability and depopulation from state-backed Citizens (Citizens insured about 362,000 policies as of Dec 2024), affecting HCI’s pricing and catastrophe exposure. Incentives or mandates for private carriers can quickly shift HCI’s market share and risk mix. Changes in leadership or legislative priorities during sessions (2024–25 reforms ongoing) may rapidly alter market dynamics, so close monitoring of session outcomes is critical.
Catastrophe funding programs
Public reinsurance layers and catastrophe funds materially affect HCI’s cost of capital and retention choices, since state-backed capacity shifts change available market limits and pricing. Adjustments to those layers can tighten or loosen capacity, and Aon reported global reinsurance pricing rose about 12% in 2024, tightening retention economics. Political support for programs shapes solvency expectations and therefore cascades into underwriting appetite and premium levels.
Disaster relief and resiliency spending
Federal and state allocations for mitigation, infrastructure, and recovery materially affect loss severities; the Bipartisan Infrastructure Law (2021) $1.2 trillion package and subsequent resilience grants redirect capital into risk reduction. Increased resiliency can reduce catastrophe claims volatility over time, lowering average annual losses where retrofits are implemented. Political willingness to fund retrofits changes long-term risk and informs geographic concentration strategy.
Trade and reinsurance diplomacy
- Global capital: ~USD 650B (Swiss Re, 2024)
- Sanctions/capacity withdrawals tighten supply
- Stability = increased capital for HCI
- Policy clarity reduces basis risk
Technology and cybersecurity policy
Public-sector cyber priorities shape IT roadmaps; global cybersecurity spending topped 200 billion USD in 2024 and EU Digital Europe allocates €7.5B (2021-27), accelerating standards adoption and insurtech partnerships. Political pressure for digital public services expands integration opportunities, while NIS2 and stricter controls across 27 EU states raise compliance costs and operational overhead.
- Public spend: >200B USD (2024)
- EU funding: €7.5B (Digital Europe)
- NIS2: 27 EU states → higher compliance costs
Florida HCI: state insurer ~362,000 policies; reinsurance pressure
Florida policy regime drives HCI pricing and exposure; Citizens insured ~362,000 policies (Dec 2024). Public reinsurance capacity and pricing shift retention economics—global reinsurance capital ~USD 650B and Aon reported ~+12% pricing (2024). Federal/state resilience funding (BIL $1.2T) reduces long‑term losses where applied. Cyber/public IT spend >USD 200B (2024) and NIS2 raise compliance costs.
| Factor | Metric | Value/Year |
|---|---|---|
| Citizens exposure | Policies | ~362,000 (Dec 2024) |
| Reinsurance capital | Global supply | ~USD 650B (2024) |
| Reins. pricing | Change | +12% (2024) |
| Cyber spend | Global | >USD 200B (2024) |
What is included in the product
Detailed Word Document
Explores how Political, Economic, Social, Technological, Environmental and Legal forces uniquely shape the HCI, combining data‑backed trends, region‑specific insights and forward‑looking scenarios to help executives and investors spot risks, opportunities and actionable strategies.
Customizable Excel Spreadsheet
A concise, visually segmented HCI PESTLE summary that relieves analysis pain by enabling quick interpretation and sharing across teams; editable notes let users localize insights to their region or business line for faster risk discussion and planning.
Economic factors
Cat risk pricing cycle
Reinsurance and primary rates harden after major events, with 2023–24 renewals posting double-digit increases in many property perils, compressing HCI margins. HCI’s earnings swing with the catastrophe cycle as supply–demand imbalances translate to volatile combined ratios. Peak-peril capital flows—driven by reinsurer retrenchment and ILS re‑pricing—raise the cost of risk transfer. Cycle timing directs renewal and capital allocation decisions.
Housing market and exposure
Florida home values rose about 7% year-over-year in 2024, while single-family building permits increased roughly 9%—both trends expanding insured exposures as in-migration and second-home buying continue. Rising replacement-cost inflation (around +18% since 2020) inflates sums insured and loss severities. Affordability pressures are driving higher lapse risk and underinsurance, and active geographic mix optimization remains vital to manage concentration and catastrophe exposure.
Interest rates and investment income
Higher yields (US 10-year ≈4.1% and fed funds 5.25–5.50% in July 2025) lift portfolio returns and can materially offset underwriting volatility, improving net investment income for insurers. Mark-to-market swings (price change ≈ -duration × yield change) can move capital ratios and surplus by multiple hundred basis points on 100bp moves. Active duration management becomes a key earnings lever and observed rate paths guide pricing adequacy targets.
Inflation and claims severity
Construction inflation and labor shortages continue to elevate loss costs—U.S. CPI eased to 3.4% in 2023 (BLS) but input and wage pressures in construction remain elevated, pushing repair and rebuild costs higher. Social inflation has increased liability severity and litigation expenses, forcing faster pricing and reserving updates to avoid margin erosion. Robust vendor networks and procurement discipline are essential to control supply-chain-driven cost spikes.
- construction-inflation: input/wage pressures
- social-inflation: higher jury awards/litigation costs
- pricing-reserving: must adapt quickly
- vendor-procurement: critical for cost control
Capital markets capacity
- Cat bonds/ILS: global market ~USD 50bn (mid‑2025)
- Abundant capital → compressed spreads; scarcity → wider spreads
- HCI access to ART → stabilizes underwriting volatility
- Investor sentiment ↔ macro risk appetite → impacts premia
Florida HCI: state insurer ~362,000 policies; reinsurance pressure
Rising re/primary rates after 2022–24 cat losses and cat-bond repricing compress HCI margins; underwriting cycles drive volatile combined ratios. Higher yields (US 10y ~4.1%, fed funds 5.25–5.50% Jul 2025) boost investment income offsetting underwriting swings. Replacement-cost inflation (~+18% since 2020) and FL home values +7% YoY 2024 raise insured exposures and loss severity.
| Metric | Value |
|---|---|
| US 10y (Jul 2025) | ~4.1% |
| Fed funds (Jul 2025) | 5.25–5.50% |
| Cat bond market (mid‑2025) | ~USD 50bn |
| FL home values (YoY 2024) | +7% |
| Replacement-cost inflation (since 2020) | ≈+18% |
Full Version Awaits
HCI PESTLE Analysis
The HCI PESTLE Analysis preview shown here is the exact document you’ll receive after purchase—fully formatted, professionally structured, and ready to use. The content, layout, and insights visible are the final file you’ll download immediately after checkout. No placeholders, no surprises.











