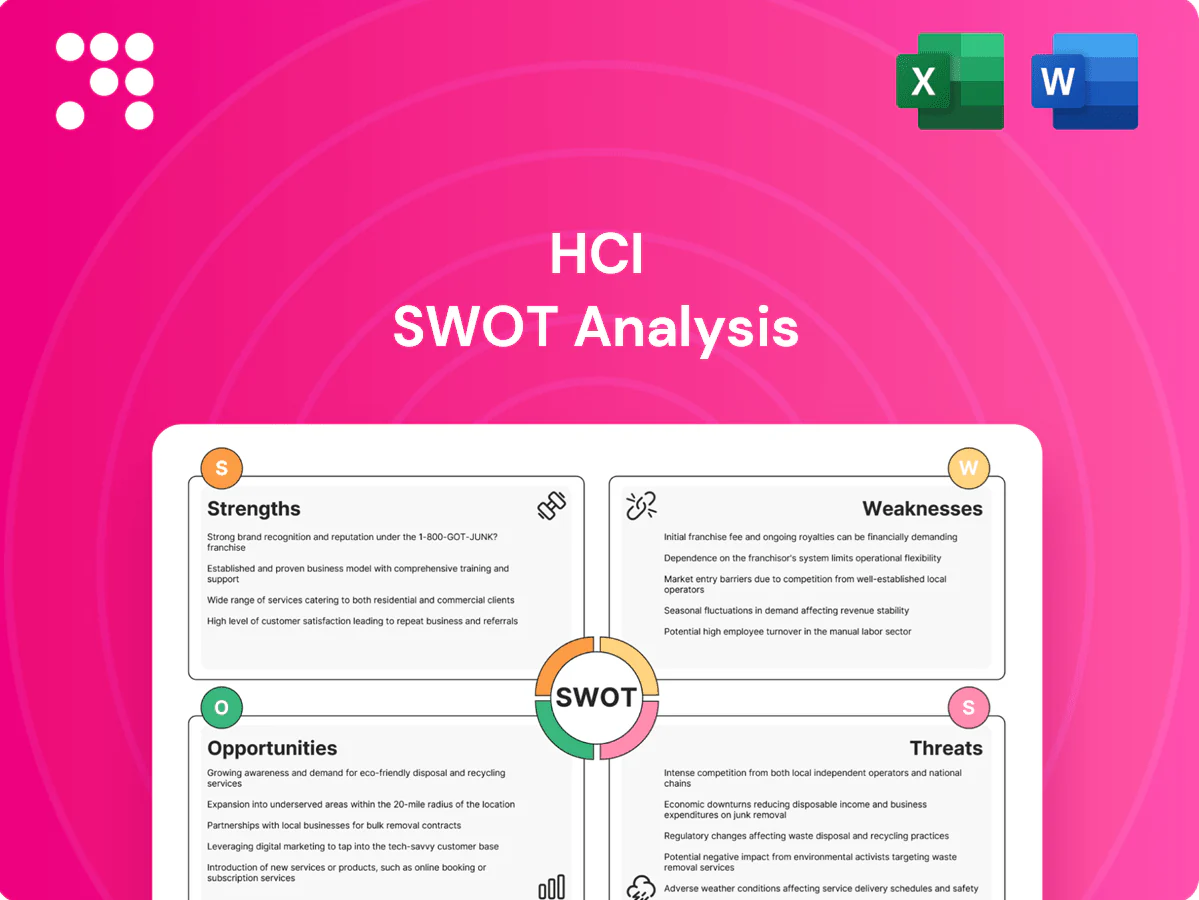
HCI SWOT Analysis

Go Beyond the Preview—Access the Full Strategic Report
Gain a clear snapshot of HCI’s competitive strengths, operational weaknesses, market opportunities, and threat landscape in this concise SWOT overview. For strategic depth, purchase the full SWOT analysis to access detailed, research-backed insights, financial context, and an editable Word + Excel package. Use it to pitch, plan, or invest with confidence.
Strengths

Focused Florida underwriting expertise
HCI’s deep operating knowledge of Florida’s residential market—serving homeowners in a state of about 22.2 million residents (2024 est.)—supports more accurate pricing and selection. Decades of experience with hurricane loss patterns improves catastrophe modeling and portfolio steering. Close regulatory familiarity enables faster product and rate actions. This specialization often produces better loss ratios versus less-focused peers.
Integrated insurance and reinsurance capabilities
Operating across primary insurance and reinsurance lets HCI retain or cede risk optimally to match capital targets and smooth volatility. The group can design layered programs that protect capital and even out underwriting results across cycles. Internal underwriting and reinsurance know-how improves counterparty selection and structuring efficiency, lowering total cost of risk over time.

Proprietary insurance technology platforms
HCI’s proprietary platforms automate distribution, underwriting and claims, improving workflow efficiency and supporting data-driven decisions that historically can reduce insurer operating costs by up to 30% (McKinsey). Selling these solutions to third parties generates scalable, fee-based revenue with low capital intensity, while third-party use creates feedback loops that measurably enhance core underwriting and loss-control performance.

Agile capital and risk management
Lean corporate structure lets HCI rapidly adjust exposure, rates, and deductibles to shifting loss patterns, and NOAA's 2024 Atlantic hurricane outlook projects above-normal activity which heightens the value of such agility. Responsive reinsurance placement mirrors changing catastrophe views and market pricing, while capital allocation across segments targets risk-adjusted returns in volatile coastal markets.
- Quick exposure shifts
- Reinsurance responsiveness
- Segmented capital allocation
- Crucial for 2024 coastal volatility
Niche brand and partner relationships
Specialization fosters deep ties with agents, reinsurers, and service vendors, enabling tailored risk transfer and faster placement. Reliable claims handling in catastrophe-prone regions reinforces customer trust—NOAA recorded 28 US billion-dollar weather/climate disasters in 2023 totaling about $62 billion in losses. Distribution partnerships improve unit economics and support selective growth while helping retention through aligned service models.
- Strong broker/reinsurer ties
- Claims reliability drives trust
- Partnerships lower acquisition friction
- Relationships enable retention and measured expansion
Florida focus: 22.2M market, 30% ops cuts, reinsurance agility vs NOAA risk
HCI’s Florida specialization (22.2 million residents, 2024 est.) delivers superior pricing, loss ratios, and agent/reinsurer ties. Integrated primary/reinsurance programs and agile capital/reinsurance actions limit volatility amid NOAA’s 2024 above‑normal hurricane outlook. Proprietary platforms can cut operating costs up to 30% (McKinsey) while producing scalable fee revenue and better underwriting.
| Metric | Value |
|---|---|
| Florida population (2024) | 22.2M |
| NOAA 2024 outlook | Above‑normal Atlantic activity |
| Op cost reduction | Up to 30% (McKinsey) |
| 2023 US billion‑$ disasters | 28 events, ~$62B losses |
What is included in the product
 Detailed Word Document
Provides a concise strategic overview of HCI’s internal strengths and weaknesses and external opportunities and threats, mapping competitive position, growth drivers, operational gaps, and market risks to inform strategic decision-making.

 Customizable Excel Spreadsheet
Provides an HCI-focused SWOT matrix that highlights usability pain points and strengths for faster remediation and design alignment. Editable, visual layout enables quick stakeholder buy-in and prioritization of user-centered improvements.
Weaknesses

High geographic concentration in Florida
HCI’s underwriting remains highly concentrated in Florida, with over 90% of written premiums stemming from the state, magnifying regulatory and catastrophe exposure. A single severe hurricane season can dominate annual results and capital metrics. Limited geographic diversification versus national carriers reduces risk-pooling benefits and constrains ratings headroom and capital flexibility.
Earnings volatility from hurricanes
Earnings volatility from hurricanes can overwhelm HCI’s underlying profitability despite prudent underwriting; NOAA recorded 18 separate billion-dollar weather/climate disasters in the U.S. in 2023 totaling about $57 billion, highlighting event scale. Even with reinsurance, retention layers and reinstatement costs compress margins and create sizeable cash demands. Sharp post-storm swings in investor sentiment elevate cost of capital and reduce planning visibility.

Dependence on reinsurance market cycles
Hard reinsurance markets have driven price increases of roughly 15–30% in 2023–24 and tighter terms, forcing HCI to redesign programs that can raise net retained risk or cost. Profitability is highly sensitive to June 1 renewals where pricing swings and attachment changes materially affect underwriting margins. Counterparty capacity constraints—market capacity near USD 650bn in 2024—can cap HCI growth if large treaty slots shrink.

Smaller scale versus national peers
HCI's smaller premium base limits fixed-cost leverage and bargaining power with reinsurers and service vendors; top five US carriers held roughly 50% of market premiums in 2024, underscoring scale gaps. Narrower brand reach and distribution breadth constrain new-business flow versus national peers. Scale disadvantages can push HCI's expense and acquisition ratios above industry leaders.
- Lower premium base reduces fixed-cost leverage
- Weaker reinsurance/service purchasing power
- Narrower brand reach and distribution breadth
- Higher expense and acquisition ratios versus mega-carriers
Technology segment still relatively narrow
HCI's technology segment remains narrow: software revenue is small relative to core insurance premiums, creating limited diversification and higher volatility. Heavy client concentration makes tech income lumpy and timing-sensitive. Sustaining parity with competitors demands continuous R&D investment, while monetization often trails product capability in conservative client markets.
- software-revenue-share: modest vs premiums
- client-concentration: increases lumpiness
- rd-burden: ongoing to stay competitive
- monetization-gap: conservative markets delay revenue
>90% Florida exposure fuels hurricane losses (~$57B)
HCI’s underwriting is >90% concentrated in Florida, magnifying regulatory and catastrophe exposure and limiting risk-pooling versus national peers. Earnings volatility from hurricanes is acute—NOAA recorded 18 US billion-dollar disasters in 2023 totaling about $57B—pressuring capital and liquidity. Hard reinsurance markets (price rises ~15–30% in 2023–24) and constrained market capacity (~USD 650bn in 2024) raise costs and cap growth.
| Weakness | Metric/State |
|---|---|
| Geographic concentration | >90% premiums in Florida |
| Cat risk volatility | 18 events, ~$57B (2023) |
| Reinsurance pressure | Price +15–30% (2023–24); capacity ~$650B (2024) |
| Scale gap | Top 5 carriers ~50% market (2024) |
Preview Before You Purchase
HCI SWOT Analysis
This HCI SWOT Analysis preview is the exact document you'll receive after purchase—no placeholders or abridgments. It contains the full professional SWOT structure, findings, and editable sections ready for immediate use. Buy now to unlock the complete file.

Go Beyond the Preview—Access the Full Strategic Report
Gain a clear snapshot of HCI’s competitive strengths, operational weaknesses, market opportunities, and threat landscape in this concise SWOT overview. For strategic depth, purchase the full SWOT analysis to access detailed, research-backed insights, financial context, and an editable Word + Excel package. Use it to pitch, plan, or invest with confidence.
Strengths
Focused Florida underwriting expertise
HCI’s deep operating knowledge of Florida’s residential market—serving homeowners in a state of about 22.2 million residents (2024 est.)—supports more accurate pricing and selection. Decades of experience with hurricane loss patterns improves catastrophe modeling and portfolio steering. Close regulatory familiarity enables faster product and rate actions. This specialization often produces better loss ratios versus less-focused peers.
Integrated insurance and reinsurance capabilities
Operating across primary insurance and reinsurance lets HCI retain or cede risk optimally to match capital targets and smooth volatility. The group can design layered programs that protect capital and even out underwriting results across cycles. Internal underwriting and reinsurance know-how improves counterparty selection and structuring efficiency, lowering total cost of risk over time.
Proprietary insurance technology platforms
HCI’s proprietary platforms automate distribution, underwriting and claims, improving workflow efficiency and supporting data-driven decisions that historically can reduce insurer operating costs by up to 30% (McKinsey). Selling these solutions to third parties generates scalable, fee-based revenue with low capital intensity, while third-party use creates feedback loops that measurably enhance core underwriting and loss-control performance.
Agile capital and risk management
Lean corporate structure lets HCI rapidly adjust exposure, rates, and deductibles to shifting loss patterns, and NOAA's 2024 Atlantic hurricane outlook projects above-normal activity which heightens the value of such agility. Responsive reinsurance placement mirrors changing catastrophe views and market pricing, while capital allocation across segments targets risk-adjusted returns in volatile coastal markets.
- Quick exposure shifts
- Reinsurance responsiveness
- Segmented capital allocation
- Crucial for 2024 coastal volatility
Niche brand and partner relationships
Specialization fosters deep ties with agents, reinsurers, and service vendors, enabling tailored risk transfer and faster placement. Reliable claims handling in catastrophe-prone regions reinforces customer trust—NOAA recorded 28 US billion-dollar weather/climate disasters in 2023 totaling about $62 billion in losses. Distribution partnerships improve unit economics and support selective growth while helping retention through aligned service models.
- Strong broker/reinsurer ties
- Claims reliability drives trust
- Partnerships lower acquisition friction
- Relationships enable retention and measured expansion
Florida focus: 22.2M market, 30% ops cuts, reinsurance agility vs NOAA risk
HCI’s Florida specialization (22.2 million residents, 2024 est.) delivers superior pricing, loss ratios, and agent/reinsurer ties. Integrated primary/reinsurance programs and agile capital/reinsurance actions limit volatility amid NOAA’s 2024 above‑normal hurricane outlook. Proprietary platforms can cut operating costs up to 30% (McKinsey) while producing scalable fee revenue and better underwriting.
| Metric | Value |
|---|---|
| Florida population (2024) | 22.2M |
| NOAA 2024 outlook | Above‑normal Atlantic activity |
| Op cost reduction | Up to 30% (McKinsey) |
| 2023 US billion‑$ disasters | 28 events, ~$62B losses |
What is included in the product
Detailed Word Document
Provides a concise strategic overview of HCI’s internal strengths and weaknesses and external opportunities and threats, mapping competitive position, growth drivers, operational gaps, and market risks to inform strategic decision-making.
Customizable Excel Spreadsheet
Provides an HCI-focused SWOT matrix that highlights usability pain points and strengths for faster remediation and design alignment. Editable, visual layout enables quick stakeholder buy-in and prioritization of user-centered improvements.
Weaknesses
High geographic concentration in Florida
HCI’s underwriting remains highly concentrated in Florida, with over 90% of written premiums stemming from the state, magnifying regulatory and catastrophe exposure. A single severe hurricane season can dominate annual results and capital metrics. Limited geographic diversification versus national carriers reduces risk-pooling benefits and constrains ratings headroom and capital flexibility.
Earnings volatility from hurricanes
Earnings volatility from hurricanes can overwhelm HCI’s underlying profitability despite prudent underwriting; NOAA recorded 18 separate billion-dollar weather/climate disasters in the U.S. in 2023 totaling about $57 billion, highlighting event scale. Even with reinsurance, retention layers and reinstatement costs compress margins and create sizeable cash demands. Sharp post-storm swings in investor sentiment elevate cost of capital and reduce planning visibility.
Dependence on reinsurance market cycles
Hard reinsurance markets have driven price increases of roughly 15–30% in 2023–24 and tighter terms, forcing HCI to redesign programs that can raise net retained risk or cost. Profitability is highly sensitive to June 1 renewals where pricing swings and attachment changes materially affect underwriting margins. Counterparty capacity constraints—market capacity near USD 650bn in 2024—can cap HCI growth if large treaty slots shrink.
Smaller scale versus national peers
HCI's smaller premium base limits fixed-cost leverage and bargaining power with reinsurers and service vendors; top five US carriers held roughly 50% of market premiums in 2024, underscoring scale gaps. Narrower brand reach and distribution breadth constrain new-business flow versus national peers. Scale disadvantages can push HCI's expense and acquisition ratios above industry leaders.
- Lower premium base reduces fixed-cost leverage
- Weaker reinsurance/service purchasing power
- Narrower brand reach and distribution breadth
- Higher expense and acquisition ratios versus mega-carriers
Technology segment still relatively narrow
HCI's technology segment remains narrow: software revenue is small relative to core insurance premiums, creating limited diversification and higher volatility. Heavy client concentration makes tech income lumpy and timing-sensitive. Sustaining parity with competitors demands continuous R&D investment, while monetization often trails product capability in conservative client markets.
- software-revenue-share: modest vs premiums
- client-concentration: increases lumpiness
- rd-burden: ongoing to stay competitive
- monetization-gap: conservative markets delay revenue
>90% Florida exposure fuels hurricane losses (~$57B)
HCI’s underwriting is >90% concentrated in Florida, magnifying regulatory and catastrophe exposure and limiting risk-pooling versus national peers. Earnings volatility from hurricanes is acute—NOAA recorded 18 US billion-dollar disasters in 2023 totaling about $57B—pressuring capital and liquidity. Hard reinsurance markets (price rises ~15–30% in 2023–24) and constrained market capacity (~USD 650bn in 2024) raise costs and cap growth.
| Weakness | Metric/State |
|---|---|
| Geographic concentration | >90% premiums in Florida |
| Cat risk volatility | 18 events, ~$57B (2023) |
| Reinsurance pressure | Price +15–30% (2023–24); capacity ~$650B (2024) |
| Scale gap | Top 5 carriers ~50% market (2024) |
Preview Before You Purchase
HCI SWOT Analysis
This HCI SWOT Analysis preview is the exact document you'll receive after purchase—no placeholders or abridgments. It contains the full professional SWOT structure, findings, and editable sections ready for immediate use. Buy now to unlock the complete file.
Description
Go Beyond the Preview—Access the Full Strategic Report
Gain a clear snapshot of HCI’s competitive strengths, operational weaknesses, market opportunities, and threat landscape in this concise SWOT overview. For strategic depth, purchase the full SWOT analysis to access detailed, research-backed insights, financial context, and an editable Word + Excel package. Use it to pitch, plan, or invest with confidence.
Strengths
Focused Florida underwriting expertise
HCI’s deep operating knowledge of Florida’s residential market—serving homeowners in a state of about 22.2 million residents (2024 est.)—supports more accurate pricing and selection. Decades of experience with hurricane loss patterns improves catastrophe modeling and portfolio steering. Close regulatory familiarity enables faster product and rate actions. This specialization often produces better loss ratios versus less-focused peers.
Integrated insurance and reinsurance capabilities
Operating across primary insurance and reinsurance lets HCI retain or cede risk optimally to match capital targets and smooth volatility. The group can design layered programs that protect capital and even out underwriting results across cycles. Internal underwriting and reinsurance know-how improves counterparty selection and structuring efficiency, lowering total cost of risk over time.
Proprietary insurance technology platforms
HCI’s proprietary platforms automate distribution, underwriting and claims, improving workflow efficiency and supporting data-driven decisions that historically can reduce insurer operating costs by up to 30% (McKinsey). Selling these solutions to third parties generates scalable, fee-based revenue with low capital intensity, while third-party use creates feedback loops that measurably enhance core underwriting and loss-control performance.
Agile capital and risk management
Lean corporate structure lets HCI rapidly adjust exposure, rates, and deductibles to shifting loss patterns, and NOAA's 2024 Atlantic hurricane outlook projects above-normal activity which heightens the value of such agility. Responsive reinsurance placement mirrors changing catastrophe views and market pricing, while capital allocation across segments targets risk-adjusted returns in volatile coastal markets.
- Quick exposure shifts
- Reinsurance responsiveness
- Segmented capital allocation
- Crucial for 2024 coastal volatility
Niche brand and partner relationships
Specialization fosters deep ties with agents, reinsurers, and service vendors, enabling tailored risk transfer and faster placement. Reliable claims handling in catastrophe-prone regions reinforces customer trust—NOAA recorded 28 US billion-dollar weather/climate disasters in 2023 totaling about $62 billion in losses. Distribution partnerships improve unit economics and support selective growth while helping retention through aligned service models.
- Strong broker/reinsurer ties
- Claims reliability drives trust
- Partnerships lower acquisition friction
- Relationships enable retention and measured expansion
Florida focus: 22.2M market, 30% ops cuts, reinsurance agility vs NOAA risk
HCI’s Florida specialization (22.2 million residents, 2024 est.) delivers superior pricing, loss ratios, and agent/reinsurer ties. Integrated primary/reinsurance programs and agile capital/reinsurance actions limit volatility amid NOAA’s 2024 above‑normal hurricane outlook. Proprietary platforms can cut operating costs up to 30% (McKinsey) while producing scalable fee revenue and better underwriting.
| Metric | Value |
|---|---|
| Florida population (2024) | 22.2M |
| NOAA 2024 outlook | Above‑normal Atlantic activity |
| Op cost reduction | Up to 30% (McKinsey) |
| 2023 US billion‑$ disasters | 28 events, ~$62B losses |
What is included in the product
Detailed Word Document
Provides a concise strategic overview of HCI’s internal strengths and weaknesses and external opportunities and threats, mapping competitive position, growth drivers, operational gaps, and market risks to inform strategic decision-making.
Customizable Excel Spreadsheet
Provides an HCI-focused SWOT matrix that highlights usability pain points and strengths for faster remediation and design alignment. Editable, visual layout enables quick stakeholder buy-in and prioritization of user-centered improvements.
Weaknesses
High geographic concentration in Florida
HCI’s underwriting remains highly concentrated in Florida, with over 90% of written premiums stemming from the state, magnifying regulatory and catastrophe exposure. A single severe hurricane season can dominate annual results and capital metrics. Limited geographic diversification versus national carriers reduces risk-pooling benefits and constrains ratings headroom and capital flexibility.
Earnings volatility from hurricanes
Earnings volatility from hurricanes can overwhelm HCI’s underlying profitability despite prudent underwriting; NOAA recorded 18 separate billion-dollar weather/climate disasters in the U.S. in 2023 totaling about $57 billion, highlighting event scale. Even with reinsurance, retention layers and reinstatement costs compress margins and create sizeable cash demands. Sharp post-storm swings in investor sentiment elevate cost of capital and reduce planning visibility.
Dependence on reinsurance market cycles
Hard reinsurance markets have driven price increases of roughly 15–30% in 2023–24 and tighter terms, forcing HCI to redesign programs that can raise net retained risk or cost. Profitability is highly sensitive to June 1 renewals where pricing swings and attachment changes materially affect underwriting margins. Counterparty capacity constraints—market capacity near USD 650bn in 2024—can cap HCI growth if large treaty slots shrink.
Smaller scale versus national peers
HCI's smaller premium base limits fixed-cost leverage and bargaining power with reinsurers and service vendors; top five US carriers held roughly 50% of market premiums in 2024, underscoring scale gaps. Narrower brand reach and distribution breadth constrain new-business flow versus national peers. Scale disadvantages can push HCI's expense and acquisition ratios above industry leaders.
- Lower premium base reduces fixed-cost leverage
- Weaker reinsurance/service purchasing power
- Narrower brand reach and distribution breadth
- Higher expense and acquisition ratios versus mega-carriers
Technology segment still relatively narrow
HCI's technology segment remains narrow: software revenue is small relative to core insurance premiums, creating limited diversification and higher volatility. Heavy client concentration makes tech income lumpy and timing-sensitive. Sustaining parity with competitors demands continuous R&D investment, while monetization often trails product capability in conservative client markets.
- software-revenue-share: modest vs premiums
- client-concentration: increases lumpiness
- rd-burden: ongoing to stay competitive
- monetization-gap: conservative markets delay revenue
>90% Florida exposure fuels hurricane losses (~$57B)
HCI’s underwriting is >90% concentrated in Florida, magnifying regulatory and catastrophe exposure and limiting risk-pooling versus national peers. Earnings volatility from hurricanes is acute—NOAA recorded 18 US billion-dollar disasters in 2023 totaling about $57B—pressuring capital and liquidity. Hard reinsurance markets (price rises ~15–30% in 2023–24) and constrained market capacity (~USD 650bn in 2024) raise costs and cap growth.
| Weakness | Metric/State |
|---|---|
| Geographic concentration | >90% premiums in Florida |
| Cat risk volatility | 18 events, ~$57B (2023) |
| Reinsurance pressure | Price +15–30% (2023–24); capacity ~$650B (2024) |
| Scale gap | Top 5 carriers ~50% market (2024) |
Preview Before You Purchase
HCI SWOT Analysis
This HCI SWOT Analysis preview is the exact document you'll receive after purchase—no placeholders or abridgments. It contains the full professional SWOT structure, findings, and editable sections ready for immediate use. Buy now to unlock the complete file.











