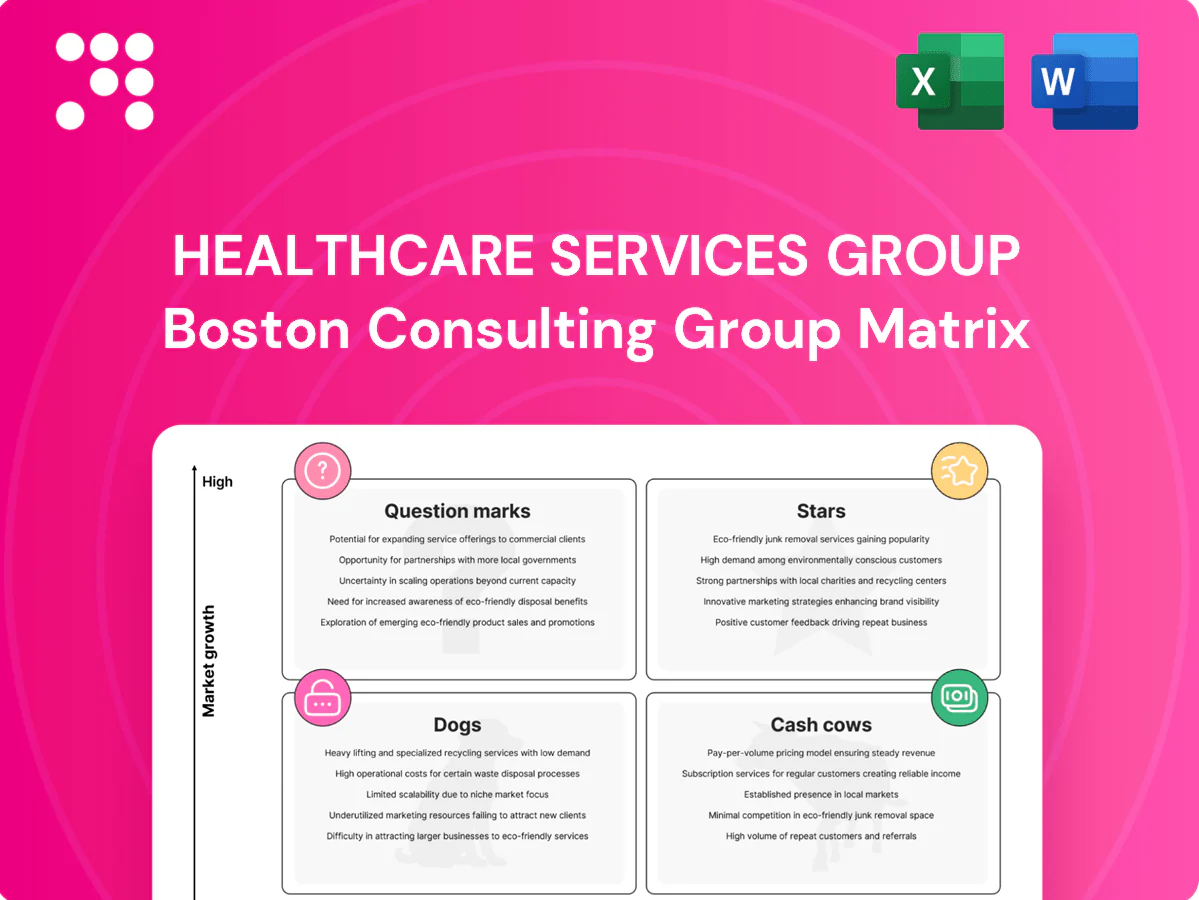
Healthcare Services Group Boston Consulting Group Matrix

Visual. Strategic. Downloadable.
Healthcare Services Group’s BCG Matrix snapshot shows which services are fueling growth and which are quietly draining cash—ideal if you’re deciding where to double down. This preview teases quadrant placements, but the full report gives the exact Stars, Cash Cows, Dogs and Question Marks with data-backed reasoning. Purchase the complete BCG Matrix for detailed quadrant maps, actionable strategic moves, and ready-to-use Word and Excel files. Get clarity fast and start reallocating capital where it actually matters.
Stars

Infection-focused housekeeping in post-acute
High-share offering in nursing and rehab where infection control is life-or-death; CMS enforcement and survey readiness keep demand hot as facilities push to lower HAIs. CDC data links antibiotic-resistant infections to over 35,000 deaths annually, underscoring urgency and referral value. It burns cash on training, chemical standards, and audits but builds loyalty; sustained investment lets it mature into a margin machine as growth normalizes.
Clinical dining & nutrition in high-growth senior markets
Sunbelt and fast-aging metros are adding beds as the US 65+ population reached about 58 million in 2024 (US Census), making diet-driven outcomes a material clinical lever. HCSG’s dietary programs are integrated into care plans, supporting premium pricing and higher renewal rates. Marketing and registered dietitian staffing raise operating costs, but demand growth in these metros offsets investment. Holding share positions HCSG as the default vendor as markets mature.

Enterprise MSAs with multi-state operators
Enterprise MSAs with multi-state operators deliver one contract, one SOP, one dashboard, bundling volume and predictability; onboarding, tech platforms and field leadership commonly require seven-figure investments. These deals lock in referral streams, and once stabilized drive scale efficiencies that typically expand margins materially. Protect them relentlessly—today’s growth engine, tomorrow’s cash cow.

Quality & compliance dashboards (survey readiness)
Digitized logs, audits, temperature checks and corrective-action workflows give admins air cover and cut survey prep time; adoption of compliance dashboards rose ~28% YoY into 2024 as regulators tightened inspection expectations. Building and supporting the stack costs real dollars but cements stickiness and enables upsell, anchoring higher-margin service tiers as usage and renewal rates climb.
- Adoption: ~28% YoY growth (2023–2024)
- Market signal: increased regulator inspections in 2024
- Business impact: higher retention and upsell from dashboard-led services
- Cost: nontrivial build/support expense but drives margin expansion
Rapid-turn labor model and float teams
Rapid-turn labor models and float teams win on speed-to-staff during call-offs or census spikes, with 2024 industry reports showing 90–95% fill rates and 20–40% reductions in agency spend; they boost retention (~10–15%) and save clients an estimated $150k–$300k per facility annually. Operationally intense—requires rigorous training, dynamic routing and strict overtime controls; nail utilization and it scales into a durable advantage.
- Speed: 90–95% fill rates (2024)
- Cost: 20–40% agency spend cut (2024)
- Retention: +10–15% (2024)
- Ops: training, routing, OT controls
- Leverage: utilization = scalable moat
High-share nursing fuels growth as HAI cuts and aging 65+ surge boost bed demand
High-share nursing/rehab services drive rapid growth as CMS/CDC focus cuts HAIs (35,000+ deaths linked to resistant infections) and US 65+ ~58M in 2024 boosts bed demand. Investments in training, tech and diet programs compress near-term margins but create sticky, upsellable higher-margin tiers. Enterprise MSAs and rapid-turn labor (90–95% fill; 20–40% agency spend cut) lock referrals and scale margins.
| Metric | 2024 |
|---|---|
| 65+ population | ~58M |
| HAI deaths (antibiotic-resistant) | 35,000+ |
| Dashboard adoption YoY | +28% |
| Fill rates | 90–95% |
What is included in the product
 Detailed Word Document
BCG Matrix for Healthcare Services Group: maps Stars, Cash Cows, Question Marks and Dogs with clear investment and divestment guidance.

 Customizable Excel Spreadsheet
One-page BCG matrix mapping each healthcare unit to a quadrant, simplifying portfolio decisions.
Cash Cows

Core environmental services in mature SNFs
Core environmental services in mature SNFs show stable census (about 77% occupancy in 2024) with routine workflows and predictable outcomes, supporting high share/low growth positioning. Operating model: low promo spend, labor ~63% of operating costs, typical EBITDA margins near 8% in 2024. Focus on keeping quality tight, staffing reliable, milking margins and channeling excess cash into growth bets.
Laundry & linen management at scale
Well-worn SOPs and optimized throughput drive dependable costs in large-scale laundry & linen management, with client churn typically low (around 6–8% annually) due to high switching friction. Margins rise 200–400 basis points as route density and chemical standardization scale, and equipment refreshes (payback 18–36 months) can unlock incremental cash flow, trimming unit costs by 3–5%.

Standard menu cycles and diet templates
The playbook is built: costed menus, seasonal rotations and therapeutic variants that HCSG leveraged to support scale; in 2024 Healthcare Services Group reported approximately $1.18B in revenue, with foodservice margins supported by standardized offerings. Training is repeatable and waste is controlled, typically cutting kitchen waste by double-digit percentages versus ad hoc programs. Not flashy, it throws off cash monthly—maintain variety and compliance, avoid bloat.

Centralized purchasing and vendor leverage
Centralized purchasing drives volume buys for food, disposables and chemicals that typically yield 8–12% unit cost savings across large healthcare systems (2024 GPO benchmarks), enabling a pass-through with a 2–4% clip that creates dependable contribution. Growth is minimal but highly defensible; guard contracts and refresh SKUs annually to enforce inflation discipline.
- Volume savings: 8–12%
- Clip contribution: 2–4% EBIT
- Market position: low growth, high defensibility
- Actions: protect contracts, annual SKU refresh for inflation
Routine audit programs and survey prep
Routine audit programs and survey prep
Routine checklists, mock surveys and corrective action plans are low lift with high perceived value, keeping clients calm before inspectors arrive. Repeatable content yields tidy margins and scalable throughput; standardizing reports and minimizing custom work drives efficiency and faster delivery.- Checklists
- Mock surveys
- Corrective plans
- Standardized reports
Mature SNFs: 77% occ, 8% EBITDA, lab 63%
Core services in mature SNFs: ~77% occupancy in 2024, labor ~63% of operating costs, EBITDA ~8%, delivering steady cash flow; client churn 6–8%. Centralized purchasing yields 8–12% unit savings with a 2–4% clip; equipment refresh payback 18–36 months. Strategy: protect contracts, enforce annual SKU refreshes, channel excess cash to growth bets.
| Metric | 2024 |
|---|---|
| Revenue | $1.18B |
| Occupancy | 77% |
| EBITDA | ~8% |
| Labor | ~63% |
| Churn | 6–8% |
| Volume savings | 8–12% |
| Clip | 2–4% |
Delivered as Shown
Healthcare Services Group BCG Matrix
The file you're previewing is the exact Healthcare Services Group BCG Matrix you'll receive after purchase. No watermarks or demo text—just the fully formatted, strategy-ready report designed for clear decision-making. It arrives as a clean, editable file you can present, print, or plug into your planning right away. Buy once, download immediately—no surprises, no revisions needed.

Visual. Strategic. Downloadable.
Healthcare Services Group’s BCG Matrix snapshot shows which services are fueling growth and which are quietly draining cash—ideal if you’re deciding where to double down. This preview teases quadrant placements, but the full report gives the exact Stars, Cash Cows, Dogs and Question Marks with data-backed reasoning. Purchase the complete BCG Matrix for detailed quadrant maps, actionable strategic moves, and ready-to-use Word and Excel files. Get clarity fast and start reallocating capital where it actually matters.
Stars
Infection-focused housekeeping in post-acute
High-share offering in nursing and rehab where infection control is life-or-death; CMS enforcement and survey readiness keep demand hot as facilities push to lower HAIs. CDC data links antibiotic-resistant infections to over 35,000 deaths annually, underscoring urgency and referral value. It burns cash on training, chemical standards, and audits but builds loyalty; sustained investment lets it mature into a margin machine as growth normalizes.
Clinical dining & nutrition in high-growth senior markets
Sunbelt and fast-aging metros are adding beds as the US 65+ population reached about 58 million in 2024 (US Census), making diet-driven outcomes a material clinical lever. HCSG’s dietary programs are integrated into care plans, supporting premium pricing and higher renewal rates. Marketing and registered dietitian staffing raise operating costs, but demand growth in these metros offsets investment. Holding share positions HCSG as the default vendor as markets mature.
Enterprise MSAs with multi-state operators
Enterprise MSAs with multi-state operators deliver one contract, one SOP, one dashboard, bundling volume and predictability; onboarding, tech platforms and field leadership commonly require seven-figure investments. These deals lock in referral streams, and once stabilized drive scale efficiencies that typically expand margins materially. Protect them relentlessly—today’s growth engine, tomorrow’s cash cow.
Quality & compliance dashboards (survey readiness)
Digitized logs, audits, temperature checks and corrective-action workflows give admins air cover and cut survey prep time; adoption of compliance dashboards rose ~28% YoY into 2024 as regulators tightened inspection expectations. Building and supporting the stack costs real dollars but cements stickiness and enables upsell, anchoring higher-margin service tiers as usage and renewal rates climb.
- Adoption: ~28% YoY growth (2023–2024)
- Market signal: increased regulator inspections in 2024
- Business impact: higher retention and upsell from dashboard-led services
- Cost: nontrivial build/support expense but drives margin expansion
Rapid-turn labor model and float teams
Rapid-turn labor models and float teams win on speed-to-staff during call-offs or census spikes, with 2024 industry reports showing 90–95% fill rates and 20–40% reductions in agency spend; they boost retention (~10–15%) and save clients an estimated $150k–$300k per facility annually. Operationally intense—requires rigorous training, dynamic routing and strict overtime controls; nail utilization and it scales into a durable advantage.
- Speed: 90–95% fill rates (2024)
- Cost: 20–40% agency spend cut (2024)
- Retention: +10–15% (2024)
- Ops: training, routing, OT controls
- Leverage: utilization = scalable moat
High-share nursing fuels growth as HAI cuts and aging 65+ surge boost bed demand
High-share nursing/rehab services drive rapid growth as CMS/CDC focus cuts HAIs (35,000+ deaths linked to resistant infections) and US 65+ ~58M in 2024 boosts bed demand. Investments in training, tech and diet programs compress near-term margins but create sticky, upsellable higher-margin tiers. Enterprise MSAs and rapid-turn labor (90–95% fill; 20–40% agency spend cut) lock referrals and scale margins.
| Metric | 2024 |
|---|---|
| 65+ population | ~58M |
| HAI deaths (antibiotic-resistant) | 35,000+ |
| Dashboard adoption YoY | +28% |
| Fill rates | 90–95% |
What is included in the product
Detailed Word Document
BCG Matrix for Healthcare Services Group: maps Stars, Cash Cows, Question Marks and Dogs with clear investment and divestment guidance.
Customizable Excel Spreadsheet
One-page BCG matrix mapping each healthcare unit to a quadrant, simplifying portfolio decisions.
Cash Cows
Core environmental services in mature SNFs
Core environmental services in mature SNFs show stable census (about 77% occupancy in 2024) with routine workflows and predictable outcomes, supporting high share/low growth positioning. Operating model: low promo spend, labor ~63% of operating costs, typical EBITDA margins near 8% in 2024. Focus on keeping quality tight, staffing reliable, milking margins and channeling excess cash into growth bets.
Laundry & linen management at scale
Well-worn SOPs and optimized throughput drive dependable costs in large-scale laundry & linen management, with client churn typically low (around 6–8% annually) due to high switching friction. Margins rise 200–400 basis points as route density and chemical standardization scale, and equipment refreshes (payback 18–36 months) can unlock incremental cash flow, trimming unit costs by 3–5%.
Standard menu cycles and diet templates
The playbook is built: costed menus, seasonal rotations and therapeutic variants that HCSG leveraged to support scale; in 2024 Healthcare Services Group reported approximately $1.18B in revenue, with foodservice margins supported by standardized offerings. Training is repeatable and waste is controlled, typically cutting kitchen waste by double-digit percentages versus ad hoc programs. Not flashy, it throws off cash monthly—maintain variety and compliance, avoid bloat.
Centralized purchasing and vendor leverage
Centralized purchasing drives volume buys for food, disposables and chemicals that typically yield 8–12% unit cost savings across large healthcare systems (2024 GPO benchmarks), enabling a pass-through with a 2–4% clip that creates dependable contribution. Growth is minimal but highly defensible; guard contracts and refresh SKUs annually to enforce inflation discipline.
- Volume savings: 8–12%
- Clip contribution: 2–4% EBIT
- Market position: low growth, high defensibility
- Actions: protect contracts, annual SKU refresh for inflation
Routine audit programs and survey prep
Routine audit programs and survey prep
Routine checklists, mock surveys and corrective action plans are low lift with high perceived value, keeping clients calm before inspectors arrive. Repeatable content yields tidy margins and scalable throughput; standardizing reports and minimizing custom work drives efficiency and faster delivery.- Checklists
- Mock surveys
- Corrective plans
- Standardized reports
Mature SNFs: 77% occ, 8% EBITDA, lab 63%
Core services in mature SNFs: ~77% occupancy in 2024, labor ~63% of operating costs, EBITDA ~8%, delivering steady cash flow; client churn 6–8%. Centralized purchasing yields 8–12% unit savings with a 2–4% clip; equipment refresh payback 18–36 months. Strategy: protect contracts, enforce annual SKU refreshes, channel excess cash to growth bets.
| Metric | 2024 |
|---|---|
| Revenue | $1.18B |
| Occupancy | 77% |
| EBITDA | ~8% |
| Labor | ~63% |
| Churn | 6–8% |
| Volume savings | 8–12% |
| Clip | 2–4% |
Delivered as Shown
Healthcare Services Group BCG Matrix
The file you're previewing is the exact Healthcare Services Group BCG Matrix you'll receive after purchase. No watermarks or demo text—just the fully formatted, strategy-ready report designed for clear decision-making. It arrives as a clean, editable file you can present, print, or plug into your planning right away. Buy once, download immediately—no surprises, no revisions needed.
Description
Visual. Strategic. Downloadable.
Healthcare Services Group’s BCG Matrix snapshot shows which services are fueling growth and which are quietly draining cash—ideal if you’re deciding where to double down. This preview teases quadrant placements, but the full report gives the exact Stars, Cash Cows, Dogs and Question Marks with data-backed reasoning. Purchase the complete BCG Matrix for detailed quadrant maps, actionable strategic moves, and ready-to-use Word and Excel files. Get clarity fast and start reallocating capital where it actually matters.
Stars
Infection-focused housekeeping in post-acute
High-share offering in nursing and rehab where infection control is life-or-death; CMS enforcement and survey readiness keep demand hot as facilities push to lower HAIs. CDC data links antibiotic-resistant infections to over 35,000 deaths annually, underscoring urgency and referral value. It burns cash on training, chemical standards, and audits but builds loyalty; sustained investment lets it mature into a margin machine as growth normalizes.
Clinical dining & nutrition in high-growth senior markets
Sunbelt and fast-aging metros are adding beds as the US 65+ population reached about 58 million in 2024 (US Census), making diet-driven outcomes a material clinical lever. HCSG’s dietary programs are integrated into care plans, supporting premium pricing and higher renewal rates. Marketing and registered dietitian staffing raise operating costs, but demand growth in these metros offsets investment. Holding share positions HCSG as the default vendor as markets mature.
Enterprise MSAs with multi-state operators
Enterprise MSAs with multi-state operators deliver one contract, one SOP, one dashboard, bundling volume and predictability; onboarding, tech platforms and field leadership commonly require seven-figure investments. These deals lock in referral streams, and once stabilized drive scale efficiencies that typically expand margins materially. Protect them relentlessly—today’s growth engine, tomorrow’s cash cow.
Quality & compliance dashboards (survey readiness)
Digitized logs, audits, temperature checks and corrective-action workflows give admins air cover and cut survey prep time; adoption of compliance dashboards rose ~28% YoY into 2024 as regulators tightened inspection expectations. Building and supporting the stack costs real dollars but cements stickiness and enables upsell, anchoring higher-margin service tiers as usage and renewal rates climb.
- Adoption: ~28% YoY growth (2023–2024)
- Market signal: increased regulator inspections in 2024
- Business impact: higher retention and upsell from dashboard-led services
- Cost: nontrivial build/support expense but drives margin expansion
Rapid-turn labor model and float teams
Rapid-turn labor models and float teams win on speed-to-staff during call-offs or census spikes, with 2024 industry reports showing 90–95% fill rates and 20–40% reductions in agency spend; they boost retention (~10–15%) and save clients an estimated $150k–$300k per facility annually. Operationally intense—requires rigorous training, dynamic routing and strict overtime controls; nail utilization and it scales into a durable advantage.
- Speed: 90–95% fill rates (2024)
- Cost: 20–40% agency spend cut (2024)
- Retention: +10–15% (2024)
- Ops: training, routing, OT controls
- Leverage: utilization = scalable moat
High-share nursing fuels growth as HAI cuts and aging 65+ surge boost bed demand
High-share nursing/rehab services drive rapid growth as CMS/CDC focus cuts HAIs (35,000+ deaths linked to resistant infections) and US 65+ ~58M in 2024 boosts bed demand. Investments in training, tech and diet programs compress near-term margins but create sticky, upsellable higher-margin tiers. Enterprise MSAs and rapid-turn labor (90–95% fill; 20–40% agency spend cut) lock referrals and scale margins.
| Metric | 2024 |
|---|---|
| 65+ population | ~58M |
| HAI deaths (antibiotic-resistant) | 35,000+ |
| Dashboard adoption YoY | +28% |
| Fill rates | 90–95% |
What is included in the product
Detailed Word Document
BCG Matrix for Healthcare Services Group: maps Stars, Cash Cows, Question Marks and Dogs with clear investment and divestment guidance.
Customizable Excel Spreadsheet
One-page BCG matrix mapping each healthcare unit to a quadrant, simplifying portfolio decisions.
Cash Cows
Core environmental services in mature SNFs
Core environmental services in mature SNFs show stable census (about 77% occupancy in 2024) with routine workflows and predictable outcomes, supporting high share/low growth positioning. Operating model: low promo spend, labor ~63% of operating costs, typical EBITDA margins near 8% in 2024. Focus on keeping quality tight, staffing reliable, milking margins and channeling excess cash into growth bets.
Laundry & linen management at scale
Well-worn SOPs and optimized throughput drive dependable costs in large-scale laundry & linen management, with client churn typically low (around 6–8% annually) due to high switching friction. Margins rise 200–400 basis points as route density and chemical standardization scale, and equipment refreshes (payback 18–36 months) can unlock incremental cash flow, trimming unit costs by 3–5%.
Standard menu cycles and diet templates
The playbook is built: costed menus, seasonal rotations and therapeutic variants that HCSG leveraged to support scale; in 2024 Healthcare Services Group reported approximately $1.18B in revenue, with foodservice margins supported by standardized offerings. Training is repeatable and waste is controlled, typically cutting kitchen waste by double-digit percentages versus ad hoc programs. Not flashy, it throws off cash monthly—maintain variety and compliance, avoid bloat.
Centralized purchasing and vendor leverage
Centralized purchasing drives volume buys for food, disposables and chemicals that typically yield 8–12% unit cost savings across large healthcare systems (2024 GPO benchmarks), enabling a pass-through with a 2–4% clip that creates dependable contribution. Growth is minimal but highly defensible; guard contracts and refresh SKUs annually to enforce inflation discipline.
- Volume savings: 8–12%
- Clip contribution: 2–4% EBIT
- Market position: low growth, high defensibility
- Actions: protect contracts, annual SKU refresh for inflation
Routine audit programs and survey prep
Routine audit programs and survey prep
Routine checklists, mock surveys and corrective action plans are low lift with high perceived value, keeping clients calm before inspectors arrive. Repeatable content yields tidy margins and scalable throughput; standardizing reports and minimizing custom work drives efficiency and faster delivery.- Checklists
- Mock surveys
- Corrective plans
- Standardized reports
Mature SNFs: 77% occ, 8% EBITDA, lab 63%
Core services in mature SNFs: ~77% occupancy in 2024, labor ~63% of operating costs, EBITDA ~8%, delivering steady cash flow; client churn 6–8%. Centralized purchasing yields 8–12% unit savings with a 2–4% clip; equipment refresh payback 18–36 months. Strategy: protect contracts, enforce annual SKU refreshes, channel excess cash to growth bets.
| Metric | 2024 |
|---|---|
| Revenue | $1.18B |
| Occupancy | 77% |
| EBITDA | ~8% |
| Labor | ~63% |
| Churn | 6–8% |
| Volume savings | 8–12% |
| Clip | 2–4% |
Delivered as Shown
Healthcare Services Group BCG Matrix
The file you're previewing is the exact Healthcare Services Group BCG Matrix you'll receive after purchase. No watermarks or demo text—just the fully formatted, strategy-ready report designed for clear decision-making. It arrives as a clean, editable file you can present, print, or plug into your planning right away. Buy once, download immediately—no surprises, no revisions needed.











