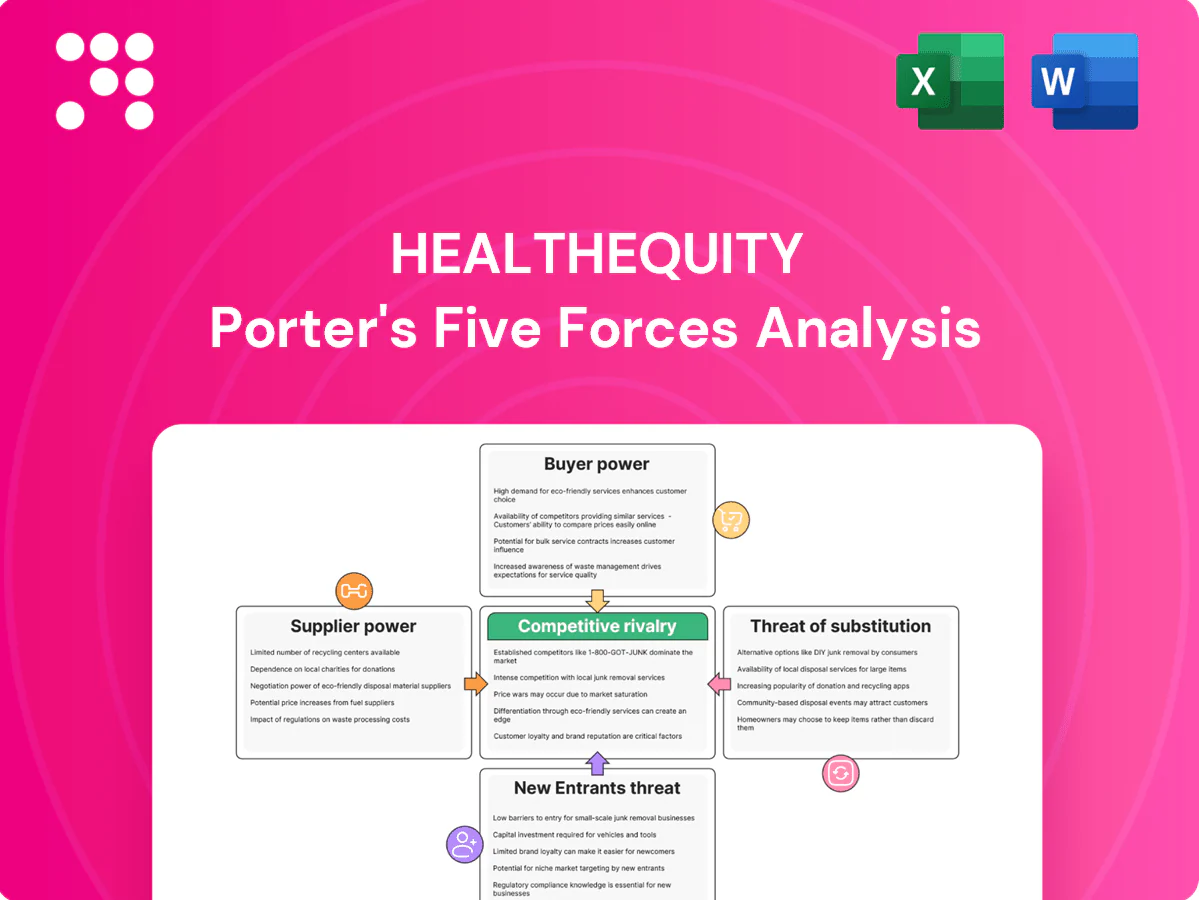
HealthEquity Porter's Five Forces Analysis

A Must-Have Tool for Decision-Makers
HealthEquity faces moderate buyer power, specialized supplier relationships, and rising substitute threats from digital health platforms, shaping a competitive but opportunity-rich landscape. This snapshot highlights key pressures on margins and growth potential for strategic planning. Ready to move beyond the basics? Unlock the full Porter's Five Forces Analysis for detailed ratings, visuals, and actionable insights.
Suppliers Bargaining Power

Concentrated custodial banks
HSAs require qualified custodians and the niche is concentrated, with HSA assets topping >$100 billion (Devenir, 2023), giving a few custodial banks leverage over fees, float-sharing, and service terms. HealthEquity reduces risk via multi-sourcing and integrating custody into its platform, but switching costs and compliance complexity keep supplier power moderate.
Card networks and payment processors
Card issuers and networks (Visa and Mastercard account for roughly 80% of US card volume) are essential to HSA debit functionality at point of care, making their rules pivotal to HealthEquity operations. Interchange structures and chargeback rules, alongside mandates like the Durbin debit cap (0.21% of transaction value + $0.01 for large banks), can compress margins. Redundant processors mitigate risk but certifications and integrations create high switching costs, and strong network brands increase supplier leverage.

Investment fund managers
HSA investment menus rely on third‑party mutual funds and ETFs, with well‑known managers (BlackRock, Vanguard, Fidelity) holding multitrillion-dollar AUM in 2024, which secures shelf space and revenue‑sharing economics. HealthEquity offsets concentration via open‑architecture menus and tiered fund options. Market volatility in 2024 prompted faster fund lineup changes, increasing operational and coordination costs.

Cloud, data, and cybersecurity vendors
HIPAA-compliant hosting, data pipelines, and security tools are mission-critical for HealthEquity, with top cloud providers (AWS ~33%, Microsoft Azure ~23%, Google Cloud ~11% in 2024) offering differentiated capabilities that drive high switching costs. Contracts routinely require 99.95%+ uptime SLAs and exhaustive audit trails, increasing supplier bargaining power. Volume discounts and multi-year deals cut unit cost but only partially offset vendor leverage.
- Mission-critical: HIPAA hosting, ETL, security
- Market share 2024: AWS ~33%, Azure ~23%, GCP ~11%
- Contracts: 99.95%+ SLA, audit/compliance demands
- Mitigation: volume discounts, long-term deals
Healthcare data and eligibility feeds
Accurate eligibility, claims, and carrier feeds are essential for adjudication and member education; missed or late feeds increase denials and operational cost exposure in an industry with US healthcare spending of about 4.5 trillion in 2023. Health plans and recordkeepers act as both partners and data suppliers, dictating SLAs and formats (X12, EDI, HL7/FHIR), while fragmented standards raise integration burdens on HealthEquity and elevate supplier influence due to dependence on timely feeds.
- Dependency: timely feeds = higher supplier leverage
- Standards: X12/EDI vs HL7/FHIR fragmentation
- Scale: US healthcare $4.5T (2023)
- Adoption: ~95% hospitals with EHRs (ONC, 2023)
Custodians, card networks and cloud giants create moderate-to-high supplier leverage
Supplier power is moderate-to-high: custodial banks control >$100B HSA assets (Devenir, 2023) enabling fee leverage; card networks (Visa+Mastercard ~80% US volume) and interchange rules compress margins; top fund managers (BlackRock/Vanguard/Fidelity multitrillion AUM, 2024) and cloud providers (AWS ~33%, Azure ~23%, GCP ~11%, 2024) create switching costs despite HealthEquity mitigations.
| Supplier | Key metric | 2023/2024 | Mitigation |
|---|---|---|---|
| Custodians | HSA assets | >$100B (2023) | Multi-sourcing |
| Card networks | Market share | ~80% volume | Redundant processors |
| Cloud | Market share | AWS33% AZ23% GCP11% (2024) | Long-term SLAs |
What is included in the product
 Detailed Word Document
Uncovers key drivers of competition, customer bargaining power, supplier influence, threat of new entrants and substitutes, and disruptive trends specifically shaping HealthEquity’s competitive position, with strategic insights to inform investor materials, internal strategy, or academic analysis.

 Customizable Excel Spreadsheet
A concise, one-sheet Porter's Five Forces analysis tailored for HealthEquity—instantly highlights competitive pressures and regulatory risks to accelerate boardroom decisions. Easy to customize for scenarios and paste into decks or Excel dashboards without macros.
Customers Bargaining Power

Large employers and plan sponsors
Large employers and plan sponsors control a potential pool of employer-sponsored coverage that reached about 157 million people in 2024 (KFF), creating millions of potential HSA accounts and high-stakes procurement. They run formal RFPs, benchmark fees across vendors, and demand custom integrations and reporting, giving them strong price and service leverage. Multi-year contracts are common to lock in scale, but renewals remain highly competitive as buyers routinely rebid and benchmark offerings.
Health plans and recordkeepers
Carriers and retirement recordkeepers can steer distribution at enrollment, negotiating white‑label or co‑branded economics and strict data rights that shape who controls member flow. Their deep integrations with payroll and benefits platforms create high stickiness, making them powerful buyers able to demand preferred pricing and feature commitments. Note: 2024 IRS HSA limits are $4,150 individual and $8,300 family, which influences plan design and negotiation leverage.

Brokers and benefit consultants
Brokers and benefit consultants heavily shape vendor shortlists and plan design, steering placement toward providers with clear fee transparency and measurable participant outcomes. By aggregating demand across thousands of employer clients they amplify negotiating power, pressuring fees and service terms; HealthEquity reported roughly 11.0 million HSA accounts in 2024, illustrating scale. Strong broker relationships and documented outcomes can blunt buyer leverage and secure placements.

Individual account holders
Individual account holders can switch providers when changing jobs or via trustee‑to‑trustee transfers; lower balances drive price sensitivity while investor segments prioritize investment menus and features, raising churn risk. User experience and breadth of investment options materially affect retention, though inertia and employer defaults slow immediate switching. 2024 HSA contribution limit: individual 4,150, family 8,300.
- Trustee transfers enable portability
- Low balances => high price sensitivity
- Investors => feature/menu sensitivity
- UX/investment menu → churn risk
- Inertia and employer defaults reduce short‑term switching
Price transparency and benchmarking
Price transparency and widespread fee benchmarking in 2024 have compressed spreads on custody, administration, and investment fees, driving buyers to demand zero-fee cash, tiered pricing, and full revenue-share visibility; outcome metrics such as engagement and ROI are now table stakes in negotiations, elevating buyer power across segments.
- Fee compression: benchmarking common across plan sponsors in 2024
- Buyer demands: zero-fee cash, tiered pricing, revenue-share visibility
- Negotiation metrics: engagement and ROI required
Employers' buying power and carrier distribution squeeze HSA margins under 2024 IRS limits
Large employers (employer‑sponsored coverage ~157 million people in 2024) drive procurement, RFPs and fee benchmarking, shifting leverage to buyers. Carriers/recordkeepers and brokers steer distribution (HealthEquity ~11.0M HSA accounts in 2024), demanding pricing, data and integrations. Fee transparency and 2024 IRS HSA limits (4,150 individual / 8,300 family) compress margins.
| Buyer | 2024 metric | Impact |
|---|---|---|
| Employers | 157M covered | High procurement leverage |
| Carriers/Brokers | HealthEquity 11.0M HSAs | Control distribution |
| Market | IRS limits 4,150/8,300 | Plan design influence |
Full Version Awaits
HealthEquity Porter's Five Forces Analysis
This preview shows the exact HealthEquity Porter's Five Forces analysis you'll receive immediately after purchase—fully formatted and ready for use. It is the final document, not a sample or placeholder, and contains the complete evaluation of competitive forces. Upon payment you get instant access to this identical file.

A Must-Have Tool for Decision-Makers
HealthEquity faces moderate buyer power, specialized supplier relationships, and rising substitute threats from digital health platforms, shaping a competitive but opportunity-rich landscape. This snapshot highlights key pressures on margins and growth potential for strategic planning. Ready to move beyond the basics? Unlock the full Porter's Five Forces Analysis for detailed ratings, visuals, and actionable insights.
Suppliers Bargaining Power
Concentrated custodial banks
HSAs require qualified custodians and the niche is concentrated, with HSA assets topping >$100 billion (Devenir, 2023), giving a few custodial banks leverage over fees, float-sharing, and service terms. HealthEquity reduces risk via multi-sourcing and integrating custody into its platform, but switching costs and compliance complexity keep supplier power moderate.
Card networks and payment processors
Card issuers and networks (Visa and Mastercard account for roughly 80% of US card volume) are essential to HSA debit functionality at point of care, making their rules pivotal to HealthEquity operations. Interchange structures and chargeback rules, alongside mandates like the Durbin debit cap (0.21% of transaction value + $0.01 for large banks), can compress margins. Redundant processors mitigate risk but certifications and integrations create high switching costs, and strong network brands increase supplier leverage.
Investment fund managers
HSA investment menus rely on third‑party mutual funds and ETFs, with well‑known managers (BlackRock, Vanguard, Fidelity) holding multitrillion-dollar AUM in 2024, which secures shelf space and revenue‑sharing economics. HealthEquity offsets concentration via open‑architecture menus and tiered fund options. Market volatility in 2024 prompted faster fund lineup changes, increasing operational and coordination costs.
Cloud, data, and cybersecurity vendors
HIPAA-compliant hosting, data pipelines, and security tools are mission-critical for HealthEquity, with top cloud providers (AWS ~33%, Microsoft Azure ~23%, Google Cloud ~11% in 2024) offering differentiated capabilities that drive high switching costs. Contracts routinely require 99.95%+ uptime SLAs and exhaustive audit trails, increasing supplier bargaining power. Volume discounts and multi-year deals cut unit cost but only partially offset vendor leverage.
- Mission-critical: HIPAA hosting, ETL, security
- Market share 2024: AWS ~33%, Azure ~23%, GCP ~11%
- Contracts: 99.95%+ SLA, audit/compliance demands
- Mitigation: volume discounts, long-term deals
Healthcare data and eligibility feeds
Accurate eligibility, claims, and carrier feeds are essential for adjudication and member education; missed or late feeds increase denials and operational cost exposure in an industry with US healthcare spending of about 4.5 trillion in 2023. Health plans and recordkeepers act as both partners and data suppliers, dictating SLAs and formats (X12, EDI, HL7/FHIR), while fragmented standards raise integration burdens on HealthEquity and elevate supplier influence due to dependence on timely feeds.
- Dependency: timely feeds = higher supplier leverage
- Standards: X12/EDI vs HL7/FHIR fragmentation
- Scale: US healthcare $4.5T (2023)
- Adoption: ~95% hospitals with EHRs (ONC, 2023)
Custodians, card networks and cloud giants create moderate-to-high supplier leverage
Supplier power is moderate-to-high: custodial banks control >$100B HSA assets (Devenir, 2023) enabling fee leverage; card networks (Visa+Mastercard ~80% US volume) and interchange rules compress margins; top fund managers (BlackRock/Vanguard/Fidelity multitrillion AUM, 2024) and cloud providers (AWS ~33%, Azure ~23%, GCP ~11%, 2024) create switching costs despite HealthEquity mitigations.
| Supplier | Key metric | 2023/2024 | Mitigation |
|---|---|---|---|
| Custodians | HSA assets | >$100B (2023) | Multi-sourcing |
| Card networks | Market share | ~80% volume | Redundant processors |
| Cloud | Market share | AWS33% AZ23% GCP11% (2024) | Long-term SLAs |
What is included in the product
Detailed Word Document
Uncovers key drivers of competition, customer bargaining power, supplier influence, threat of new entrants and substitutes, and disruptive trends specifically shaping HealthEquity’s competitive position, with strategic insights to inform investor materials, internal strategy, or academic analysis.
Customizable Excel Spreadsheet
A concise, one-sheet Porter's Five Forces analysis tailored for HealthEquity—instantly highlights competitive pressures and regulatory risks to accelerate boardroom decisions. Easy to customize for scenarios and paste into decks or Excel dashboards without macros.
Customers Bargaining Power
Large employers and plan sponsors
Large employers and plan sponsors control a potential pool of employer-sponsored coverage that reached about 157 million people in 2024 (KFF), creating millions of potential HSA accounts and high-stakes procurement. They run formal RFPs, benchmark fees across vendors, and demand custom integrations and reporting, giving them strong price and service leverage. Multi-year contracts are common to lock in scale, but renewals remain highly competitive as buyers routinely rebid and benchmark offerings.
Health plans and recordkeepers
Carriers and retirement recordkeepers can steer distribution at enrollment, negotiating white‑label or co‑branded economics and strict data rights that shape who controls member flow. Their deep integrations with payroll and benefits platforms create high stickiness, making them powerful buyers able to demand preferred pricing and feature commitments. Note: 2024 IRS HSA limits are $4,150 individual and $8,300 family, which influences plan design and negotiation leverage.
Brokers and benefit consultants
Brokers and benefit consultants heavily shape vendor shortlists and plan design, steering placement toward providers with clear fee transparency and measurable participant outcomes. By aggregating demand across thousands of employer clients they amplify negotiating power, pressuring fees and service terms; HealthEquity reported roughly 11.0 million HSA accounts in 2024, illustrating scale. Strong broker relationships and documented outcomes can blunt buyer leverage and secure placements.
Individual account holders
Individual account holders can switch providers when changing jobs or via trustee‑to‑trustee transfers; lower balances drive price sensitivity while investor segments prioritize investment menus and features, raising churn risk. User experience and breadth of investment options materially affect retention, though inertia and employer defaults slow immediate switching. 2024 HSA contribution limit: individual 4,150, family 8,300.
- Trustee transfers enable portability
- Low balances => high price sensitivity
- Investors => feature/menu sensitivity
- UX/investment menu → churn risk
- Inertia and employer defaults reduce short‑term switching
Price transparency and benchmarking
Price transparency and widespread fee benchmarking in 2024 have compressed spreads on custody, administration, and investment fees, driving buyers to demand zero-fee cash, tiered pricing, and full revenue-share visibility; outcome metrics such as engagement and ROI are now table stakes in negotiations, elevating buyer power across segments.
- Fee compression: benchmarking common across plan sponsors in 2024
- Buyer demands: zero-fee cash, tiered pricing, revenue-share visibility
- Negotiation metrics: engagement and ROI required
Employers' buying power and carrier distribution squeeze HSA margins under 2024 IRS limits
Large employers (employer‑sponsored coverage ~157 million people in 2024) drive procurement, RFPs and fee benchmarking, shifting leverage to buyers. Carriers/recordkeepers and brokers steer distribution (HealthEquity ~11.0M HSA accounts in 2024), demanding pricing, data and integrations. Fee transparency and 2024 IRS HSA limits (4,150 individual / 8,300 family) compress margins.
| Buyer | 2024 metric | Impact |
|---|---|---|
| Employers | 157M covered | High procurement leverage |
| Carriers/Brokers | HealthEquity 11.0M HSAs | Control distribution |
| Market | IRS limits 4,150/8,300 | Plan design influence |
Full Version Awaits
HealthEquity Porter's Five Forces Analysis
This preview shows the exact HealthEquity Porter's Five Forces analysis you'll receive immediately after purchase—fully formatted and ready for use. It is the final document, not a sample or placeholder, and contains the complete evaluation of competitive forces. Upon payment you get instant access to this identical file.
Description
A Must-Have Tool for Decision-Makers
HealthEquity faces moderate buyer power, specialized supplier relationships, and rising substitute threats from digital health platforms, shaping a competitive but opportunity-rich landscape. This snapshot highlights key pressures on margins and growth potential for strategic planning. Ready to move beyond the basics? Unlock the full Porter's Five Forces Analysis for detailed ratings, visuals, and actionable insights.
Suppliers Bargaining Power
Concentrated custodial banks
HSAs require qualified custodians and the niche is concentrated, with HSA assets topping >$100 billion (Devenir, 2023), giving a few custodial banks leverage over fees, float-sharing, and service terms. HealthEquity reduces risk via multi-sourcing and integrating custody into its platform, but switching costs and compliance complexity keep supplier power moderate.
Card networks and payment processors
Card issuers and networks (Visa and Mastercard account for roughly 80% of US card volume) are essential to HSA debit functionality at point of care, making their rules pivotal to HealthEquity operations. Interchange structures and chargeback rules, alongside mandates like the Durbin debit cap (0.21% of transaction value + $0.01 for large banks), can compress margins. Redundant processors mitigate risk but certifications and integrations create high switching costs, and strong network brands increase supplier leverage.
Investment fund managers
HSA investment menus rely on third‑party mutual funds and ETFs, with well‑known managers (BlackRock, Vanguard, Fidelity) holding multitrillion-dollar AUM in 2024, which secures shelf space and revenue‑sharing economics. HealthEquity offsets concentration via open‑architecture menus and tiered fund options. Market volatility in 2024 prompted faster fund lineup changes, increasing operational and coordination costs.
Cloud, data, and cybersecurity vendors
HIPAA-compliant hosting, data pipelines, and security tools are mission-critical for HealthEquity, with top cloud providers (AWS ~33%, Microsoft Azure ~23%, Google Cloud ~11% in 2024) offering differentiated capabilities that drive high switching costs. Contracts routinely require 99.95%+ uptime SLAs and exhaustive audit trails, increasing supplier bargaining power. Volume discounts and multi-year deals cut unit cost but only partially offset vendor leverage.
- Mission-critical: HIPAA hosting, ETL, security
- Market share 2024: AWS ~33%, Azure ~23%, GCP ~11%
- Contracts: 99.95%+ SLA, audit/compliance demands
- Mitigation: volume discounts, long-term deals
Healthcare data and eligibility feeds
Accurate eligibility, claims, and carrier feeds are essential for adjudication and member education; missed or late feeds increase denials and operational cost exposure in an industry with US healthcare spending of about 4.5 trillion in 2023. Health plans and recordkeepers act as both partners and data suppliers, dictating SLAs and formats (X12, EDI, HL7/FHIR), while fragmented standards raise integration burdens on HealthEquity and elevate supplier influence due to dependence on timely feeds.
- Dependency: timely feeds = higher supplier leverage
- Standards: X12/EDI vs HL7/FHIR fragmentation
- Scale: US healthcare $4.5T (2023)
- Adoption: ~95% hospitals with EHRs (ONC, 2023)
Custodians, card networks and cloud giants create moderate-to-high supplier leverage
Supplier power is moderate-to-high: custodial banks control >$100B HSA assets (Devenir, 2023) enabling fee leverage; card networks (Visa+Mastercard ~80% US volume) and interchange rules compress margins; top fund managers (BlackRock/Vanguard/Fidelity multitrillion AUM, 2024) and cloud providers (AWS ~33%, Azure ~23%, GCP ~11%, 2024) create switching costs despite HealthEquity mitigations.
| Supplier | Key metric | 2023/2024 | Mitigation |
|---|---|---|---|
| Custodians | HSA assets | >$100B (2023) | Multi-sourcing |
| Card networks | Market share | ~80% volume | Redundant processors |
| Cloud | Market share | AWS33% AZ23% GCP11% (2024) | Long-term SLAs |
What is included in the product
Detailed Word Document
Uncovers key drivers of competition, customer bargaining power, supplier influence, threat of new entrants and substitutes, and disruptive trends specifically shaping HealthEquity’s competitive position, with strategic insights to inform investor materials, internal strategy, or academic analysis.
Customizable Excel Spreadsheet
A concise, one-sheet Porter's Five Forces analysis tailored for HealthEquity—instantly highlights competitive pressures and regulatory risks to accelerate boardroom decisions. Easy to customize for scenarios and paste into decks or Excel dashboards without macros.
Customers Bargaining Power
Large employers and plan sponsors
Large employers and plan sponsors control a potential pool of employer-sponsored coverage that reached about 157 million people in 2024 (KFF), creating millions of potential HSA accounts and high-stakes procurement. They run formal RFPs, benchmark fees across vendors, and demand custom integrations and reporting, giving them strong price and service leverage. Multi-year contracts are common to lock in scale, but renewals remain highly competitive as buyers routinely rebid and benchmark offerings.
Health plans and recordkeepers
Carriers and retirement recordkeepers can steer distribution at enrollment, negotiating white‑label or co‑branded economics and strict data rights that shape who controls member flow. Their deep integrations with payroll and benefits platforms create high stickiness, making them powerful buyers able to demand preferred pricing and feature commitments. Note: 2024 IRS HSA limits are $4,150 individual and $8,300 family, which influences plan design and negotiation leverage.
Brokers and benefit consultants
Brokers and benefit consultants heavily shape vendor shortlists and plan design, steering placement toward providers with clear fee transparency and measurable participant outcomes. By aggregating demand across thousands of employer clients they amplify negotiating power, pressuring fees and service terms; HealthEquity reported roughly 11.0 million HSA accounts in 2024, illustrating scale. Strong broker relationships and documented outcomes can blunt buyer leverage and secure placements.
Individual account holders
Individual account holders can switch providers when changing jobs or via trustee‑to‑trustee transfers; lower balances drive price sensitivity while investor segments prioritize investment menus and features, raising churn risk. User experience and breadth of investment options materially affect retention, though inertia and employer defaults slow immediate switching. 2024 HSA contribution limit: individual 4,150, family 8,300.
- Trustee transfers enable portability
- Low balances => high price sensitivity
- Investors => feature/menu sensitivity
- UX/investment menu → churn risk
- Inertia and employer defaults reduce short‑term switching
Price transparency and benchmarking
Price transparency and widespread fee benchmarking in 2024 have compressed spreads on custody, administration, and investment fees, driving buyers to demand zero-fee cash, tiered pricing, and full revenue-share visibility; outcome metrics such as engagement and ROI are now table stakes in negotiations, elevating buyer power across segments.
- Fee compression: benchmarking common across plan sponsors in 2024
- Buyer demands: zero-fee cash, tiered pricing, revenue-share visibility
- Negotiation metrics: engagement and ROI required
Employers' buying power and carrier distribution squeeze HSA margins under 2024 IRS limits
Large employers (employer‑sponsored coverage ~157 million people in 2024) drive procurement, RFPs and fee benchmarking, shifting leverage to buyers. Carriers/recordkeepers and brokers steer distribution (HealthEquity ~11.0M HSA accounts in 2024), demanding pricing, data and integrations. Fee transparency and 2024 IRS HSA limits (4,150 individual / 8,300 family) compress margins.
| Buyer | 2024 metric | Impact |
|---|---|---|
| Employers | 157M covered | High procurement leverage |
| Carriers/Brokers | HealthEquity 11.0M HSAs | Control distribution |
| Market | IRS limits 4,150/8,300 | Plan design influence |
Full Version Awaits
HealthEquity Porter's Five Forces Analysis
This preview shows the exact HealthEquity Porter's Five Forces analysis you'll receive immediately after purchase—fully formatted and ready for use. It is the final document, not a sample or placeholder, and contains the complete evaluation of competitive forces. Upon payment you get instant access to this identical file.











