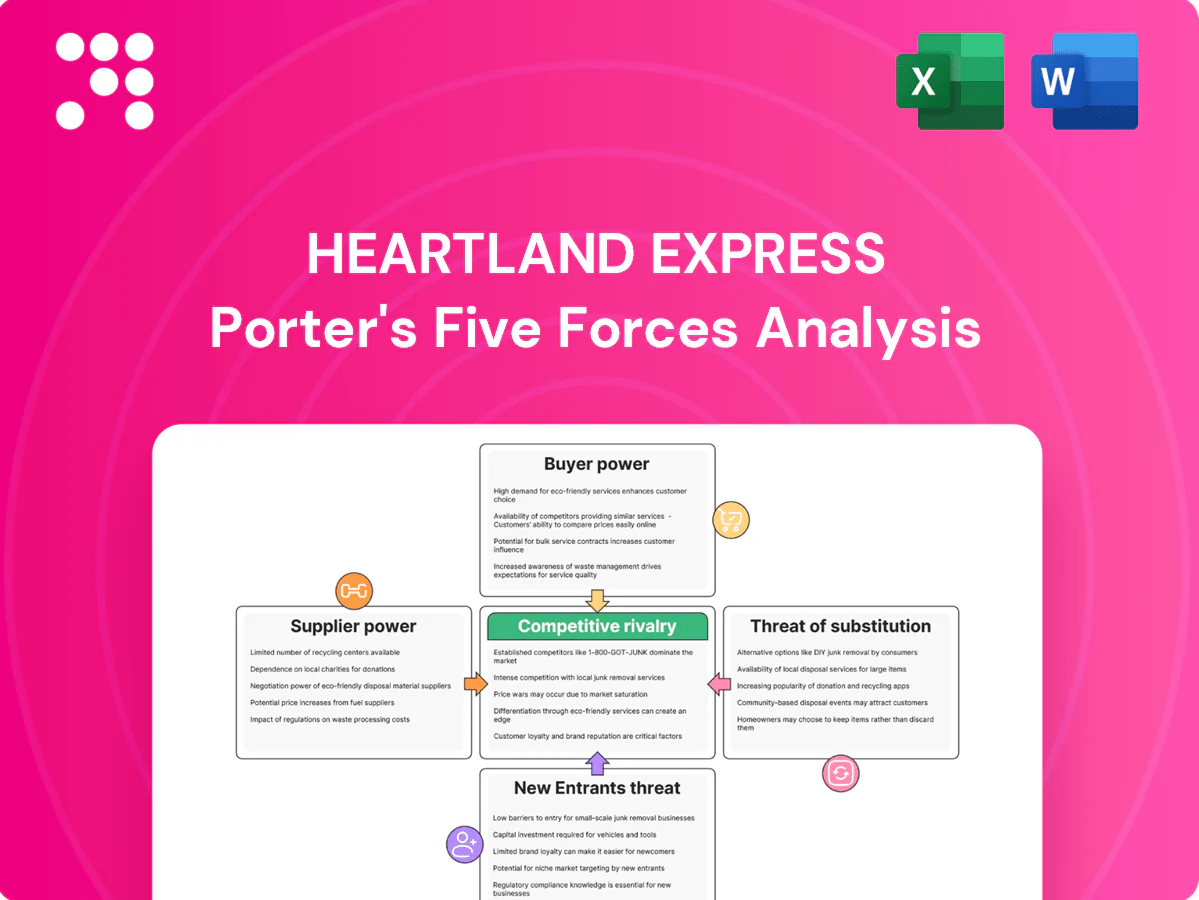
Heartland Express Porter's Five Forces Analysis

Go Beyond the Preview—Access the Full Strategic Report
This snapshot highlights Heartland Express’s competitive dynamics—buyer/supplier power, entrant threats, substitutes and rivalry—but only scratches the surface. Unlock the full Porter's Five Forces Analysis for force-by-force ratings, visuals and actionable insights to inform strategy or investment decisions.
Suppliers Bargaining Power

Concentrated truck and trailer OEMs
Heavy-duty tractor and trailer markets are concentrated: Paccar, Daimler (Freightliner), and Volvo/Mack accounted for about 80% of US Class 8 share in 2024, limiting Heartland’s leverage on specs, pricing, and delivery slots. During 2024 supply tightness build allocations and 6–9 month lead times favored large, long-standing fleets, constraining refresh cycles. That can raise capital costs and extend asset ages, pressuring maintenance and fuel efficiency. Contracted purchase programs and multi-OEM sourcing partially mitigate supplier power.
Fuel suppliers and price volatility
Diesel, accounting for roughly 20–25% of truck operating costs in 2024, remains a major input and global commodity swings give fuel suppliers indirect pricing power. Fuel surcharges offset many swings but lagged indexing and customer surcharge caps compress margins on volatile lanes. Wide regional price spreads and sparse truck-stop density on some Heartland routes reduce carrier negotiating leverage. Hedging programs and fuel-efficiency investments blunt but do not eliminate exposure.

Critical parts, tires, and maintenance networks
Specialized parts, tires, and aftersales networks can leverage pricing and lead times to pressure margins; in 2024 supply-chain disruptions continued to amplify downtime risk and raise total cost of ownership for carriers like Heartland Express.
National accounts soften price exposure but do not guarantee availability or service priority during peaks, making vendor relationships strategic.
Fleet age and standardization choices directly affect dependence on specific vendors and replacement lead times.

Technology and telematics ecosystems
Technology and telematics ecosystems (ELDs, telematics, TMS, safety systems) are concentrated among a few providers—top four vendors hold ~65% market share (2024)—creating meaningful switching costs for Heartland Express. Deep integration with routing, compliance and customer-visibility tools locks workflows, letting vendors raise fees or gate features and thus raise cost-to-serve. Open APIs and modular architectures, increasingly adopted in 2023–24, lower vendor hold-up risk.
- ELD/telematics concentration: top 4 ≈65% (2024)
- US trucking base: ≈3.5 million drivers/trucks (2024)
- Integration locks workflows → higher switching cost
- API openness/modularity reduce vendor power
Driver labor availability and wages
Tight driver markets — ATA estimated a shortfall of roughly 75,000 drivers in 2024 — force Heartland to raise wages, benefits, and recruitment spend, giving labor effective supplier power; regulatory HOS and CDL standards further constrain supply elasticity and magnify cost pressure, while high turnover (around 90% at for‑hire fleets) raises training and onboarding burdens; emphasis on home time, safety, and modern equipment improves attraction and retention.
- Driver shortfall: ~75,000 (ATA 2024)
- Fleet turnover: ~90% (industry 2024)
- Key levers: pay, home time, safety, equipment
Concentrated OEMs and telematics boost supplier power amid driver crisis
Supplier power is moderate–high: top OEMs held ~80% US Class 8 share (2024) and ELD/telematics top4 ≈65%, creating switching costs; diesel (20–25% of ops) and parts/tire lead times raised costs and downtime in 2024. Driver shortfall (~75,000) and ~90% turnover boost labor supplier power; hedges, multi‑OEM sourcing and contracts partly mitigate risks.
| Metric | 2024 |
|---|---|
| Class 8 top OEM share | ~80% |
| ELD/telematics top4 | ~65% |
| Diesel share of ops | 20–25% |
| Driver shortfall | ~75,000 |
| Fleet turnover | ~90% |
What is included in the product
 Detailed Word Document
Delivers a focused Porter’s Five Forces analysis of Heartland Express, identifying competitive rivalry, buyer and supplier power, threat of new entrants and substitutes, and key disruptive trends shaping pricing, margins, and strategic positioning.

 Customizable Excel Spreadsheet
A one-sheet Porter’s Five Forces view tailored to Heartland Express—instantly highlights carrier-specific pressures and relief points for faster strategic decisions. Clean layout and adjustable pressure sliders let non-finance users model scenarios (fuel costs, regulation, competition) and produce board-ready insights.
Customers Bargaining Power

Large shippers with scale and RFP cycles
Major retail, manufacturing and food shippers run competitive RFP cycles and consolidate volumes, increasing leverage on rates and contractual terms in 2024. Their scale enables multi-year agreements with explicit performance KPIs and financial penalties. They commonly demand dedicated capacity during peak seasons. Heartland’s service reliability and network density can win preferred-carrier status to offset rate pressure.
Price transparency and benchmarking
Shippers increasingly use DAT and Truckstop indices and automated bid tools to benchmark TL rates, with DAT reporting spot van rates down roughly 25% year-over-year in 2024, compressing carrier margins in loose-capacity periods. This transparency enables spot-to-contract arbitrage that intensifies during downcycles, forcing carriers to defend utilization. Carriers with differentiated service metrics and consistent on-time performance can command price premiums of several percentage points.

Mode flexibility and intermodal options
Many lanes can shift to rail intermodal or hybrid solutions, and in 2024 industry data showed increased mode substitution pressure as shippers sought lower-cost pathways. For time-sensitive freight flexibility is lower, which softens buyer power on Heartland’s time-critical lanes. When service windows widen buyers pushed mode shifts to cut cost, while Heartland’s focus on time-critical service narrows substitution on key lanes.

Service level demands and penalties
Food and retail loads often carry OTIF targets above 95% in 2024, with buyers enforcing chargebacks that can shave 1–3% off carrier realized rates; strict appointment windows and compliance scorecards shift timing and quality risk to carriers and compress margins.
- OTIF targets: >95% (2024 market SLA)
- Chargebacks: ~1–3% realized-rate erosion
- EDI/API: higher TMS/integration overhead
- Superior OTIF/safety: lowers penalty exposure, strengthens pricing leverage
Broker and 3PL intermediation
3PLs aggregate demand and run frequent mini-bids that intensify carrier competition, while brokers compress margins on commoditized lanes by pressing rates. Intermediation widens market access and helps carriers fill backhauls, improving asset utilization. Heartland’s direct shipper contracts remain crucial to limit buyer leverage and protect pricing power.
- 3PLs: increase bidding frequency
- Brokers: pressure commoditized lanes
- Intermediation: improves backhaul fill
- Direct shippers: moderate buyer power
DAT -25%, OTIF >95%, chargebacks 1-3%
Large shippers consolidate volumes via competitive RFPs and benchmark rates (DAT spot van rates down ~25% YoY in 2024), increasing price and SLA pressure on Heartland. High OTIF expectations and chargebacks (OTIF >95%; chargebacks ~1–3%) shift timing and quality risk to carriers. Heartland’s reliability and direct contracts are key levers to defend pricing.
| Metric | 2024 | Impact |
|---|---|---|
| DAT spot van | -25% YoY | Compresses margins |
| OTIF target | >95% | Penalty exposure |
| Chargebacks | ~1–3% | Realized-rate erosion |
Full Version Awaits
Heartland Express Porter's Five Forces Analysis
This preview shows the exact Heartland Express Porter’s Five Forces analysis you’ll receive—no placeholders or mockups. The document displayed is the full, professionally formatted report and will be available for immediate download after purchase. You're previewing the final deliverable, ready for use.

Go Beyond the Preview—Access the Full Strategic Report
This snapshot highlights Heartland Express’s competitive dynamics—buyer/supplier power, entrant threats, substitutes and rivalry—but only scratches the surface. Unlock the full Porter's Five Forces Analysis for force-by-force ratings, visuals and actionable insights to inform strategy or investment decisions.
Suppliers Bargaining Power
Concentrated truck and trailer OEMs
Heavy-duty tractor and trailer markets are concentrated: Paccar, Daimler (Freightliner), and Volvo/Mack accounted for about 80% of US Class 8 share in 2024, limiting Heartland’s leverage on specs, pricing, and delivery slots. During 2024 supply tightness build allocations and 6–9 month lead times favored large, long-standing fleets, constraining refresh cycles. That can raise capital costs and extend asset ages, pressuring maintenance and fuel efficiency. Contracted purchase programs and multi-OEM sourcing partially mitigate supplier power.
Fuel suppliers and price volatility
Diesel, accounting for roughly 20–25% of truck operating costs in 2024, remains a major input and global commodity swings give fuel suppliers indirect pricing power. Fuel surcharges offset many swings but lagged indexing and customer surcharge caps compress margins on volatile lanes. Wide regional price spreads and sparse truck-stop density on some Heartland routes reduce carrier negotiating leverage. Hedging programs and fuel-efficiency investments blunt but do not eliminate exposure.
Critical parts, tires, and maintenance networks
Specialized parts, tires, and aftersales networks can leverage pricing and lead times to pressure margins; in 2024 supply-chain disruptions continued to amplify downtime risk and raise total cost of ownership for carriers like Heartland Express.
National accounts soften price exposure but do not guarantee availability or service priority during peaks, making vendor relationships strategic.
Fleet age and standardization choices directly affect dependence on specific vendors and replacement lead times.
Technology and telematics ecosystems
Technology and telematics ecosystems (ELDs, telematics, TMS, safety systems) are concentrated among a few providers—top four vendors hold ~65% market share (2024)—creating meaningful switching costs for Heartland Express. Deep integration with routing, compliance and customer-visibility tools locks workflows, letting vendors raise fees or gate features and thus raise cost-to-serve. Open APIs and modular architectures, increasingly adopted in 2023–24, lower vendor hold-up risk.
- ELD/telematics concentration: top 4 ≈65% (2024)
- US trucking base: ≈3.5 million drivers/trucks (2024)
- Integration locks workflows → higher switching cost
- API openness/modularity reduce vendor power
Driver labor availability and wages
Tight driver markets — ATA estimated a shortfall of roughly 75,000 drivers in 2024 — force Heartland to raise wages, benefits, and recruitment spend, giving labor effective supplier power; regulatory HOS and CDL standards further constrain supply elasticity and magnify cost pressure, while high turnover (around 90% at for‑hire fleets) raises training and onboarding burdens; emphasis on home time, safety, and modern equipment improves attraction and retention.
- Driver shortfall: ~75,000 (ATA 2024)
- Fleet turnover: ~90% (industry 2024)
- Key levers: pay, home time, safety, equipment
Concentrated OEMs and telematics boost supplier power amid driver crisis
Supplier power is moderate–high: top OEMs held ~80% US Class 8 share (2024) and ELD/telematics top4 ≈65%, creating switching costs; diesel (20–25% of ops) and parts/tire lead times raised costs and downtime in 2024. Driver shortfall (~75,000) and ~90% turnover boost labor supplier power; hedges, multi‑OEM sourcing and contracts partly mitigate risks.
| Metric | 2024 |
|---|---|
| Class 8 top OEM share | ~80% |
| ELD/telematics top4 | ~65% |
| Diesel share of ops | 20–25% |
| Driver shortfall | ~75,000 |
| Fleet turnover | ~90% |
What is included in the product
Detailed Word Document
Delivers a focused Porter’s Five Forces analysis of Heartland Express, identifying competitive rivalry, buyer and supplier power, threat of new entrants and substitutes, and key disruptive trends shaping pricing, margins, and strategic positioning.
Customizable Excel Spreadsheet
A one-sheet Porter’s Five Forces view tailored to Heartland Express—instantly highlights carrier-specific pressures and relief points for faster strategic decisions. Clean layout and adjustable pressure sliders let non-finance users model scenarios (fuel costs, regulation, competition) and produce board-ready insights.
Customers Bargaining Power
Large shippers with scale and RFP cycles
Major retail, manufacturing and food shippers run competitive RFP cycles and consolidate volumes, increasing leverage on rates and contractual terms in 2024. Their scale enables multi-year agreements with explicit performance KPIs and financial penalties. They commonly demand dedicated capacity during peak seasons. Heartland’s service reliability and network density can win preferred-carrier status to offset rate pressure.
Price transparency and benchmarking
Shippers increasingly use DAT and Truckstop indices and automated bid tools to benchmark TL rates, with DAT reporting spot van rates down roughly 25% year-over-year in 2024, compressing carrier margins in loose-capacity periods. This transparency enables spot-to-contract arbitrage that intensifies during downcycles, forcing carriers to defend utilization. Carriers with differentiated service metrics and consistent on-time performance can command price premiums of several percentage points.
Mode flexibility and intermodal options
Many lanes can shift to rail intermodal or hybrid solutions, and in 2024 industry data showed increased mode substitution pressure as shippers sought lower-cost pathways. For time-sensitive freight flexibility is lower, which softens buyer power on Heartland’s time-critical lanes. When service windows widen buyers pushed mode shifts to cut cost, while Heartland’s focus on time-critical service narrows substitution on key lanes.
Service level demands and penalties
Food and retail loads often carry OTIF targets above 95% in 2024, with buyers enforcing chargebacks that can shave 1–3% off carrier realized rates; strict appointment windows and compliance scorecards shift timing and quality risk to carriers and compress margins.
- OTIF targets: >95% (2024 market SLA)
- Chargebacks: ~1–3% realized-rate erosion
- EDI/API: higher TMS/integration overhead
- Superior OTIF/safety: lowers penalty exposure, strengthens pricing leverage
Broker and 3PL intermediation
3PLs aggregate demand and run frequent mini-bids that intensify carrier competition, while brokers compress margins on commoditized lanes by pressing rates. Intermediation widens market access and helps carriers fill backhauls, improving asset utilization. Heartland’s direct shipper contracts remain crucial to limit buyer leverage and protect pricing power.
- 3PLs: increase bidding frequency
- Brokers: pressure commoditized lanes
- Intermediation: improves backhaul fill
- Direct shippers: moderate buyer power
DAT -25%, OTIF >95%, chargebacks 1-3%
Large shippers consolidate volumes via competitive RFPs and benchmark rates (DAT spot van rates down ~25% YoY in 2024), increasing price and SLA pressure on Heartland. High OTIF expectations and chargebacks (OTIF >95%; chargebacks ~1–3%) shift timing and quality risk to carriers. Heartland’s reliability and direct contracts are key levers to defend pricing.
| Metric | 2024 | Impact |
|---|---|---|
| DAT spot van | -25% YoY | Compresses margins |
| OTIF target | >95% | Penalty exposure |
| Chargebacks | ~1–3% | Realized-rate erosion |
Full Version Awaits
Heartland Express Porter's Five Forces Analysis
This preview shows the exact Heartland Express Porter’s Five Forces analysis you’ll receive—no placeholders or mockups. The document displayed is the full, professionally formatted report and will be available for immediate download after purchase. You're previewing the final deliverable, ready for use.
Original: $10.00
-65%$10.00
$3.50Description
Go Beyond the Preview—Access the Full Strategic Report
This snapshot highlights Heartland Express’s competitive dynamics—buyer/supplier power, entrant threats, substitutes and rivalry—but only scratches the surface. Unlock the full Porter's Five Forces Analysis for force-by-force ratings, visuals and actionable insights to inform strategy or investment decisions.
Suppliers Bargaining Power
Concentrated truck and trailer OEMs
Heavy-duty tractor and trailer markets are concentrated: Paccar, Daimler (Freightliner), and Volvo/Mack accounted for about 80% of US Class 8 share in 2024, limiting Heartland’s leverage on specs, pricing, and delivery slots. During 2024 supply tightness build allocations and 6–9 month lead times favored large, long-standing fleets, constraining refresh cycles. That can raise capital costs and extend asset ages, pressuring maintenance and fuel efficiency. Contracted purchase programs and multi-OEM sourcing partially mitigate supplier power.
Fuel suppliers and price volatility
Diesel, accounting for roughly 20–25% of truck operating costs in 2024, remains a major input and global commodity swings give fuel suppliers indirect pricing power. Fuel surcharges offset many swings but lagged indexing and customer surcharge caps compress margins on volatile lanes. Wide regional price spreads and sparse truck-stop density on some Heartland routes reduce carrier negotiating leverage. Hedging programs and fuel-efficiency investments blunt but do not eliminate exposure.
Critical parts, tires, and maintenance networks
Specialized parts, tires, and aftersales networks can leverage pricing and lead times to pressure margins; in 2024 supply-chain disruptions continued to amplify downtime risk and raise total cost of ownership for carriers like Heartland Express.
National accounts soften price exposure but do not guarantee availability or service priority during peaks, making vendor relationships strategic.
Fleet age and standardization choices directly affect dependence on specific vendors and replacement lead times.
Technology and telematics ecosystems
Technology and telematics ecosystems (ELDs, telematics, TMS, safety systems) are concentrated among a few providers—top four vendors hold ~65% market share (2024)—creating meaningful switching costs for Heartland Express. Deep integration with routing, compliance and customer-visibility tools locks workflows, letting vendors raise fees or gate features and thus raise cost-to-serve. Open APIs and modular architectures, increasingly adopted in 2023–24, lower vendor hold-up risk.
- ELD/telematics concentration: top 4 ≈65% (2024)
- US trucking base: ≈3.5 million drivers/trucks (2024)
- Integration locks workflows → higher switching cost
- API openness/modularity reduce vendor power
Driver labor availability and wages
Tight driver markets — ATA estimated a shortfall of roughly 75,000 drivers in 2024 — force Heartland to raise wages, benefits, and recruitment spend, giving labor effective supplier power; regulatory HOS and CDL standards further constrain supply elasticity and magnify cost pressure, while high turnover (around 90% at for‑hire fleets) raises training and onboarding burdens; emphasis on home time, safety, and modern equipment improves attraction and retention.
- Driver shortfall: ~75,000 (ATA 2024)
- Fleet turnover: ~90% (industry 2024)
- Key levers: pay, home time, safety, equipment
Concentrated OEMs and telematics boost supplier power amid driver crisis
Supplier power is moderate–high: top OEMs held ~80% US Class 8 share (2024) and ELD/telematics top4 ≈65%, creating switching costs; diesel (20–25% of ops) and parts/tire lead times raised costs and downtime in 2024. Driver shortfall (~75,000) and ~90% turnover boost labor supplier power; hedges, multi‑OEM sourcing and contracts partly mitigate risks.
| Metric | 2024 |
|---|---|
| Class 8 top OEM share | ~80% |
| ELD/telematics top4 | ~65% |
| Diesel share of ops | 20–25% |
| Driver shortfall | ~75,000 |
| Fleet turnover | ~90% |
What is included in the product
Detailed Word Document
Delivers a focused Porter’s Five Forces analysis of Heartland Express, identifying competitive rivalry, buyer and supplier power, threat of new entrants and substitutes, and key disruptive trends shaping pricing, margins, and strategic positioning.
Customizable Excel Spreadsheet
A one-sheet Porter’s Five Forces view tailored to Heartland Express—instantly highlights carrier-specific pressures and relief points for faster strategic decisions. Clean layout and adjustable pressure sliders let non-finance users model scenarios (fuel costs, regulation, competition) and produce board-ready insights.
Customers Bargaining Power
Large shippers with scale and RFP cycles
Major retail, manufacturing and food shippers run competitive RFP cycles and consolidate volumes, increasing leverage on rates and contractual terms in 2024. Their scale enables multi-year agreements with explicit performance KPIs and financial penalties. They commonly demand dedicated capacity during peak seasons. Heartland’s service reliability and network density can win preferred-carrier status to offset rate pressure.
Price transparency and benchmarking
Shippers increasingly use DAT and Truckstop indices and automated bid tools to benchmark TL rates, with DAT reporting spot van rates down roughly 25% year-over-year in 2024, compressing carrier margins in loose-capacity periods. This transparency enables spot-to-contract arbitrage that intensifies during downcycles, forcing carriers to defend utilization. Carriers with differentiated service metrics and consistent on-time performance can command price premiums of several percentage points.
Mode flexibility and intermodal options
Many lanes can shift to rail intermodal or hybrid solutions, and in 2024 industry data showed increased mode substitution pressure as shippers sought lower-cost pathways. For time-sensitive freight flexibility is lower, which softens buyer power on Heartland’s time-critical lanes. When service windows widen buyers pushed mode shifts to cut cost, while Heartland’s focus on time-critical service narrows substitution on key lanes.
Service level demands and penalties
Food and retail loads often carry OTIF targets above 95% in 2024, with buyers enforcing chargebacks that can shave 1–3% off carrier realized rates; strict appointment windows and compliance scorecards shift timing and quality risk to carriers and compress margins.
- OTIF targets: >95% (2024 market SLA)
- Chargebacks: ~1–3% realized-rate erosion
- EDI/API: higher TMS/integration overhead
- Superior OTIF/safety: lowers penalty exposure, strengthens pricing leverage
Broker and 3PL intermediation
3PLs aggregate demand and run frequent mini-bids that intensify carrier competition, while brokers compress margins on commoditized lanes by pressing rates. Intermediation widens market access and helps carriers fill backhauls, improving asset utilization. Heartland’s direct shipper contracts remain crucial to limit buyer leverage and protect pricing power.
- 3PLs: increase bidding frequency
- Brokers: pressure commoditized lanes
- Intermediation: improves backhaul fill
- Direct shippers: moderate buyer power
DAT -25%, OTIF >95%, chargebacks 1-3%
Large shippers consolidate volumes via competitive RFPs and benchmark rates (DAT spot van rates down ~25% YoY in 2024), increasing price and SLA pressure on Heartland. High OTIF expectations and chargebacks (OTIF >95%; chargebacks ~1–3%) shift timing and quality risk to carriers. Heartland’s reliability and direct contracts are key levers to defend pricing.
| Metric | 2024 | Impact |
|---|---|---|
| DAT spot van | -25% YoY | Compresses margins |
| OTIF target | >95% | Penalty exposure |
| Chargebacks | ~1–3% | Realized-rate erosion |
Full Version Awaits
Heartland Express Porter's Five Forces Analysis
This preview shows the exact Heartland Express Porter’s Five Forces analysis you’ll receive—no placeholders or mockups. The document displayed is the full, professionally formatted report and will be available for immediate download after purchase. You're previewing the final deliverable, ready for use.











