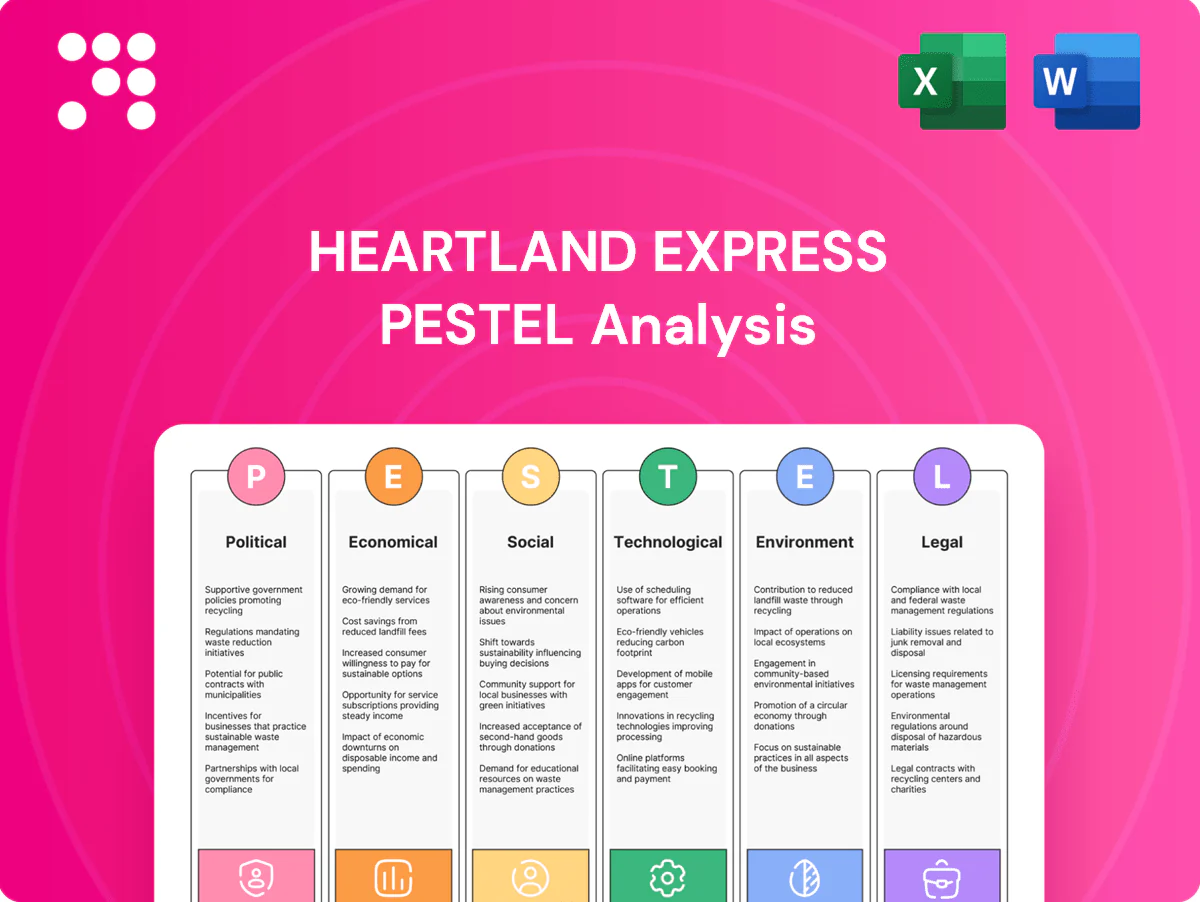
Heartland Express PESTLE Analysis

Your Competitive Advantage Starts with This Report
Explore how political shifts, fuel costs, labor markets, technological advances, and environmental regulations are shaping Heartland Express’s strategic outlook in our concise PESTLE snapshot. This analysis highlights risks and opportunities that matter to investors, fleet managers, and strategists. Purchase the full PESTLE for detailed implications, forecasts, and actionable recommendations to inform your next decision.
Political factors

Infrastructure and highway funding
Federal and state road spending directly affects transit times, safety, and maintenance costs; the Bipartisan Infrastructure Law (IIJA) allocates roughly $110 billion for roads and bridges through 2026. Robust funding reduces congestion and equipment wear, improving asset utilization and lowering per-mile operating costs. Political gridlock that delays projects degrades lanes and raises repair expenses. Heartland should align network planning with funded corridors and announced state projects.
Fuel taxation and incentives
Diesel excise taxes and state surcharges materially influence cost per mile: federal diesel excise is 24.3¢/gal and average state diesel tax ~32¢/gal (combined ~56¢/gal), adding roughly $0.08–0.12/mile depending on MPG. Shifts toward carbon pricing or fuel‑tax reforms (2024–25 proposals) could raise fuel costs and force routing/pricing changes. Targeted incentives and grants for cleaner fleets can offset tractor capex; monitoring tax changes preserves bid accuracy.

Cross-border trade policy (USMCA)
Stable North American trade under USMCA, in force since July 1, 2020, supports the manufacturing and retail flows Heartland serves; trilateral merchandise trade was about $1.7 trillion in 2023. Tariff disputes or customs rule changes can spike cross-border volumes and dwell times, disrupting schedules. Active compliance programs and port-of-entry partnerships mitigate this volatility. Diversifying lanes reduces exposure to policy shocks and single-border risk.

State-level regulations and tolling
Fragmented state rules on toll roads, weight limits, and emissions increase operational complexity for Heartland Express, forcing route deviations and varied compliance costs across jurisdictions.
Tolls on key corridors materially affect lane profitability and bid pricing, while disciplined network planning is required to harmonize permits, inspections, and electronic tolling across states.
Strategic use of toll lanes can improve on-time delivery for time-sensitive freight by reducing congestion-related variability.
- Fragmented regulations raise compliance overhead
- Tolls alter lane-level margins and bids
- Network planning needed for multi-state harmonization
- Toll lanes improve reliability for time-sensitive loads
Labor and transportation policy priorities
IIJA $110B boosts assets; diesel tax ~56¢/gal adds $0.08-0.12/mi; 80,000 driver gap
Federal IIJA $110B roads/bridges through 2026 improves asset utilization; combined diesel tax ~56¢/gal adds ~$0.08–0.12/mile; ATA estimated 80,000 driver shortfall (2022) sustains wage pressure; USMCA trade ~$1.7T (2023) underpins volumes but customs/tariff changes raise dwell times.
| Factor | Metric | Impact |
|---|---|---|
| Infrastructure | $110B IIJA | Lower Opex |
| Fuel taxes | ~56¢/gal | +$0.08–0.12/mile |
| Labor | 80,000 shortfall (2022) | Wage pressure |
| Trade | $1.7T (2023) | Stable volumes |
What is included in the product
 Detailed Word Document
Explores how macro-environmental factors uniquely affect Heartland Express across Political, Economic, Social, Technological, Environmental, and Legal dimensions, with data-backed insights and trend analysis; designed for executives, consultants, and entrepreneurs to identify threats, opportunities, and forward-looking scenarios, delivered in clean, presentation-ready format.

 Customizable Excel Spreadsheet
A concise, visually segmented PESTLE summary for Heartland Express that streamlines external risk assessment and market positioning, making it easy to drop into presentations, share across teams, and annotate with region- or business-specific notes for faster strategic decisions.
Economic factors

Freight demand cycles
Truckload volumes for Heartland Express track US retail sales (up ~3.0% in 2024) and industrial production (≈+1.2% in 2024), with inventory cycles—inventory-to-sales ~1.28—driving demand swings; softness compresses spot rates and utilization, while upcycles tighten capacity and lift yields. Diversification across retail, manufacturing and food (each ~20–35% of mix) smooths volatility, and dynamic pricing plus freight-mix management protect margins and yield improvement.
Diesel price volatility
Diesel is a major variable cost for Heartland Express, typically accounting for roughly 20-30% of trucking operating expenses, and U.S. retail diesel averaged about 4.00 per gallon in 2024 (EIA). Rapid price swings create timing mismatches between rising fuel costs and recovery via customer surcharges, squeezing margins. Efficiency measures—route optimization, fuel-efficient equipment—lower exposure per mile. Transparent, index-linked surcharge mechanisms help stabilize revenue.

Labor availability and wage inflation
Tight driver markets—American Trucking Associations estimated a shortage near 80,000 drivers in 2023—force Heartland to raise pay, sign-on bonuses and training spend, while BLS shows median heavy-truck driver pay $49,700 (May 2023). Wage competition can compress operating ratio if not offset by rate hikes and fleet efficiency; investing in retention and modern trucks plus stronger home-time policies reduces churn and onboarding costs.

Interest rates and capital intensity
New Class 8 tractors (~$160k–$200k new) and trailers ($40k–$60k) require substantial capex or financing; with US policy rates near 5.25–5.50% in mid‑2025 higher borrowing and lease costs compress Heartland Express free cash flow and raise debt service. Fleet age strategy must trade higher maintenance on older units versus elevated financing costs for replacements; counter‑cyclical buying during OEM slowdowns can secure significant discounts.
- Capex: new tractors $160k–$200k; trailers $40k–$60k
- Rates: policy rate ~5.25–5.50% (mid‑2025)
- Impact: higher lease/debt service lowers free cash flow
- Strategy: balance maintenance vs financing; buy counter‑cyclically for OEM discounts
Shipper consolidation and pricing power
Larger shippers increasingly award scale contracts and 3PL arrangements, pushing Heartland to accept tighter rates and stricter service SLAs to retain volume.
Winning strategic contract awards stabilizes load volumes but often compresses margins; maintaining on-time performance enables disciplined pricing and premium access to customers.
Diversifying the customer mix lowers concentration risk and improves resilience against shipper consolidation pressures.
- scale contracts pressure rates
- awards stabilize volumes, compress margins
- on-time performance supports price discipline
- diversification reduces concentration risk
IIJA $110B boosts assets; diesel tax ~56¢/gal adds $0.08-0.12/mi; 80,000 driver gap
Truckload demand tracks US retail sales (+≈3.0% in 2024) and industrial production (+≈1.2% in 2024), with inventory-to-sales ~1.28 driving volatility. Diesel averaged ≈$4.00/gal in 2024; drivers short ~80,000 (ATA 2023) pressures wages. Class 8 tractors $160k–$200k; US policy rate ~5.25–5.50% (mid‑2025) raises financing costs.
| Metric | Value |
|---|---|
| Retail sales (2024) | +≈3.0% |
| Industrial prod (2024) | +≈1.2% |
| Diesel (2024 avg) | $4.00/gal |
| Driver shortage (2023) | ~80,000 |
| Tractor price | $160k–$200k |
| Policy rate (mid‑2025) | 5.25–5.50% |
Preview the Actual Deliverable
Heartland Express PESTLE Analysis
The preview shown here is the exact document you’ll receive after purchase—fully formatted and ready to use. This Heartland Express PESTLE Analysis provides a complete, professionally structured review of political, economic, social, technological, legal, and environmental factors affecting the company. No placeholders or teasers—what you see is the final file available for immediate download.

Your Competitive Advantage Starts with This Report
Explore how political shifts, fuel costs, labor markets, technological advances, and environmental regulations are shaping Heartland Express’s strategic outlook in our concise PESTLE snapshot. This analysis highlights risks and opportunities that matter to investors, fleet managers, and strategists. Purchase the full PESTLE for detailed implications, forecasts, and actionable recommendations to inform your next decision.
Political factors
Infrastructure and highway funding
Federal and state road spending directly affects transit times, safety, and maintenance costs; the Bipartisan Infrastructure Law (IIJA) allocates roughly $110 billion for roads and bridges through 2026. Robust funding reduces congestion and equipment wear, improving asset utilization and lowering per-mile operating costs. Political gridlock that delays projects degrades lanes and raises repair expenses. Heartland should align network planning with funded corridors and announced state projects.
Fuel taxation and incentives
Diesel excise taxes and state surcharges materially influence cost per mile: federal diesel excise is 24.3¢/gal and average state diesel tax ~32¢/gal (combined ~56¢/gal), adding roughly $0.08–0.12/mile depending on MPG. Shifts toward carbon pricing or fuel‑tax reforms (2024–25 proposals) could raise fuel costs and force routing/pricing changes. Targeted incentives and grants for cleaner fleets can offset tractor capex; monitoring tax changes preserves bid accuracy.
Cross-border trade policy (USMCA)
Stable North American trade under USMCA, in force since July 1, 2020, supports the manufacturing and retail flows Heartland serves; trilateral merchandise trade was about $1.7 trillion in 2023. Tariff disputes or customs rule changes can spike cross-border volumes and dwell times, disrupting schedules. Active compliance programs and port-of-entry partnerships mitigate this volatility. Diversifying lanes reduces exposure to policy shocks and single-border risk.
State-level regulations and tolling
Fragmented state rules on toll roads, weight limits, and emissions increase operational complexity for Heartland Express, forcing route deviations and varied compliance costs across jurisdictions.
Tolls on key corridors materially affect lane profitability and bid pricing, while disciplined network planning is required to harmonize permits, inspections, and electronic tolling across states.
Strategic use of toll lanes can improve on-time delivery for time-sensitive freight by reducing congestion-related variability.
- Fragmented regulations raise compliance overhead
- Tolls alter lane-level margins and bids
- Network planning needed for multi-state harmonization
- Toll lanes improve reliability for time-sensitive loads
Labor and transportation policy priorities
IIJA $110B boosts assets; diesel tax ~56¢/gal adds $0.08-0.12/mi; 80,000 driver gap
Federal IIJA $110B roads/bridges through 2026 improves asset utilization; combined diesel tax ~56¢/gal adds ~$0.08–0.12/mile; ATA estimated 80,000 driver shortfall (2022) sustains wage pressure; USMCA trade ~$1.7T (2023) underpins volumes but customs/tariff changes raise dwell times.
| Factor | Metric | Impact |
|---|---|---|
| Infrastructure | $110B IIJA | Lower Opex |
| Fuel taxes | ~56¢/gal | +$0.08–0.12/mile |
| Labor | 80,000 shortfall (2022) | Wage pressure |
| Trade | $1.7T (2023) | Stable volumes |
What is included in the product
Detailed Word Document
Explores how macro-environmental factors uniquely affect Heartland Express across Political, Economic, Social, Technological, Environmental, and Legal dimensions, with data-backed insights and trend analysis; designed for executives, consultants, and entrepreneurs to identify threats, opportunities, and forward-looking scenarios, delivered in clean, presentation-ready format.
Customizable Excel Spreadsheet
A concise, visually segmented PESTLE summary for Heartland Express that streamlines external risk assessment and market positioning, making it easy to drop into presentations, share across teams, and annotate with region- or business-specific notes for faster strategic decisions.
Economic factors
Freight demand cycles
Truckload volumes for Heartland Express track US retail sales (up ~3.0% in 2024) and industrial production (≈+1.2% in 2024), with inventory cycles—inventory-to-sales ~1.28—driving demand swings; softness compresses spot rates and utilization, while upcycles tighten capacity and lift yields. Diversification across retail, manufacturing and food (each ~20–35% of mix) smooths volatility, and dynamic pricing plus freight-mix management protect margins and yield improvement.
Diesel price volatility
Diesel is a major variable cost for Heartland Express, typically accounting for roughly 20-30% of trucking operating expenses, and U.S. retail diesel averaged about 4.00 per gallon in 2024 (EIA). Rapid price swings create timing mismatches between rising fuel costs and recovery via customer surcharges, squeezing margins. Efficiency measures—route optimization, fuel-efficient equipment—lower exposure per mile. Transparent, index-linked surcharge mechanisms help stabilize revenue.
Labor availability and wage inflation
Tight driver markets—American Trucking Associations estimated a shortage near 80,000 drivers in 2023—force Heartland to raise pay, sign-on bonuses and training spend, while BLS shows median heavy-truck driver pay $49,700 (May 2023). Wage competition can compress operating ratio if not offset by rate hikes and fleet efficiency; investing in retention and modern trucks plus stronger home-time policies reduces churn and onboarding costs.
Interest rates and capital intensity
New Class 8 tractors (~$160k–$200k new) and trailers ($40k–$60k) require substantial capex or financing; with US policy rates near 5.25–5.50% in mid‑2025 higher borrowing and lease costs compress Heartland Express free cash flow and raise debt service. Fleet age strategy must trade higher maintenance on older units versus elevated financing costs for replacements; counter‑cyclical buying during OEM slowdowns can secure significant discounts.
- Capex: new tractors $160k–$200k; trailers $40k–$60k
- Rates: policy rate ~5.25–5.50% (mid‑2025)
- Impact: higher lease/debt service lowers free cash flow
- Strategy: balance maintenance vs financing; buy counter‑cyclically for OEM discounts
Shipper consolidation and pricing power
Larger shippers increasingly award scale contracts and 3PL arrangements, pushing Heartland to accept tighter rates and stricter service SLAs to retain volume.
Winning strategic contract awards stabilizes load volumes but often compresses margins; maintaining on-time performance enables disciplined pricing and premium access to customers.
Diversifying the customer mix lowers concentration risk and improves resilience against shipper consolidation pressures.
- scale contracts pressure rates
- awards stabilize volumes, compress margins
- on-time performance supports price discipline
- diversification reduces concentration risk
IIJA $110B boosts assets; diesel tax ~56¢/gal adds $0.08-0.12/mi; 80,000 driver gap
Truckload demand tracks US retail sales (+≈3.0% in 2024) and industrial production (+≈1.2% in 2024), with inventory-to-sales ~1.28 driving volatility. Diesel averaged ≈$4.00/gal in 2024; drivers short ~80,000 (ATA 2023) pressures wages. Class 8 tractors $160k–$200k; US policy rate ~5.25–5.50% (mid‑2025) raises financing costs.
| Metric | Value |
|---|---|
| Retail sales (2024) | +≈3.0% |
| Industrial prod (2024) | +≈1.2% |
| Diesel (2024 avg) | $4.00/gal |
| Driver shortage (2023) | ~80,000 |
| Tractor price | $160k–$200k |
| Policy rate (mid‑2025) | 5.25–5.50% |
Preview the Actual Deliverable
Heartland Express PESTLE Analysis
The preview shown here is the exact document you’ll receive after purchase—fully formatted and ready to use. This Heartland Express PESTLE Analysis provides a complete, professionally structured review of political, economic, social, technological, legal, and environmental factors affecting the company. No placeholders or teasers—what you see is the final file available for immediate download.
Original: $10.00
-65%$10.00
$3.50Description
Your Competitive Advantage Starts with This Report
Explore how political shifts, fuel costs, labor markets, technological advances, and environmental regulations are shaping Heartland Express’s strategic outlook in our concise PESTLE snapshot. This analysis highlights risks and opportunities that matter to investors, fleet managers, and strategists. Purchase the full PESTLE for detailed implications, forecasts, and actionable recommendations to inform your next decision.
Political factors
Infrastructure and highway funding
Federal and state road spending directly affects transit times, safety, and maintenance costs; the Bipartisan Infrastructure Law (IIJA) allocates roughly $110 billion for roads and bridges through 2026. Robust funding reduces congestion and equipment wear, improving asset utilization and lowering per-mile operating costs. Political gridlock that delays projects degrades lanes and raises repair expenses. Heartland should align network planning with funded corridors and announced state projects.
Fuel taxation and incentives
Diesel excise taxes and state surcharges materially influence cost per mile: federal diesel excise is 24.3¢/gal and average state diesel tax ~32¢/gal (combined ~56¢/gal), adding roughly $0.08–0.12/mile depending on MPG. Shifts toward carbon pricing or fuel‑tax reforms (2024–25 proposals) could raise fuel costs and force routing/pricing changes. Targeted incentives and grants for cleaner fleets can offset tractor capex; monitoring tax changes preserves bid accuracy.
Cross-border trade policy (USMCA)
Stable North American trade under USMCA, in force since July 1, 2020, supports the manufacturing and retail flows Heartland serves; trilateral merchandise trade was about $1.7 trillion in 2023. Tariff disputes or customs rule changes can spike cross-border volumes and dwell times, disrupting schedules. Active compliance programs and port-of-entry partnerships mitigate this volatility. Diversifying lanes reduces exposure to policy shocks and single-border risk.
State-level regulations and tolling
Fragmented state rules on toll roads, weight limits, and emissions increase operational complexity for Heartland Express, forcing route deviations and varied compliance costs across jurisdictions.
Tolls on key corridors materially affect lane profitability and bid pricing, while disciplined network planning is required to harmonize permits, inspections, and electronic tolling across states.
Strategic use of toll lanes can improve on-time delivery for time-sensitive freight by reducing congestion-related variability.
- Fragmented regulations raise compliance overhead
- Tolls alter lane-level margins and bids
- Network planning needed for multi-state harmonization
- Toll lanes improve reliability for time-sensitive loads
Labor and transportation policy priorities
IIJA $110B boosts assets; diesel tax ~56¢/gal adds $0.08-0.12/mi; 80,000 driver gap
Federal IIJA $110B roads/bridges through 2026 improves asset utilization; combined diesel tax ~56¢/gal adds ~$0.08–0.12/mile; ATA estimated 80,000 driver shortfall (2022) sustains wage pressure; USMCA trade ~$1.7T (2023) underpins volumes but customs/tariff changes raise dwell times.
| Factor | Metric | Impact |
|---|---|---|
| Infrastructure | $110B IIJA | Lower Opex |
| Fuel taxes | ~56¢/gal | +$0.08–0.12/mile |
| Labor | 80,000 shortfall (2022) | Wage pressure |
| Trade | $1.7T (2023) | Stable volumes |
What is included in the product
Detailed Word Document
Explores how macro-environmental factors uniquely affect Heartland Express across Political, Economic, Social, Technological, Environmental, and Legal dimensions, with data-backed insights and trend analysis; designed for executives, consultants, and entrepreneurs to identify threats, opportunities, and forward-looking scenarios, delivered in clean, presentation-ready format.
Customizable Excel Spreadsheet
A concise, visually segmented PESTLE summary for Heartland Express that streamlines external risk assessment and market positioning, making it easy to drop into presentations, share across teams, and annotate with region- or business-specific notes for faster strategic decisions.
Economic factors
Freight demand cycles
Truckload volumes for Heartland Express track US retail sales (up ~3.0% in 2024) and industrial production (≈+1.2% in 2024), with inventory cycles—inventory-to-sales ~1.28—driving demand swings; softness compresses spot rates and utilization, while upcycles tighten capacity and lift yields. Diversification across retail, manufacturing and food (each ~20–35% of mix) smooths volatility, and dynamic pricing plus freight-mix management protect margins and yield improvement.
Diesel price volatility
Diesel is a major variable cost for Heartland Express, typically accounting for roughly 20-30% of trucking operating expenses, and U.S. retail diesel averaged about 4.00 per gallon in 2024 (EIA). Rapid price swings create timing mismatches between rising fuel costs and recovery via customer surcharges, squeezing margins. Efficiency measures—route optimization, fuel-efficient equipment—lower exposure per mile. Transparent, index-linked surcharge mechanisms help stabilize revenue.
Labor availability and wage inflation
Tight driver markets—American Trucking Associations estimated a shortage near 80,000 drivers in 2023—force Heartland to raise pay, sign-on bonuses and training spend, while BLS shows median heavy-truck driver pay $49,700 (May 2023). Wage competition can compress operating ratio if not offset by rate hikes and fleet efficiency; investing in retention and modern trucks plus stronger home-time policies reduces churn and onboarding costs.
Interest rates and capital intensity
New Class 8 tractors (~$160k–$200k new) and trailers ($40k–$60k) require substantial capex or financing; with US policy rates near 5.25–5.50% in mid‑2025 higher borrowing and lease costs compress Heartland Express free cash flow and raise debt service. Fleet age strategy must trade higher maintenance on older units versus elevated financing costs for replacements; counter‑cyclical buying during OEM slowdowns can secure significant discounts.
- Capex: new tractors $160k–$200k; trailers $40k–$60k
- Rates: policy rate ~5.25–5.50% (mid‑2025)
- Impact: higher lease/debt service lowers free cash flow
- Strategy: balance maintenance vs financing; buy counter‑cyclically for OEM discounts
Shipper consolidation and pricing power
Larger shippers increasingly award scale contracts and 3PL arrangements, pushing Heartland to accept tighter rates and stricter service SLAs to retain volume.
Winning strategic contract awards stabilizes load volumes but often compresses margins; maintaining on-time performance enables disciplined pricing and premium access to customers.
Diversifying the customer mix lowers concentration risk and improves resilience against shipper consolidation pressures.
- scale contracts pressure rates
- awards stabilize volumes, compress margins
- on-time performance supports price discipline
- diversification reduces concentration risk
IIJA $110B boosts assets; diesel tax ~56¢/gal adds $0.08-0.12/mi; 80,000 driver gap
Truckload demand tracks US retail sales (+≈3.0% in 2024) and industrial production (+≈1.2% in 2024), with inventory-to-sales ~1.28 driving volatility. Diesel averaged ≈$4.00/gal in 2024; drivers short ~80,000 (ATA 2023) pressures wages. Class 8 tractors $160k–$200k; US policy rate ~5.25–5.50% (mid‑2025) raises financing costs.
| Metric | Value |
|---|---|
| Retail sales (2024) | +≈3.0% |
| Industrial prod (2024) | +≈1.2% |
| Diesel (2024 avg) | $4.00/gal |
| Driver shortage (2023) | ~80,000 |
| Tractor price | $160k–$200k |
| Policy rate (mid‑2025) | 5.25–5.50% |
Preview the Actual Deliverable
Heartland Express PESTLE Analysis
The preview shown here is the exact document you’ll receive after purchase—fully formatted and ready to use. This Heartland Express PESTLE Analysis provides a complete, professionally structured review of political, economic, social, technological, legal, and environmental factors affecting the company. No placeholders or teasers—what you see is the final file available for immediate download.











