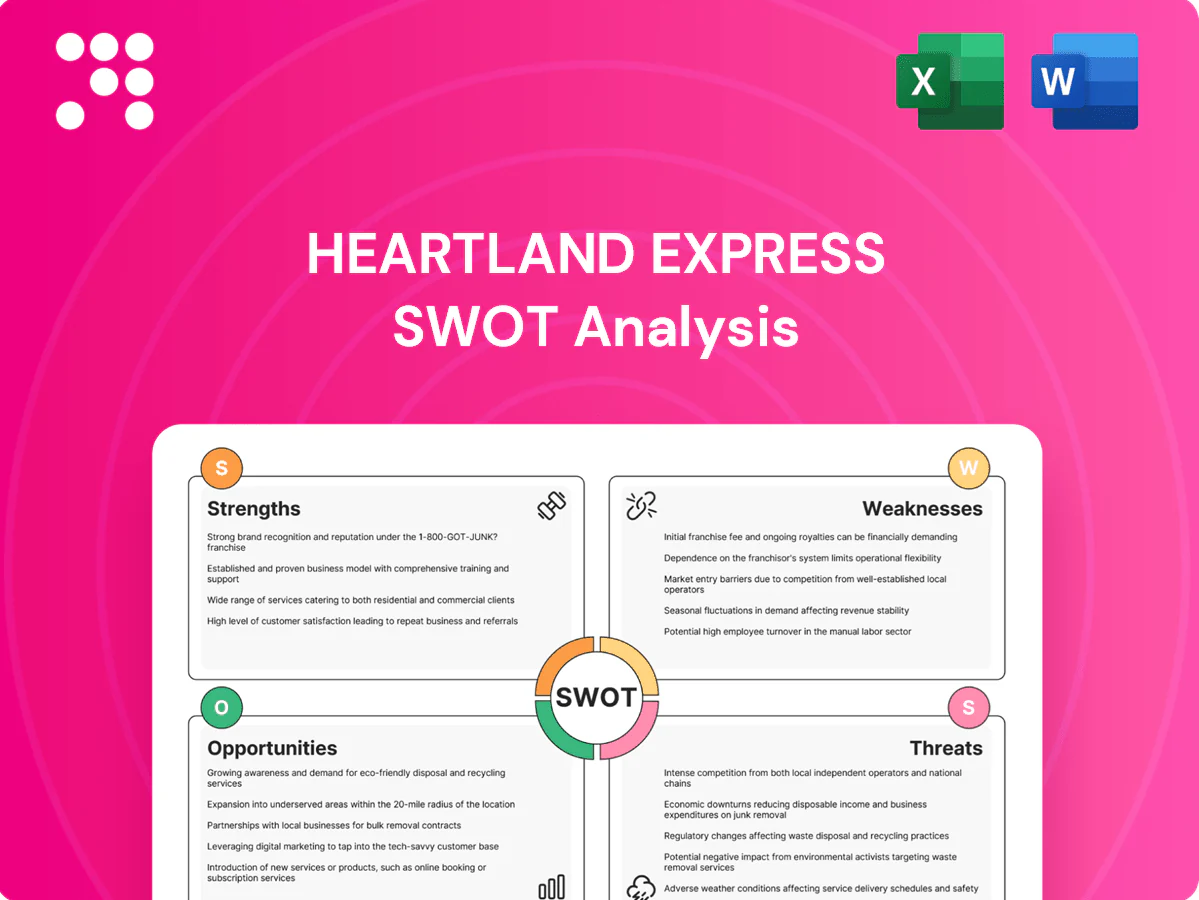
Heartland Express SWOT Analysis

Dive Deeper Into the Company’s Strategic Blueprint
Uncover where Heartland Express truly excels and where it faces operational and market pressures with our concise SWOT overview—perfect for investors and logistics strategists. The full SWOT delivers research-backed detail, expert commentary, and editable Word + Excel files to support decisions. Purchase the complete report to move from insight to action.
Strengths

Time‑sensitive reliability
Strong execution on on‑time delivery builds shipper trust for critical loads, enabling premium pricing and repeat awards in tight retail and manufacturing schedules. Consistent service reduces penalties and claims, lowering operating risk and cost volatility. Time‑sensitive reliability differentiates Heartland against fragmented competitors and supports durable customer relationships.
Modern, well‑maintained fleet
Heartland Expresss newer dry‑van fleet improves fuel efficiency, safety and uptime, supporting higher asset utilization and faster load turns. Industry studies show newer tractors can cut fuel use by up to 10% and unscheduled maintenance by ~20–30%, boosting revenue per tractor. Modern equipment aids driver recruitment and retention and helps meet EPA Phase 2 GHG and evolving safety standards for 2027+.

Safety culture and performance
Heartland Express, traded on NASDAQ: HTLD, maintains a safety-first posture that lowers accident-related costs and cargo claims, strengthening margins. Strong safety performance helps qualify the carrier for lower insurance rates and access to risk-averse shippers in food and retail segments. Safer operations reduce regulatory scrutiny and support long-term customer retention.

North American coverage
Heartland Express coverage across the United States and Canada supports regional, medium and long‑haul routing, enabling flexible lane allocation and higher backhaul capture to improve network balance.
Customers prefer single‑provider solutions across geographies, and breadth of coverage helps Heartland absorb seasonal demand swings and smooth utilization.
- Network: North American reach
- Capability: regional to long‑haul
- Benefit: backhaul and seasonality mitigation
Diversified end‑markets
Diversified end-markets across retail, manufacturing, and food spread demand risk for Heartland Express; food and staples provide countercyclical stability while manufacturing and retail create pronounced seasonal peaks, supporting steadier equipment utilization. As of year-end 2024 Heartland operated roughly 4,700 tractors and 8,600 trailers, aiding flexibility.
- Exposure: retail, manufacturing, food
- Stability: food/staples during downturns
- Peaks: manufacturing/retail seasonality
- Fleet: ~4,700 tractors, ~8,600 trailers (YE2024)
Reliable on‑time, fuel‑efficient dry‑van fleet, safety‑first, ~4,700 tractors
Reliable on‑time delivery, newer fuel‑efficient dry‑van fleet, safety‑first operations, North American network and diversified end‑markets drive premium pricing, lower costs and consistent utilization (fleet ~4,700 tractors, 8,600 trailers YE2024).
| Metric | Value |
|---|---|
| Ticker | HTLD |
| Tractors (YE2024) | ~4,700 |
| Trailers (YE2024) | ~8,600 |
What is included in the product
 Detailed Word Document
Provides a concise SWOT overview of Heartland Express, highlighting internal strengths and weaknesses and external opportunities and threats to assess its competitive position and strategic risks.

 Customizable Excel Spreadsheet
Provides a concise, at-a-glance SWOT matrix tailored to Heartland Express to quickly align strategy, relieve reporting bottlenecks, and simplify stakeholder briefings.
Weaknesses

Dry‑van concentration
Heavy reliance on time‑sensitive dry‑van freight—Heartland discloses its business is primarily dry‑van in its 2024 10‑K—limits exposure to higher‑margin refrigerated, flatbed or tanker niches. Absence of refrigerated/flatbed/tanker operations reduces diversification and cross‑sell breadth. This equipment mix can cap pricing power in commoditized lanes and compress margins during capacity surges.
High fixed‑cost base
Trucks, trailers and terminals create significant operating leverage for Heartland Express, so when miles per tractor fall in soft markets margins compress quickly. Utilization dips can erode profitability within weeks as fixed costs remain; cost absorption relies on steady freight density and consistent route fill rates. Lower utilization amplifies volatility in quarterly operating results.

Driver recruitment and turnover
Industry‑wide driver scarcity (ATA estimated a shortfall of about 80,000 drivers in 2023) raises Heartland’s hiring and retention costs. Time‑sensitive schedules intensify burnout and turnover, despite median heavy‑truck pay of $49,370 (BLS, May 2023). Necessary training and safety investments increase per‑driver expenses, and labor constraints risk capping capacity during demand upswings.

Fuel cost exposure
Volatile diesel (U.S. average about $3.96/gal in 2024 per EIA) strains Heartland Express cash flow despite fuel surcharges; surcharge lag and caps can compress margins during price spikes. Idling, detention and routing inefficiencies amplify fuel drag, and rapid fuel swings complicate bid pricing and contract competitiveness.
- Fuel price (EIA 2024): $3.96/gal
- Surcharge lag compresses margins
- Idling/detention worsen fuel burn
- Fuel volatility hinders accurate bids
Customer concentration risk
Serving large retail and manufacturing shippers concentrates revenue, leaving Heartland exposed when bid cycles and mini‑bids force frequent rate resets and margin compression. Loss of a key account would reduce lane density on affected routes, raising per‑mile costs and utilization risk. Dependence on a few big shippers elevates pricing pressure during contract renewals and limits negotiating leverage.
- Revenue concentration risk
- Rate volatility from bid cycles
- Lane density exposure
- Elevated pricing pressure
Dry‑van reliance, driver shortfall (~80,000) and $3.96 diesel compress margins
Heartland’s heavy reliance on dry‑van freight (2024 10‑K) limits access to higher‑margin niches and caps pricing power in commoditized lanes. High fixed fleet costs make margins sensitive to utilization drops, compressing results quickly in soft markets. Industry driver shortfall (~80,000, ATA 2023) and rising retention costs plus volatile diesel (US avg $3.96/gal, EIA 2024) further pressure margins.
| Metric | Value |
|---|---|
| Business mix | Primarily dry‑van (2024 10‑K) |
| Driver shortfall | ~80,000 (ATA 2023) |
| Median heavy‑truck pay | $49,370 (BLS May 2023) |
| Diesel price | $3.96/gal (EIA 2024) |
What You See Is What You Get
Heartland Express SWOT Analysis
This is the actual SWOT analysis document you’ll receive upon purchase—no surprises, just professional quality. The preview below is pulled directly from the full report so what you see is what you get. Buy to unlock the complete, editable file immediately after checkout.

Dive Deeper Into the Company’s Strategic Blueprint
Uncover where Heartland Express truly excels and where it faces operational and market pressures with our concise SWOT overview—perfect for investors and logistics strategists. The full SWOT delivers research-backed detail, expert commentary, and editable Word + Excel files to support decisions. Purchase the complete report to move from insight to action.
Strengths
Time‑sensitive reliability
Strong execution on on‑time delivery builds shipper trust for critical loads, enabling premium pricing and repeat awards in tight retail and manufacturing schedules. Consistent service reduces penalties and claims, lowering operating risk and cost volatility. Time‑sensitive reliability differentiates Heartland against fragmented competitors and supports durable customer relationships.
Modern, well‑maintained fleet
Heartland Expresss newer dry‑van fleet improves fuel efficiency, safety and uptime, supporting higher asset utilization and faster load turns. Industry studies show newer tractors can cut fuel use by up to 10% and unscheduled maintenance by ~20–30%, boosting revenue per tractor. Modern equipment aids driver recruitment and retention and helps meet EPA Phase 2 GHG and evolving safety standards for 2027+.
Safety culture and performance
Heartland Express, traded on NASDAQ: HTLD, maintains a safety-first posture that lowers accident-related costs and cargo claims, strengthening margins. Strong safety performance helps qualify the carrier for lower insurance rates and access to risk-averse shippers in food and retail segments. Safer operations reduce regulatory scrutiny and support long-term customer retention.
North American coverage
Heartland Express coverage across the United States and Canada supports regional, medium and long‑haul routing, enabling flexible lane allocation and higher backhaul capture to improve network balance.
Customers prefer single‑provider solutions across geographies, and breadth of coverage helps Heartland absorb seasonal demand swings and smooth utilization.
- Network: North American reach
- Capability: regional to long‑haul
- Benefit: backhaul and seasonality mitigation
Diversified end‑markets
Diversified end-markets across retail, manufacturing, and food spread demand risk for Heartland Express; food and staples provide countercyclical stability while manufacturing and retail create pronounced seasonal peaks, supporting steadier equipment utilization. As of year-end 2024 Heartland operated roughly 4,700 tractors and 8,600 trailers, aiding flexibility.
- Exposure: retail, manufacturing, food
- Stability: food/staples during downturns
- Peaks: manufacturing/retail seasonality
- Fleet: ~4,700 tractors, ~8,600 trailers (YE2024)
Reliable on‑time, fuel‑efficient dry‑van fleet, safety‑first, ~4,700 tractors
Reliable on‑time delivery, newer fuel‑efficient dry‑van fleet, safety‑first operations, North American network and diversified end‑markets drive premium pricing, lower costs and consistent utilization (fleet ~4,700 tractors, 8,600 trailers YE2024).
| Metric | Value |
|---|---|
| Ticker | HTLD |
| Tractors (YE2024) | ~4,700 |
| Trailers (YE2024) | ~8,600 |
What is included in the product
Detailed Word Document
Provides a concise SWOT overview of Heartland Express, highlighting internal strengths and weaknesses and external opportunities and threats to assess its competitive position and strategic risks.
Customizable Excel Spreadsheet
Provides a concise, at-a-glance SWOT matrix tailored to Heartland Express to quickly align strategy, relieve reporting bottlenecks, and simplify stakeholder briefings.
Weaknesses
Dry‑van concentration
Heavy reliance on time‑sensitive dry‑van freight—Heartland discloses its business is primarily dry‑van in its 2024 10‑K—limits exposure to higher‑margin refrigerated, flatbed or tanker niches. Absence of refrigerated/flatbed/tanker operations reduces diversification and cross‑sell breadth. This equipment mix can cap pricing power in commoditized lanes and compress margins during capacity surges.
High fixed‑cost base
Trucks, trailers and terminals create significant operating leverage for Heartland Express, so when miles per tractor fall in soft markets margins compress quickly. Utilization dips can erode profitability within weeks as fixed costs remain; cost absorption relies on steady freight density and consistent route fill rates. Lower utilization amplifies volatility in quarterly operating results.
Driver recruitment and turnover
Industry‑wide driver scarcity (ATA estimated a shortfall of about 80,000 drivers in 2023) raises Heartland’s hiring and retention costs. Time‑sensitive schedules intensify burnout and turnover, despite median heavy‑truck pay of $49,370 (BLS, May 2023). Necessary training and safety investments increase per‑driver expenses, and labor constraints risk capping capacity during demand upswings.
Fuel cost exposure
Volatile diesel (U.S. average about $3.96/gal in 2024 per EIA) strains Heartland Express cash flow despite fuel surcharges; surcharge lag and caps can compress margins during price spikes. Idling, detention and routing inefficiencies amplify fuel drag, and rapid fuel swings complicate bid pricing and contract competitiveness.
- Fuel price (EIA 2024): $3.96/gal
- Surcharge lag compresses margins
- Idling/detention worsen fuel burn
- Fuel volatility hinders accurate bids
Customer concentration risk
Serving large retail and manufacturing shippers concentrates revenue, leaving Heartland exposed when bid cycles and mini‑bids force frequent rate resets and margin compression. Loss of a key account would reduce lane density on affected routes, raising per‑mile costs and utilization risk. Dependence on a few big shippers elevates pricing pressure during contract renewals and limits negotiating leverage.
- Revenue concentration risk
- Rate volatility from bid cycles
- Lane density exposure
- Elevated pricing pressure
Dry‑van reliance, driver shortfall (~80,000) and $3.96 diesel compress margins
Heartland’s heavy reliance on dry‑van freight (2024 10‑K) limits access to higher‑margin niches and caps pricing power in commoditized lanes. High fixed fleet costs make margins sensitive to utilization drops, compressing results quickly in soft markets. Industry driver shortfall (~80,000, ATA 2023) and rising retention costs plus volatile diesel (US avg $3.96/gal, EIA 2024) further pressure margins.
| Metric | Value |
|---|---|
| Business mix | Primarily dry‑van (2024 10‑K) |
| Driver shortfall | ~80,000 (ATA 2023) |
| Median heavy‑truck pay | $49,370 (BLS May 2023) |
| Diesel price | $3.96/gal (EIA 2024) |
What You See Is What You Get
Heartland Express SWOT Analysis
This is the actual SWOT analysis document you’ll receive upon purchase—no surprises, just professional quality. The preview below is pulled directly from the full report so what you see is what you get. Buy to unlock the complete, editable file immediately after checkout.
Original: $10.00
-65%$10.00
$3.50Description
Dive Deeper Into the Company’s Strategic Blueprint
Uncover where Heartland Express truly excels and where it faces operational and market pressures with our concise SWOT overview—perfect for investors and logistics strategists. The full SWOT delivers research-backed detail, expert commentary, and editable Word + Excel files to support decisions. Purchase the complete report to move from insight to action.
Strengths
Time‑sensitive reliability
Strong execution on on‑time delivery builds shipper trust for critical loads, enabling premium pricing and repeat awards in tight retail and manufacturing schedules. Consistent service reduces penalties and claims, lowering operating risk and cost volatility. Time‑sensitive reliability differentiates Heartland against fragmented competitors and supports durable customer relationships.
Modern, well‑maintained fleet
Heartland Expresss newer dry‑van fleet improves fuel efficiency, safety and uptime, supporting higher asset utilization and faster load turns. Industry studies show newer tractors can cut fuel use by up to 10% and unscheduled maintenance by ~20–30%, boosting revenue per tractor. Modern equipment aids driver recruitment and retention and helps meet EPA Phase 2 GHG and evolving safety standards for 2027+.
Safety culture and performance
Heartland Express, traded on NASDAQ: HTLD, maintains a safety-first posture that lowers accident-related costs and cargo claims, strengthening margins. Strong safety performance helps qualify the carrier for lower insurance rates and access to risk-averse shippers in food and retail segments. Safer operations reduce regulatory scrutiny and support long-term customer retention.
North American coverage
Heartland Express coverage across the United States and Canada supports regional, medium and long‑haul routing, enabling flexible lane allocation and higher backhaul capture to improve network balance.
Customers prefer single‑provider solutions across geographies, and breadth of coverage helps Heartland absorb seasonal demand swings and smooth utilization.
- Network: North American reach
- Capability: regional to long‑haul
- Benefit: backhaul and seasonality mitigation
Diversified end‑markets
Diversified end-markets across retail, manufacturing, and food spread demand risk for Heartland Express; food and staples provide countercyclical stability while manufacturing and retail create pronounced seasonal peaks, supporting steadier equipment utilization. As of year-end 2024 Heartland operated roughly 4,700 tractors and 8,600 trailers, aiding flexibility.
- Exposure: retail, manufacturing, food
- Stability: food/staples during downturns
- Peaks: manufacturing/retail seasonality
- Fleet: ~4,700 tractors, ~8,600 trailers (YE2024)
Reliable on‑time, fuel‑efficient dry‑van fleet, safety‑first, ~4,700 tractors
Reliable on‑time delivery, newer fuel‑efficient dry‑van fleet, safety‑first operations, North American network and diversified end‑markets drive premium pricing, lower costs and consistent utilization (fleet ~4,700 tractors, 8,600 trailers YE2024).
| Metric | Value |
|---|---|
| Ticker | HTLD |
| Tractors (YE2024) | ~4,700 |
| Trailers (YE2024) | ~8,600 |
What is included in the product
Detailed Word Document
Provides a concise SWOT overview of Heartland Express, highlighting internal strengths and weaknesses and external opportunities and threats to assess its competitive position and strategic risks.
Customizable Excel Spreadsheet
Provides a concise, at-a-glance SWOT matrix tailored to Heartland Express to quickly align strategy, relieve reporting bottlenecks, and simplify stakeholder briefings.
Weaknesses
Dry‑van concentration
Heavy reliance on time‑sensitive dry‑van freight—Heartland discloses its business is primarily dry‑van in its 2024 10‑K—limits exposure to higher‑margin refrigerated, flatbed or tanker niches. Absence of refrigerated/flatbed/tanker operations reduces diversification and cross‑sell breadth. This equipment mix can cap pricing power in commoditized lanes and compress margins during capacity surges.
High fixed‑cost base
Trucks, trailers and terminals create significant operating leverage for Heartland Express, so when miles per tractor fall in soft markets margins compress quickly. Utilization dips can erode profitability within weeks as fixed costs remain; cost absorption relies on steady freight density and consistent route fill rates. Lower utilization amplifies volatility in quarterly operating results.
Driver recruitment and turnover
Industry‑wide driver scarcity (ATA estimated a shortfall of about 80,000 drivers in 2023) raises Heartland’s hiring and retention costs. Time‑sensitive schedules intensify burnout and turnover, despite median heavy‑truck pay of $49,370 (BLS, May 2023). Necessary training and safety investments increase per‑driver expenses, and labor constraints risk capping capacity during demand upswings.
Fuel cost exposure
Volatile diesel (U.S. average about $3.96/gal in 2024 per EIA) strains Heartland Express cash flow despite fuel surcharges; surcharge lag and caps can compress margins during price spikes. Idling, detention and routing inefficiencies amplify fuel drag, and rapid fuel swings complicate bid pricing and contract competitiveness.
- Fuel price (EIA 2024): $3.96/gal
- Surcharge lag compresses margins
- Idling/detention worsen fuel burn
- Fuel volatility hinders accurate bids
Customer concentration risk
Serving large retail and manufacturing shippers concentrates revenue, leaving Heartland exposed when bid cycles and mini‑bids force frequent rate resets and margin compression. Loss of a key account would reduce lane density on affected routes, raising per‑mile costs and utilization risk. Dependence on a few big shippers elevates pricing pressure during contract renewals and limits negotiating leverage.
- Revenue concentration risk
- Rate volatility from bid cycles
- Lane density exposure
- Elevated pricing pressure
Dry‑van reliance, driver shortfall (~80,000) and $3.96 diesel compress margins
Heartland’s heavy reliance on dry‑van freight (2024 10‑K) limits access to higher‑margin niches and caps pricing power in commoditized lanes. High fixed fleet costs make margins sensitive to utilization drops, compressing results quickly in soft markets. Industry driver shortfall (~80,000, ATA 2023) and rising retention costs plus volatile diesel (US avg $3.96/gal, EIA 2024) further pressure margins.
| Metric | Value |
|---|---|
| Business mix | Primarily dry‑van (2024 10‑K) |
| Driver shortfall | ~80,000 (ATA 2023) |
| Median heavy‑truck pay | $49,370 (BLS May 2023) |
| Diesel price | $3.96/gal (EIA 2024) |
What You See Is What You Get
Heartland Express SWOT Analysis
This is the actual SWOT analysis document you’ll receive upon purchase—no surprises, just professional quality. The preview below is pulled directly from the full report so what you see is what you get. Buy to unlock the complete, editable file immediately after checkout.











