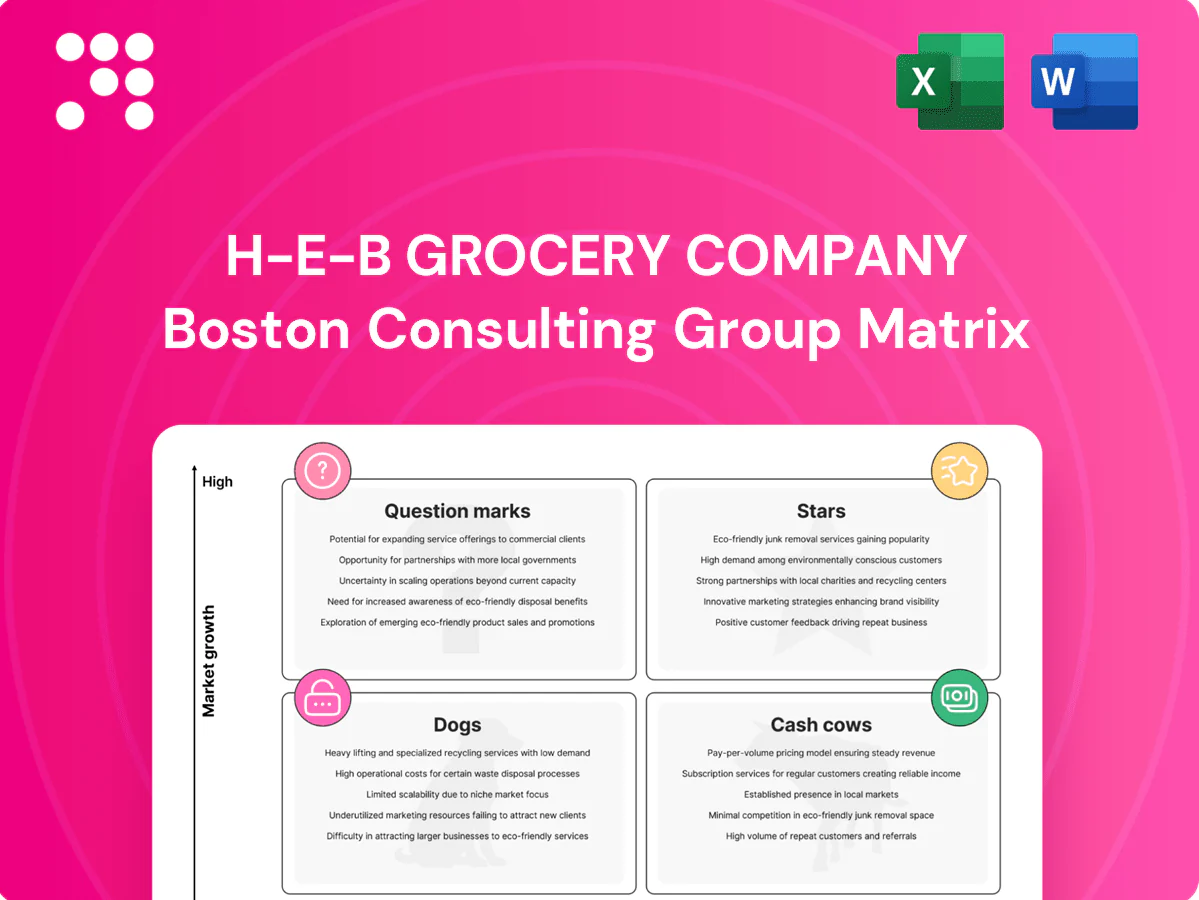
H-E-B Grocery Company Boston Consulting Group Matrix

See the Bigger Picture
The H‑E‑B Grocery Company BCG Matrix preview shows where key product lines land—some are Stars, others are Cash Cows, and a few need tough decisions. Want the full picture? Purchase the complete BCG Matrix for quadrant-by-quadrant placements, data-backed recommendations, and strategic moves tailored to H‑E‑B’s market position. Buy now and get a polished Word report plus an Excel summary you can use in board decks and investment planning.
Stars

Curbside & Delivery (H‑E‑B + Favor)
Online grocery is ripping: US online grocery penetration climbed to roughly 10% of grocery sales by 2023–24, and H‑E‑B, with its 2020 Favor acquisition, leverages this tailwind. H‑E‑B commands about a 40% share of the Texas grocery market, but scaling curbside and last‑mile requires heavy capex in dark stores and picking. Cash in, cash out — H‑E‑B has funneled well over $1bn into fulfillment and delivery since 2020 to lock in scale before growth tapers.
H‑E‑B plus! formats in high‑growth metros
H‑E‑B plus! big‑box formats are capturing booming Texas suburban demand, with traffic and share strong across metros where H‑E‑B reports roughly 420 stores and estimated 2024 sales of about $38.7 billion. Remodels and new openings carry high upfront costs—capex per project often in the millions—making this a scale game with initial burn. Invest to cement leadership and convert growth into sustainable cash cows.

Prepared Foods & Meal Simple
Shoppers are visibly trading time for ready-to-eat options as convenience demand surged; U.S. prepared foods sales rose about 10% in 2024, outpacing center-store growth near 1–2%. H-E-B’s quality and breadth give it a lead, but kitchen capacity, labor and merchandising require continuous investment to avoid bottlenecks. Margins remain attractive; keep pushing production, packaging and premium in-store display to capture outsized growth.

H‑E‑B Organics & Fresh Value‑Add
H‑E‑B Organics & Fresh value‑add benefits from continued strong demand as U.S. organic retail sales topped $62B in 2024; premium produce and in‑store bakery remain high-margin drivers. H‑E‑B owns the shelf but must keep investing in sourcing, cold chain and shrink control; the division generates cash yet is rapidly reinvested into assortment and farm partnerships.
- Growth: U.S. organics >$62B (2024)
- Needs: sourcing, cold chain, shrink control
- Strategy: aggressive assortment, farm partnerships
- Finance: cash generative, high reinvestment
My H‑E‑B App & Digital Loyalty
My H‑E‑B App & Digital Loyalty
Digital engagement is scaling fast via e‑coupons, saved baskets and hyper‑personalization, driving high frequency visits; H‑E‑B operates ~420 stores (2024) to amplify reach. The data flywheel is powerful but dependent on continued tech spend and media support to convert insights into sales. High growth and rising in‑state share justify funding features and adops to lock customers in.- Digital engagement: e‑coupons, baskets, personalization
- Investment needs: tech spend + media support
- Status: high growth, rising in‑state share
- Action: keep funding features and adops
Scaling big-box + online — 420 stores, $38.7B
H‑E‑B stars: 420 stores and estimated 2024 sales ~$38.7B, scaling big‑box and online (US online grocery ~10% 2023–24). >$1bn invested in fulfillment since 2020 to cement last‑mile; high reinvestment keeps margins under pressure. Organics/fresh and prepared foods (US organics ~$62B 2024) drive premium margins but require cold chain and sourcing capex.
| Metric | Value (2024) |
|---|---|
| Stores | 420 |
| Sales | $38.7B |
| Online penetration | ~10% |
| Fulfillment capex since 2020 | >$1B |
| US organics | $62B |
What is included in the product
 Detailed Word Document
BCG analysis of H‑E‑B: identifies Stars, Cash Cows, Question Marks, Dogs with strategic recommendations to invest, hold, or divest.

 Customizable Excel Spreadsheet
One-page H-E-B BCG Matrix that simplifies portfolio choices—export-ready for C-level decks and A4 print.
Cash Cows

Core Private Label (H‑E‑B, Hill Country Fare, Central Market)
Core private label (H‑E‑B, Hill Country Fare, Central Market) sits in a mature category with dominant share, driving high velocity and a strong margin mix while requiring low promotional support. In 2024 H‑E‑B’s private brands leverage a network of more than 400 stores across Texas and Mexico to fund innovation and portfolio growth. Maintain quality, preserve price gaps, and secure supply — milk it.
Mature Texas Supermarket Footprint
Mature Texas supermarket footprint with over 400 stores and roughly 153,000 employees (2024) generates dependable cash in legacy markets. Growth is low, but tight supply-chain efficiency and extensive real estate control keep gross margins resilient. Light reinvestment—store refreshes, energy upgrades—delivers high ROI. Optimizing labor scheduling, store flow, and energy use can further squeeze incremental yield.

Pharmacy Scripts & Immunizations
Pharmacy scripts and immunizations drive recurring demand and loyal in-store traffic across H-E-B’s more than 430 stores, with the pharmacy network serving millions of prescriptions annually and delivering high cross-shop conversion into grocery and CPG sales. The pharmacy market shows modest growth (roughly 2–3% annually), yet H-E-B’s share is stout, making this a stable cash generator requiring limited incremental capital. Priority remains on adherence programs and vaccination throughput to sustain utilization and margin.

Fuel Stations
H-E-B fuel stations are classic cash cows: low category growth but steady volume that drives in-store basket lift and predictable cash flow; NACS reports fuel represented about 68% of convenience-store dollar sales (2023), while typical retail fuel gross margin runs roughly $0.10–$0.25 per gallon (industry/EIA ranges). Minimal marketing is needed—use stations for traffic and cash, not heroics, while tightening ops and applying dynamic pricing to protect margin.
- Role: traffic driver, steady cash
- Marketing: minimal
- Ops: tighten efficiency
- Pricing: dynamic to defend $0.10–$0.25/gal margin
Distribution & Owned Real Estate Advantage
H-E-B leverages scale in warehousing and predominantly owned sites (420+ stores, 150,000+ employees) to lower unit costs in a mature Texas market where savings are highly bankable; throughput upgrades and automation raised distribution efficiency in 2024, improving cash conversion and inventory turns. Continue funding automation projects with clear ROI thresholds.
- Scale: 420+ stores; 150,000+ employees
- Market: mature, steady demand—cost savings translate to cash
- Operations: upgrades↑ throughput, better cash conversion
- Strategy: invest in automation where ROI is proven
Grocery cash engines: private labels, pharmacies, fuel — protect margins, automate smart
H-E-B cash cows—private labels, mature Texas stores, pharmacy network, and fuel—deliver steady free cash flow from 420–430 stores and ~153,000 employees (2024). Private brands and pharmacies show low growth (2–3%) but high margin/rate of return; fuel margin about $0.10–$0.25/gal. Focus: preserve price gaps, tighten ops, invest selectively in ROI-positive automation.
| Asset | 2024 Metric | Role |
|---|---|---|
| Stores | 420–430 | Core cash |
| Employees | ~153,000 | Scale |
| Pharmacy | 2–3% growth | Recurring cash |
| Fuel | $0.10–$0.25/gal | Traffic/cash |
Full Transparency, Always
H-E-B Grocery Company BCG Matrix
The file you're previewing is the final H‑E‑B Grocery Company BCG Matrix you'll receive after purchase. No watermarks or demo content—just a fully formatted, ready-to-use strategic report tailored to H‑E‑B's portfolio. Once bought, the exact same document is delivered to your inbox for immediate editing, printing, or presenting to stakeholders. Clean, professional, and analysis-ready—no surprises.

See the Bigger Picture
The H‑E‑B Grocery Company BCG Matrix preview shows where key product lines land—some are Stars, others are Cash Cows, and a few need tough decisions. Want the full picture? Purchase the complete BCG Matrix for quadrant-by-quadrant placements, data-backed recommendations, and strategic moves tailored to H‑E‑B’s market position. Buy now and get a polished Word report plus an Excel summary you can use in board decks and investment planning.
Stars
Curbside & Delivery (H‑E‑B + Favor)
Online grocery is ripping: US online grocery penetration climbed to roughly 10% of grocery sales by 2023–24, and H‑E‑B, with its 2020 Favor acquisition, leverages this tailwind. H‑E‑B commands about a 40% share of the Texas grocery market, but scaling curbside and last‑mile requires heavy capex in dark stores and picking. Cash in, cash out — H‑E‑B has funneled well over $1bn into fulfillment and delivery since 2020 to lock in scale before growth tapers.
H‑E‑B plus! formats in high‑growth metros
H‑E‑B plus! big‑box formats are capturing booming Texas suburban demand, with traffic and share strong across metros where H‑E‑B reports roughly 420 stores and estimated 2024 sales of about $38.7 billion. Remodels and new openings carry high upfront costs—capex per project often in the millions—making this a scale game with initial burn. Invest to cement leadership and convert growth into sustainable cash cows.
Prepared Foods & Meal Simple
Shoppers are visibly trading time for ready-to-eat options as convenience demand surged; U.S. prepared foods sales rose about 10% in 2024, outpacing center-store growth near 1–2%. H-E-B’s quality and breadth give it a lead, but kitchen capacity, labor and merchandising require continuous investment to avoid bottlenecks. Margins remain attractive; keep pushing production, packaging and premium in-store display to capture outsized growth.
H‑E‑B Organics & Fresh Value‑Add
H‑E‑B Organics & Fresh value‑add benefits from continued strong demand as U.S. organic retail sales topped $62B in 2024; premium produce and in‑store bakery remain high-margin drivers. H‑E‑B owns the shelf but must keep investing in sourcing, cold chain and shrink control; the division generates cash yet is rapidly reinvested into assortment and farm partnerships.
- Growth: U.S. organics >$62B (2024)
- Needs: sourcing, cold chain, shrink control
- Strategy: aggressive assortment, farm partnerships
- Finance: cash generative, high reinvestment
My H‑E‑B App & Digital Loyalty
My H‑E‑B App & Digital Loyalty
Digital engagement is scaling fast via e‑coupons, saved baskets and hyper‑personalization, driving high frequency visits; H‑E‑B operates ~420 stores (2024) to amplify reach. The data flywheel is powerful but dependent on continued tech spend and media support to convert insights into sales. High growth and rising in‑state share justify funding features and adops to lock customers in.- Digital engagement: e‑coupons, baskets, personalization
- Investment needs: tech spend + media support
- Status: high growth, rising in‑state share
- Action: keep funding features and adops
Scaling big-box + online — 420 stores, $38.7B
H‑E‑B stars: 420 stores and estimated 2024 sales ~$38.7B, scaling big‑box and online (US online grocery ~10% 2023–24). >$1bn invested in fulfillment since 2020 to cement last‑mile; high reinvestment keeps margins under pressure. Organics/fresh and prepared foods (US organics ~$62B 2024) drive premium margins but require cold chain and sourcing capex.
| Metric | Value (2024) |
|---|---|
| Stores | 420 |
| Sales | $38.7B |
| Online penetration | ~10% |
| Fulfillment capex since 2020 | >$1B |
| US organics | $62B |
What is included in the product
Detailed Word Document
BCG analysis of H‑E‑B: identifies Stars, Cash Cows, Question Marks, Dogs with strategic recommendations to invest, hold, or divest.
Customizable Excel Spreadsheet
One-page H-E-B BCG Matrix that simplifies portfolio choices—export-ready for C-level decks and A4 print.
Cash Cows
Core Private Label (H‑E‑B, Hill Country Fare, Central Market)
Core private label (H‑E‑B, Hill Country Fare, Central Market) sits in a mature category with dominant share, driving high velocity and a strong margin mix while requiring low promotional support. In 2024 H‑E‑B’s private brands leverage a network of more than 400 stores across Texas and Mexico to fund innovation and portfolio growth. Maintain quality, preserve price gaps, and secure supply — milk it.
Mature Texas Supermarket Footprint
Mature Texas supermarket footprint with over 400 stores and roughly 153,000 employees (2024) generates dependable cash in legacy markets. Growth is low, but tight supply-chain efficiency and extensive real estate control keep gross margins resilient. Light reinvestment—store refreshes, energy upgrades—delivers high ROI. Optimizing labor scheduling, store flow, and energy use can further squeeze incremental yield.
Pharmacy Scripts & Immunizations
Pharmacy scripts and immunizations drive recurring demand and loyal in-store traffic across H-E-B’s more than 430 stores, with the pharmacy network serving millions of prescriptions annually and delivering high cross-shop conversion into grocery and CPG sales. The pharmacy market shows modest growth (roughly 2–3% annually), yet H-E-B’s share is stout, making this a stable cash generator requiring limited incremental capital. Priority remains on adherence programs and vaccination throughput to sustain utilization and margin.
Fuel Stations
H-E-B fuel stations are classic cash cows: low category growth but steady volume that drives in-store basket lift and predictable cash flow; NACS reports fuel represented about 68% of convenience-store dollar sales (2023), while typical retail fuel gross margin runs roughly $0.10–$0.25 per gallon (industry/EIA ranges). Minimal marketing is needed—use stations for traffic and cash, not heroics, while tightening ops and applying dynamic pricing to protect margin.
- Role: traffic driver, steady cash
- Marketing: minimal
- Ops: tighten efficiency
- Pricing: dynamic to defend $0.10–$0.25/gal margin
Distribution & Owned Real Estate Advantage
H-E-B leverages scale in warehousing and predominantly owned sites (420+ stores, 150,000+ employees) to lower unit costs in a mature Texas market where savings are highly bankable; throughput upgrades and automation raised distribution efficiency in 2024, improving cash conversion and inventory turns. Continue funding automation projects with clear ROI thresholds.
- Scale: 420+ stores; 150,000+ employees
- Market: mature, steady demand—cost savings translate to cash
- Operations: upgrades↑ throughput, better cash conversion
- Strategy: invest in automation where ROI is proven
Grocery cash engines: private labels, pharmacies, fuel — protect margins, automate smart
H-E-B cash cows—private labels, mature Texas stores, pharmacy network, and fuel—deliver steady free cash flow from 420–430 stores and ~153,000 employees (2024). Private brands and pharmacies show low growth (2–3%) but high margin/rate of return; fuel margin about $0.10–$0.25/gal. Focus: preserve price gaps, tighten ops, invest selectively in ROI-positive automation.
| Asset | 2024 Metric | Role |
|---|---|---|
| Stores | 420–430 | Core cash |
| Employees | ~153,000 | Scale |
| Pharmacy | 2–3% growth | Recurring cash |
| Fuel | $0.10–$0.25/gal | Traffic/cash |
Full Transparency, Always
H-E-B Grocery Company BCG Matrix
The file you're previewing is the final H‑E‑B Grocery Company BCG Matrix you'll receive after purchase. No watermarks or demo content—just a fully formatted, ready-to-use strategic report tailored to H‑E‑B's portfolio. Once bought, the exact same document is delivered to your inbox for immediate editing, printing, or presenting to stakeholders. Clean, professional, and analysis-ready—no surprises.
Original: $10.00
-65%$10.00
$3.50Description
See the Bigger Picture
The H‑E‑B Grocery Company BCG Matrix preview shows where key product lines land—some are Stars, others are Cash Cows, and a few need tough decisions. Want the full picture? Purchase the complete BCG Matrix for quadrant-by-quadrant placements, data-backed recommendations, and strategic moves tailored to H‑E‑B’s market position. Buy now and get a polished Word report plus an Excel summary you can use in board decks and investment planning.
Stars
Curbside & Delivery (H‑E‑B + Favor)
Online grocery is ripping: US online grocery penetration climbed to roughly 10% of grocery sales by 2023–24, and H‑E‑B, with its 2020 Favor acquisition, leverages this tailwind. H‑E‑B commands about a 40% share of the Texas grocery market, but scaling curbside and last‑mile requires heavy capex in dark stores and picking. Cash in, cash out — H‑E‑B has funneled well over $1bn into fulfillment and delivery since 2020 to lock in scale before growth tapers.
H‑E‑B plus! formats in high‑growth metros
H‑E‑B plus! big‑box formats are capturing booming Texas suburban demand, with traffic and share strong across metros where H‑E‑B reports roughly 420 stores and estimated 2024 sales of about $38.7 billion. Remodels and new openings carry high upfront costs—capex per project often in the millions—making this a scale game with initial burn. Invest to cement leadership and convert growth into sustainable cash cows.
Prepared Foods & Meal Simple
Shoppers are visibly trading time for ready-to-eat options as convenience demand surged; U.S. prepared foods sales rose about 10% in 2024, outpacing center-store growth near 1–2%. H-E-B’s quality and breadth give it a lead, but kitchen capacity, labor and merchandising require continuous investment to avoid bottlenecks. Margins remain attractive; keep pushing production, packaging and premium in-store display to capture outsized growth.
H‑E‑B Organics & Fresh Value‑Add
H‑E‑B Organics & Fresh value‑add benefits from continued strong demand as U.S. organic retail sales topped $62B in 2024; premium produce and in‑store bakery remain high-margin drivers. H‑E‑B owns the shelf but must keep investing in sourcing, cold chain and shrink control; the division generates cash yet is rapidly reinvested into assortment and farm partnerships.
- Growth: U.S. organics >$62B (2024)
- Needs: sourcing, cold chain, shrink control
- Strategy: aggressive assortment, farm partnerships
- Finance: cash generative, high reinvestment
My H‑E‑B App & Digital Loyalty
My H‑E‑B App & Digital Loyalty
Digital engagement is scaling fast via e‑coupons, saved baskets and hyper‑personalization, driving high frequency visits; H‑E‑B operates ~420 stores (2024) to amplify reach. The data flywheel is powerful but dependent on continued tech spend and media support to convert insights into sales. High growth and rising in‑state share justify funding features and adops to lock customers in.- Digital engagement: e‑coupons, baskets, personalization
- Investment needs: tech spend + media support
- Status: high growth, rising in‑state share
- Action: keep funding features and adops
Scaling big-box + online — 420 stores, $38.7B
H‑E‑B stars: 420 stores and estimated 2024 sales ~$38.7B, scaling big‑box and online (US online grocery ~10% 2023–24). >$1bn invested in fulfillment since 2020 to cement last‑mile; high reinvestment keeps margins under pressure. Organics/fresh and prepared foods (US organics ~$62B 2024) drive premium margins but require cold chain and sourcing capex.
| Metric | Value (2024) |
|---|---|
| Stores | 420 |
| Sales | $38.7B |
| Online penetration | ~10% |
| Fulfillment capex since 2020 | >$1B |
| US organics | $62B |
What is included in the product
Detailed Word Document
BCG analysis of H‑E‑B: identifies Stars, Cash Cows, Question Marks, Dogs with strategic recommendations to invest, hold, or divest.
Customizable Excel Spreadsheet
One-page H-E-B BCG Matrix that simplifies portfolio choices—export-ready for C-level decks and A4 print.
Cash Cows
Core Private Label (H‑E‑B, Hill Country Fare, Central Market)
Core private label (H‑E‑B, Hill Country Fare, Central Market) sits in a mature category with dominant share, driving high velocity and a strong margin mix while requiring low promotional support. In 2024 H‑E‑B’s private brands leverage a network of more than 400 stores across Texas and Mexico to fund innovation and portfolio growth. Maintain quality, preserve price gaps, and secure supply — milk it.
Mature Texas Supermarket Footprint
Mature Texas supermarket footprint with over 400 stores and roughly 153,000 employees (2024) generates dependable cash in legacy markets. Growth is low, but tight supply-chain efficiency and extensive real estate control keep gross margins resilient. Light reinvestment—store refreshes, energy upgrades—delivers high ROI. Optimizing labor scheduling, store flow, and energy use can further squeeze incremental yield.
Pharmacy Scripts & Immunizations
Pharmacy scripts and immunizations drive recurring demand and loyal in-store traffic across H-E-B’s more than 430 stores, with the pharmacy network serving millions of prescriptions annually and delivering high cross-shop conversion into grocery and CPG sales. The pharmacy market shows modest growth (roughly 2–3% annually), yet H-E-B’s share is stout, making this a stable cash generator requiring limited incremental capital. Priority remains on adherence programs and vaccination throughput to sustain utilization and margin.
Fuel Stations
H-E-B fuel stations are classic cash cows: low category growth but steady volume that drives in-store basket lift and predictable cash flow; NACS reports fuel represented about 68% of convenience-store dollar sales (2023), while typical retail fuel gross margin runs roughly $0.10–$0.25 per gallon (industry/EIA ranges). Minimal marketing is needed—use stations for traffic and cash, not heroics, while tightening ops and applying dynamic pricing to protect margin.
- Role: traffic driver, steady cash
- Marketing: minimal
- Ops: tighten efficiency
- Pricing: dynamic to defend $0.10–$0.25/gal margin
Distribution & Owned Real Estate Advantage
H-E-B leverages scale in warehousing and predominantly owned sites (420+ stores, 150,000+ employees) to lower unit costs in a mature Texas market where savings are highly bankable; throughput upgrades and automation raised distribution efficiency in 2024, improving cash conversion and inventory turns. Continue funding automation projects with clear ROI thresholds.
- Scale: 420+ stores; 150,000+ employees
- Market: mature, steady demand—cost savings translate to cash
- Operations: upgrades↑ throughput, better cash conversion
- Strategy: invest in automation where ROI is proven
Grocery cash engines: private labels, pharmacies, fuel — protect margins, automate smart
H-E-B cash cows—private labels, mature Texas stores, pharmacy network, and fuel—deliver steady free cash flow from 420–430 stores and ~153,000 employees (2024). Private brands and pharmacies show low growth (2–3%) but high margin/rate of return; fuel margin about $0.10–$0.25/gal. Focus: preserve price gaps, tighten ops, invest selectively in ROI-positive automation.
| Asset | 2024 Metric | Role |
|---|---|---|
| Stores | 420–430 | Core cash |
| Employees | ~153,000 | Scale |
| Pharmacy | 2–3% growth | Recurring cash |
| Fuel | $0.10–$0.25/gal | Traffic/cash |
Full Transparency, Always
H-E-B Grocery Company BCG Matrix
The file you're previewing is the final H‑E‑B Grocery Company BCG Matrix you'll receive after purchase. No watermarks or demo content—just a fully formatted, ready-to-use strategic report tailored to H‑E‑B's portfolio. Once bought, the exact same document is delivered to your inbox for immediate editing, printing, or presenting to stakeholders. Clean, professional, and analysis-ready—no surprises.











