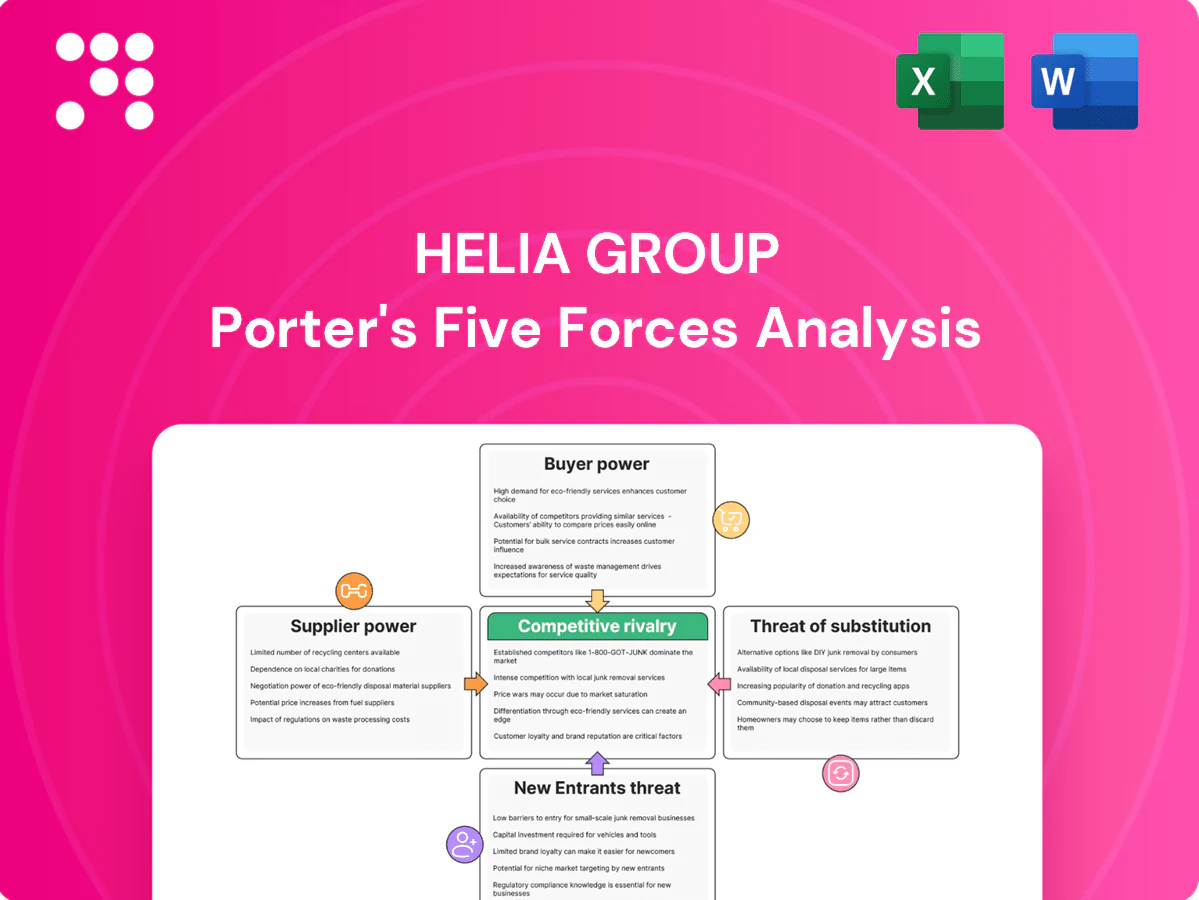
Helia Group Porter's Five Forces Analysis

Go Beyond the Preview—Access the Full Strategic Report
Helia Group’s Porter's Five Forces snapshot highlights concentrated buyer power, regulatory pressure, and competitive intensity shaping its insurance and fintech positioning. The analysis outlines supplier influence, substitute risks, and barriers to entry that impact margin resilience. This brief teases strategic implications. Unlock the full Porter's Five Forces Analysis to explore Helia Group’s competitive dynamics and market pressures in detail.
Suppliers Bargaining Power

Concentrated reinsurance capacity
Helia relies on a limited pool of global reinsurers for risk transfer and capital relief, concentrating bargaining power with a few counterparties that can demand tighter pricing and terms in hard markets. Multi-year treaties reduce short-term volatility but often include stringent collateral and claims clauses that lock in exposure. A squeeze in reinsurance capacity typically passes through to higher LMI premiums or stricter underwriting.
Specialized data and valuation vendors
Three major credit bureaus in Australia (Equifax, Experian, Illion) and dominant property-valuation providers such as CoreLogic, plus catastrophe modelers RMS and AIR Worldwide, create sticky supply for Helia. Deep API integration and data mapping produce meaningful switching costs, giving vendors moderate bargaining power. Service outages or model updates can materially affect pricing and loss selection for single cohorts. Volume-based contracting partially mitigates unit pricing pressure.

Human capital scarcity
Actuaries (~3,800 members in Australia in 2024), credit risk modelers and mortgage-underwriting specialists remain scarce, boosting supplier power for Helia. Wage pressure — Wage Price Index +3.9% in 2024 — and poaching by banks and fintechs elevate costs and churn. Knowledge concentration creates key-person risk for pricing and capital models. Upskilling and automation mitigate but cannot fully replace specialist expertise.

Technology platforms and core systems
Core policy admin, pricing engines and LOS integrations are mission-critical for Helia; implementations typically take 12–36 months and create vendor lock-in that limits negotiation. Heavy customizations increase switching costs and recurring upgrade fees, while 2024 cloud IaaS shares (AWS 33%, Azure 23%, GCP 11%) consolidate bargaining power with a few providers.
- Vendor lock-in: long cycles 12–36 months
- Switching costs: high with customizations
- Cloud leverage: AWS 33% Azure 23% GCP 11% (2024)
Capital providers and ratings agencies
Equity investors and ratings agencies shape Helia Group’s capital cost and buffer expectations; downgrades or demands for higher loss-absorbing capital can force repricing of risk or constrain growth, giving capital providers indirect bargaining power over strategy. Transparent performance and consistently strong loss outcomes reduce pressure from markets and agencies and help preserve financing flexibility.
- Investor influence: impacts cost of equity and capital strategy
- Ratings actions: can trigger higher capital requirements or repricing
- Indirect power: financial supply affects growth pacing
- Mitigants: transparency and low loss ratios temper pressures
Concentrated supplier power: reinsurers ~70%, 3 bureaus, scarce actuaries, cloud lock-in
Helia faces concentrated supplier power: global reinsurers (top-5 ~70% market share) can tighten pricing and terms; three credit bureaus and dominant valuation/model vendors create high switching costs; scarce actuaries (~3,800 AU in 2024) and wage pressure (Wage Price Index +3.9% 2024) raise talent costs; cloud/vendor lock-in (AWS 33% Azure 23% GCP 11% 2024) limits negotiation.
| Supplier | Metric | 2024 |
|---|---|---|
| Reinsurers | Top-5 share | ~70% |
| Credit bureaus | Providers | 3 |
| Actuaries (AU) | Members | ~3,800 |
| Wage pressure | Wage Price Index | +3.9% |
| Cloud | Market share AWS/Azure/GCP | 33%/23%/11% |
What is included in the product
 Detailed Word Document
Tailored Porter's Five Forces analysis for Helia Group, uncovering competitive intensity, buyer/supplier bargaining power, threat of substitutes and new entrants, and identifying disruptive forces that could erode market share.

 Customizable Excel Spreadsheet
A clear, one-sheet Porter's Five Forces summary for Helia Group—visual spider chart and editable pressure levels let you quickly assess competitive risks and drop straight into pitch decks or dashboards.
Customers Bargaining Power

Highly concentrated lender base
Australia’s mortgage market is highly concentrated — the big four banks account for around 70% of outstanding housing credit (APRA 2024), with large non‑banks adding another ~10–15%, enabling aggressive tendering and volume‑linked pricing. Lenders can demand discounts and service concessions from insurers; buyers can dual‑source LMI or shift flows quickly, giving lenders strong pricing and service negotiation power.
Ability to self-insure or use captives
Larger lenders controlling about 75% of Australia’s A$2.6 trillion mortgage stock in 2024 can elect to self-insure higher-LVR bands or use captives rather than buy LMI, creating a credible alternative that strengthens their bargaining position. Insurers like Helia must therefore prove superior economics and capital efficiency to win mandates. This constrains pricing discipline and limits premium increases.

Regulatory and product standard demands
Lenders enforce strict SLAs, eligibility and APRA-aligned compliance tied to internal risk policies, increasing underwriting scrutiny across a residential mortgage stock of about A$2.9 trillion in 2024. Custom terms and bespoke data reporting materially raise service burden and operational costs. Deviations can trigger financial penalties or reallocation of flow, so buyers use compliance performance as a key negotiation lever.

Sensitivity to cycle and volumes
When housing credit growth slows, lenders press harder on price and terms, forcing Helia to defend margins and accept tighter conditions to retain flow; in up-cycles competing insurers and banks use flow incentives and discounting to capture market share. Volume volatility moves bargaining leverage quarter-to-quarter, increasing earnings variability and underwriting pressure. Long-term master agreements reduce turnover but do not eliminate pricing and terms pressure.
- Sensitivity: lenders tighten pricing in slow credit periods
- Up-cycle: discounts and flow incentives rise
- Volatility: quarterly swings shift bargaining power
- Agreements: master contracts soften but do not remove pressure
Switching and dual-sourcing ease
Established integration standards let lenders maintain multiple LMI panels, and tender-based allocations enable dynamic rebalancing, reducing lock-in and raising buyer power; insurers like Helia must therefore compete continuously on loss performance, turnaround times and analytics to retain placement.
- Multiple-panel adoption raises buyer leverage
- Tendering enables frequent reweighting
- Performance, speed, analytics drive insurer selection
Major lenders control ~75% of A$2.9T mortgages, constraining LMI pricing power
Concentrated lending (big four ~70% of housing credit; APRA 2024) and large non‑banks (~10–15%) give lenders strong negotiation leverage over LMI pricing and service. Major lenders (controlling ~75% of A$2.9T mortgage stock in 2024) can self-insure or use captives, constraining Helia’s pricing power. Tendering, multi‑panel sourcing and SLAs make placement contingent on loss performance, speed and analytics.
| Metric | Value (2024) |
|---|---|
| Big four share | ~70% (APRA) |
| Non-bank share | ~10–15% |
| Mortgage stock | A$2.9T |
| Lenders controlling flow | ~75% |
Preview the Actual Deliverable
Helia Group Porter's Five Forces Analysis
This preview shows the exact Helia Group Porter’s Five Forces analysis you'll receive upon purchase—fully formatted, professionally written, and ready for use. It covers competitive rivalry, supplier and buyer power, threat of substitutes, and barriers to entry. No placeholders or samples—instant download of this identical file after payment.

Go Beyond the Preview—Access the Full Strategic Report
Helia Group’s Porter's Five Forces snapshot highlights concentrated buyer power, regulatory pressure, and competitive intensity shaping its insurance and fintech positioning. The analysis outlines supplier influence, substitute risks, and barriers to entry that impact margin resilience. This brief teases strategic implications. Unlock the full Porter's Five Forces Analysis to explore Helia Group’s competitive dynamics and market pressures in detail.
Suppliers Bargaining Power
Concentrated reinsurance capacity
Helia relies on a limited pool of global reinsurers for risk transfer and capital relief, concentrating bargaining power with a few counterparties that can demand tighter pricing and terms in hard markets. Multi-year treaties reduce short-term volatility but often include stringent collateral and claims clauses that lock in exposure. A squeeze in reinsurance capacity typically passes through to higher LMI premiums or stricter underwriting.
Specialized data and valuation vendors
Three major credit bureaus in Australia (Equifax, Experian, Illion) and dominant property-valuation providers such as CoreLogic, plus catastrophe modelers RMS and AIR Worldwide, create sticky supply for Helia. Deep API integration and data mapping produce meaningful switching costs, giving vendors moderate bargaining power. Service outages or model updates can materially affect pricing and loss selection for single cohorts. Volume-based contracting partially mitigates unit pricing pressure.
Human capital scarcity
Actuaries (~3,800 members in Australia in 2024), credit risk modelers and mortgage-underwriting specialists remain scarce, boosting supplier power for Helia. Wage pressure — Wage Price Index +3.9% in 2024 — and poaching by banks and fintechs elevate costs and churn. Knowledge concentration creates key-person risk for pricing and capital models. Upskilling and automation mitigate but cannot fully replace specialist expertise.
Technology platforms and core systems
Core policy admin, pricing engines and LOS integrations are mission-critical for Helia; implementations typically take 12–36 months and create vendor lock-in that limits negotiation. Heavy customizations increase switching costs and recurring upgrade fees, while 2024 cloud IaaS shares (AWS 33%, Azure 23%, GCP 11%) consolidate bargaining power with a few providers.
- Vendor lock-in: long cycles 12–36 months
- Switching costs: high with customizations
- Cloud leverage: AWS 33% Azure 23% GCP 11% (2024)
Capital providers and ratings agencies
Equity investors and ratings agencies shape Helia Group’s capital cost and buffer expectations; downgrades or demands for higher loss-absorbing capital can force repricing of risk or constrain growth, giving capital providers indirect bargaining power over strategy. Transparent performance and consistently strong loss outcomes reduce pressure from markets and agencies and help preserve financing flexibility.
- Investor influence: impacts cost of equity and capital strategy
- Ratings actions: can trigger higher capital requirements or repricing
- Indirect power: financial supply affects growth pacing
- Mitigants: transparency and low loss ratios temper pressures
Concentrated supplier power: reinsurers ~70%, 3 bureaus, scarce actuaries, cloud lock-in
Helia faces concentrated supplier power: global reinsurers (top-5 ~70% market share) can tighten pricing and terms; three credit bureaus and dominant valuation/model vendors create high switching costs; scarce actuaries (~3,800 AU in 2024) and wage pressure (Wage Price Index +3.9% 2024) raise talent costs; cloud/vendor lock-in (AWS 33% Azure 23% GCP 11% 2024) limits negotiation.
| Supplier | Metric | 2024 |
|---|---|---|
| Reinsurers | Top-5 share | ~70% |
| Credit bureaus | Providers | 3 |
| Actuaries (AU) | Members | ~3,800 |
| Wage pressure | Wage Price Index | +3.9% |
| Cloud | Market share AWS/Azure/GCP | 33%/23%/11% |
What is included in the product
Detailed Word Document
Tailored Porter's Five Forces analysis for Helia Group, uncovering competitive intensity, buyer/supplier bargaining power, threat of substitutes and new entrants, and identifying disruptive forces that could erode market share.
Customizable Excel Spreadsheet
A clear, one-sheet Porter's Five Forces summary for Helia Group—visual spider chart and editable pressure levels let you quickly assess competitive risks and drop straight into pitch decks or dashboards.
Customers Bargaining Power
Highly concentrated lender base
Australia’s mortgage market is highly concentrated — the big four banks account for around 70% of outstanding housing credit (APRA 2024), with large non‑banks adding another ~10–15%, enabling aggressive tendering and volume‑linked pricing. Lenders can demand discounts and service concessions from insurers; buyers can dual‑source LMI or shift flows quickly, giving lenders strong pricing and service negotiation power.
Ability to self-insure or use captives
Larger lenders controlling about 75% of Australia’s A$2.6 trillion mortgage stock in 2024 can elect to self-insure higher-LVR bands or use captives rather than buy LMI, creating a credible alternative that strengthens their bargaining position. Insurers like Helia must therefore prove superior economics and capital efficiency to win mandates. This constrains pricing discipline and limits premium increases.
Regulatory and product standard demands
Lenders enforce strict SLAs, eligibility and APRA-aligned compliance tied to internal risk policies, increasing underwriting scrutiny across a residential mortgage stock of about A$2.9 trillion in 2024. Custom terms and bespoke data reporting materially raise service burden and operational costs. Deviations can trigger financial penalties or reallocation of flow, so buyers use compliance performance as a key negotiation lever.
Sensitivity to cycle and volumes
When housing credit growth slows, lenders press harder on price and terms, forcing Helia to defend margins and accept tighter conditions to retain flow; in up-cycles competing insurers and banks use flow incentives and discounting to capture market share. Volume volatility moves bargaining leverage quarter-to-quarter, increasing earnings variability and underwriting pressure. Long-term master agreements reduce turnover but do not eliminate pricing and terms pressure.
- Sensitivity: lenders tighten pricing in slow credit periods
- Up-cycle: discounts and flow incentives rise
- Volatility: quarterly swings shift bargaining power
- Agreements: master contracts soften but do not remove pressure
Switching and dual-sourcing ease
Established integration standards let lenders maintain multiple LMI panels, and tender-based allocations enable dynamic rebalancing, reducing lock-in and raising buyer power; insurers like Helia must therefore compete continuously on loss performance, turnaround times and analytics to retain placement.
- Multiple-panel adoption raises buyer leverage
- Tendering enables frequent reweighting
- Performance, speed, analytics drive insurer selection
Major lenders control ~75% of A$2.9T mortgages, constraining LMI pricing power
Concentrated lending (big four ~70% of housing credit; APRA 2024) and large non‑banks (~10–15%) give lenders strong negotiation leverage over LMI pricing and service. Major lenders (controlling ~75% of A$2.9T mortgage stock in 2024) can self-insure or use captives, constraining Helia’s pricing power. Tendering, multi‑panel sourcing and SLAs make placement contingent on loss performance, speed and analytics.
| Metric | Value (2024) |
|---|---|
| Big four share | ~70% (APRA) |
| Non-bank share | ~10–15% |
| Mortgage stock | A$2.9T |
| Lenders controlling flow | ~75% |
Preview the Actual Deliverable
Helia Group Porter's Five Forces Analysis
This preview shows the exact Helia Group Porter’s Five Forces analysis you'll receive upon purchase—fully formatted, professionally written, and ready for use. It covers competitive rivalry, supplier and buyer power, threat of substitutes, and barriers to entry. No placeholders or samples—instant download of this identical file after payment.
Description
Go Beyond the Preview—Access the Full Strategic Report
Helia Group’s Porter's Five Forces snapshot highlights concentrated buyer power, regulatory pressure, and competitive intensity shaping its insurance and fintech positioning. The analysis outlines supplier influence, substitute risks, and barriers to entry that impact margin resilience. This brief teases strategic implications. Unlock the full Porter's Five Forces Analysis to explore Helia Group’s competitive dynamics and market pressures in detail.
Suppliers Bargaining Power
Concentrated reinsurance capacity
Helia relies on a limited pool of global reinsurers for risk transfer and capital relief, concentrating bargaining power with a few counterparties that can demand tighter pricing and terms in hard markets. Multi-year treaties reduce short-term volatility but often include stringent collateral and claims clauses that lock in exposure. A squeeze in reinsurance capacity typically passes through to higher LMI premiums or stricter underwriting.
Specialized data and valuation vendors
Three major credit bureaus in Australia (Equifax, Experian, Illion) and dominant property-valuation providers such as CoreLogic, plus catastrophe modelers RMS and AIR Worldwide, create sticky supply for Helia. Deep API integration and data mapping produce meaningful switching costs, giving vendors moderate bargaining power. Service outages or model updates can materially affect pricing and loss selection for single cohorts. Volume-based contracting partially mitigates unit pricing pressure.
Human capital scarcity
Actuaries (~3,800 members in Australia in 2024), credit risk modelers and mortgage-underwriting specialists remain scarce, boosting supplier power for Helia. Wage pressure — Wage Price Index +3.9% in 2024 — and poaching by banks and fintechs elevate costs and churn. Knowledge concentration creates key-person risk for pricing and capital models. Upskilling and automation mitigate but cannot fully replace specialist expertise.
Technology platforms and core systems
Core policy admin, pricing engines and LOS integrations are mission-critical for Helia; implementations typically take 12–36 months and create vendor lock-in that limits negotiation. Heavy customizations increase switching costs and recurring upgrade fees, while 2024 cloud IaaS shares (AWS 33%, Azure 23%, GCP 11%) consolidate bargaining power with a few providers.
- Vendor lock-in: long cycles 12–36 months
- Switching costs: high with customizations
- Cloud leverage: AWS 33% Azure 23% GCP 11% (2024)
Capital providers and ratings agencies
Equity investors and ratings agencies shape Helia Group’s capital cost and buffer expectations; downgrades or demands for higher loss-absorbing capital can force repricing of risk or constrain growth, giving capital providers indirect bargaining power over strategy. Transparent performance and consistently strong loss outcomes reduce pressure from markets and agencies and help preserve financing flexibility.
- Investor influence: impacts cost of equity and capital strategy
- Ratings actions: can trigger higher capital requirements or repricing
- Indirect power: financial supply affects growth pacing
- Mitigants: transparency and low loss ratios temper pressures
Concentrated supplier power: reinsurers ~70%, 3 bureaus, scarce actuaries, cloud lock-in
Helia faces concentrated supplier power: global reinsurers (top-5 ~70% market share) can tighten pricing and terms; three credit bureaus and dominant valuation/model vendors create high switching costs; scarce actuaries (~3,800 AU in 2024) and wage pressure (Wage Price Index +3.9% 2024) raise talent costs; cloud/vendor lock-in (AWS 33% Azure 23% GCP 11% 2024) limits negotiation.
| Supplier | Metric | 2024 |
|---|---|---|
| Reinsurers | Top-5 share | ~70% |
| Credit bureaus | Providers | 3 |
| Actuaries (AU) | Members | ~3,800 |
| Wage pressure | Wage Price Index | +3.9% |
| Cloud | Market share AWS/Azure/GCP | 33%/23%/11% |
What is included in the product
Detailed Word Document
Tailored Porter's Five Forces analysis for Helia Group, uncovering competitive intensity, buyer/supplier bargaining power, threat of substitutes and new entrants, and identifying disruptive forces that could erode market share.
Customizable Excel Spreadsheet
A clear, one-sheet Porter's Five Forces summary for Helia Group—visual spider chart and editable pressure levels let you quickly assess competitive risks and drop straight into pitch decks or dashboards.
Customers Bargaining Power
Highly concentrated lender base
Australia’s mortgage market is highly concentrated — the big four banks account for around 70% of outstanding housing credit (APRA 2024), with large non‑banks adding another ~10–15%, enabling aggressive tendering and volume‑linked pricing. Lenders can demand discounts and service concessions from insurers; buyers can dual‑source LMI or shift flows quickly, giving lenders strong pricing and service negotiation power.
Ability to self-insure or use captives
Larger lenders controlling about 75% of Australia’s A$2.6 trillion mortgage stock in 2024 can elect to self-insure higher-LVR bands or use captives rather than buy LMI, creating a credible alternative that strengthens their bargaining position. Insurers like Helia must therefore prove superior economics and capital efficiency to win mandates. This constrains pricing discipline and limits premium increases.
Regulatory and product standard demands
Lenders enforce strict SLAs, eligibility and APRA-aligned compliance tied to internal risk policies, increasing underwriting scrutiny across a residential mortgage stock of about A$2.9 trillion in 2024. Custom terms and bespoke data reporting materially raise service burden and operational costs. Deviations can trigger financial penalties or reallocation of flow, so buyers use compliance performance as a key negotiation lever.
Sensitivity to cycle and volumes
When housing credit growth slows, lenders press harder on price and terms, forcing Helia to defend margins and accept tighter conditions to retain flow; in up-cycles competing insurers and banks use flow incentives and discounting to capture market share. Volume volatility moves bargaining leverage quarter-to-quarter, increasing earnings variability and underwriting pressure. Long-term master agreements reduce turnover but do not eliminate pricing and terms pressure.
- Sensitivity: lenders tighten pricing in slow credit periods
- Up-cycle: discounts and flow incentives rise
- Volatility: quarterly swings shift bargaining power
- Agreements: master contracts soften but do not remove pressure
Switching and dual-sourcing ease
Established integration standards let lenders maintain multiple LMI panels, and tender-based allocations enable dynamic rebalancing, reducing lock-in and raising buyer power; insurers like Helia must therefore compete continuously on loss performance, turnaround times and analytics to retain placement.
- Multiple-panel adoption raises buyer leverage
- Tendering enables frequent reweighting
- Performance, speed, analytics drive insurer selection
Major lenders control ~75% of A$2.9T mortgages, constraining LMI pricing power
Concentrated lending (big four ~70% of housing credit; APRA 2024) and large non‑banks (~10–15%) give lenders strong negotiation leverage over LMI pricing and service. Major lenders (controlling ~75% of A$2.9T mortgage stock in 2024) can self-insure or use captives, constraining Helia’s pricing power. Tendering, multi‑panel sourcing and SLAs make placement contingent on loss performance, speed and analytics.
| Metric | Value (2024) |
|---|---|
| Big four share | ~70% (APRA) |
| Non-bank share | ~10–15% |
| Mortgage stock | A$2.9T |
| Lenders controlling flow | ~75% |
Preview the Actual Deliverable
Helia Group Porter's Five Forces Analysis
This preview shows the exact Helia Group Porter’s Five Forces analysis you'll receive upon purchase—fully formatted, professionally written, and ready for use. It covers competitive rivalry, supplier and buyer power, threat of substitutes, and barriers to entry. No placeholders or samples—instant download of this identical file after payment.











