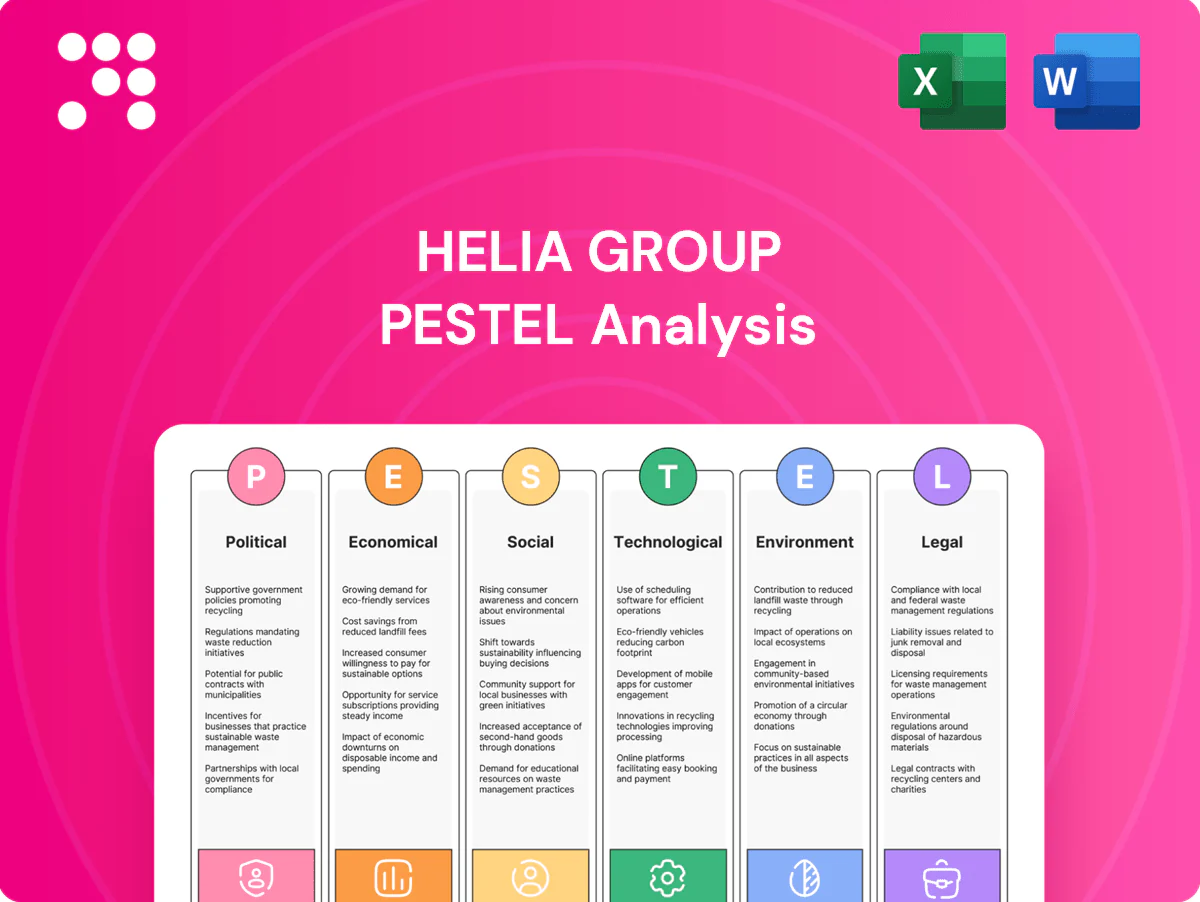
Helia Group PESTLE Analysis

Skip the Research. Get the Strategy.
Gain strategic clarity with our PESTLE Analysis of Helia Group—concise, current, and focused on the political, economic, social, technological, legal, and environmental forces shaping its future. Ideal for investors and strategists; purchase the full report for the complete, actionable breakdown.
Political factors

Housing affordability agenda
Australian federal and state focus on home ownership, including the 2024–25 First Home Guarantee with 35,000 places, boosts high‑LVR lending and elevates low‑deposit (LMI) uptake; first‑home buyers comprised about 38% of new owner‑occupier lending in 2024, amplifying originations for insurers. Cuts or reversals to grants/shared‑equity funding would materially reduce new originations, so Helia must align products and partnerships with shifting public priorities to stay a preferred partner.
Macroprudential settings
APRA macroprudential settings — including investor lending limits, prescribed serviceability buffers and constraints on high‑DTI lending — directly alter Helia’s risk mix and volumes; tighter rules shrink LMI penetration but lift credit quality. Looser settings can boost originations while increasing tail risk against Australia’s high household debt ratio (household debt to disposable income ~188% in 2023). Continuous regulator engagement underpins capital planning and pricing.

Government guarantee programs
The Commonwealth Home Guarantee Scheme (First Home, Family Home and Regional programs), administered via NHFIC, can substitute for or complement LMI for eligible cohorts, redirecting volumes away from traditional LMI customers. Expansion or tightening of places and eligibility shifts LMI demand to other borrower segments; policy design—caps and income or property eligibility—drives the competitive impact. Helia can partner with lenders or tailor products to fill coverage gaps and retain market share.

Regional planning and infrastructure
Regional planning and infrastructure shape housing demand along corridors; 2024 federal and state infrastructure pipelines have already redirected development and lifted origination volumes in prioritised growth areas while concentrating portfolio risk. Delays or cancellations have strained local markets and amplified price volatility, pressuring mortgage insurers. Helia’s geographic risk selection should mirror confirmed political project pipelines to manage concentration and origination exposure.
- Align underwriting to confirmed 2024 project pipelines
- Monitor corridor-driven origination shifts
- Stress-test portfolios for cancellation scenarios
Geopolitical and fiscal posture
Geopolitical and fiscal posture shapes housing demand and bank risk appetite: expansionary budgets and strong migration lift loan growth and LMI demand — Australia reported net overseas migration ~504,000 in 2023–24 with a 2024–25 planning level of 195,000; shifts to austerity or tighter borders can cool volumes, so Helia should scenario‑plan around the 2025 federal election and budget settings.
- Migration: net O/M ~504,000 (2023–24); planning level 195,000 (2024–25)
- Drivers: expansionary fiscal policy => higher loan/LMI demand
- Risks: austerity or border tightening => lower volumes; scenario‑plan
Policy support and high LVRs lift first-home buying; debt and migration heighten concentration risk
Policy support (First Home Guarantee 35,000 places 2024–25) and high‑LVR programs raised low‑deposit lending (first‑home buyers ~38% of new owner‑occupier lending in 2024). APRA rules and high household debt (~188% in 2023) constrain volumes; NHFIC schemes, infrastructure pipelines and migration (~504,000 in 2023–24; planning 195,000 in 2024–25) drive originations and concentration risk.
| Metric | Value |
|---|---|
| First Home Guarantee places | 35,000 (2024–25) |
| First‑home share | ~38% (2024) |
| Household debt | ~188% (2023) |
| Net migration | 504,000 (2023–24); planning 195,000 (2024–25) |
What is included in the product
 Detailed Word Document
Provides a concise PESTLE assessment of how Political, Economic, Social, Technological, Environmental and Legal forces uniquely affect Helia Group, with data-backed trends and region-specific regulatory context. Designed for executives and investors to identify risks, opportunities and support forward-looking strategy and scenario planning.

 Customizable Excel Spreadsheet
A concise, visually segmented PESTLE summary of Helia Group that reduces prep time and clarifies external risks for meetings. Easily dropped into slides or shared for quick team alignment.
Economic factors

Interest rate cycle
RBA cash rate at 4.35% (mid-2025) directly reduces borrower capacity, increasing arrears and prepayments as variable mortgages reprice. Rising rates compress serviceability and raise default probabilities, elevating LMI claim frequency and severity. Rate easing revives demand and improves cure rates. Helia must price products and hold capital buffers that reflect path uncertainty around current rates.
House price dynamics
House price appreciation reduces loss‑given‑default by increasing equity buffers, while falls amplify claim severity—CoreLogic showed national values rose ~3% year‑on‑year to mid‑2024 but softened into 2025 with small declines in several capital cities. Supply constraints (underbuilding relative to population growth) have supported prices in tight markets. Sharp downturns in Sydney or Melbourne could raise concentration risk in Helia’s book. Helia’s LVR, postcode and property‑type limits cap cyclic exposure.

Employment and income trends
Unemployment at 4.0% (June 2025) and annual wage growth ≈3.7% support borrower resilience, lowering arrears and claim frequency. Strong labour markets historically cut 30–50% of default risk in prime cohorts, reducing claims for lenders like Helia. Localised shocks in construction and hospitality can spike regional stress; portfolio monitoring should map exposures to labour-market heatmaps for early intervention.

Credit growth and competition
Bank appetite, broker channels and fintech entrants (eg Athena, Tic:Toc) materially shape origination flows for Helia (ASX: HLI); brokers account for around 60% of Australian home lending, keeping volume opportunities open while intensifying competition. Aggressive pricing by banks and nonbanks can boost volumes but erodes insurance margins; slower credit growth compresses premium intake and scale benefits. Helia must balance market share with underwriting discipline to protect loss ratios and ROE.
- broker-share: ~60%
- fintech-competition: Athena, Tic:Toc
- trade-off: volume vs margin
- priority: underwriting discipline
Inflation and construction costs
High inflation (Australia CPI ~3.9% y/y in 2024) lifts living costs and mortgage stress, increasing default risk for Helia; elevated build costs (estimated +5–8% in 2024) constrain new supply and reduce valuations for off‑the‑plan borrowers. Insurance operating expenses and reinsurance pricing rose sharply (reinsurance ~+15% in 2024), making expense control and dynamic pricing essential.
- Inflation: 3.9% y/y (2024)
- Build costs: +5–8% (2024)
- Reinsurance: ~+15% (2024)
- Priority: expense control, dynamic pricing
Policy support and high LVRs lift first-home buying; debt and migration heighten concentration risk
RBA cash rate 4.35% (mid‑2025) tightens serviceability and raises LMI claim risk; house values +3% y/y to mid‑2024 but softened into 2025. Unemployment 4.0% (June 2025) and wage growth ~3.7% support resilience. Broker share ~60% drives volumes; inflation 3.9% (2024) and reinsurance +15% (2024) pressure costs.
| Metric | Value |
|---|---|
| RBA cash rate | 4.35% (mid‑2025) |
| House prices | +3% y/y to mid‑2024 |
| Unemployment | 4.0% (Jun‑2025) |
| Inflation | 3.9% (2024) |
| Reinsurance | +15% (2024) |
| Broker share | ~60% |
Same Document Delivered
Helia Group PESTLE Analysis
The preview shown here is the exact document you’ll receive after purchase—fully formatted and ready to use. This Helia Group PESTLE Analysis includes political, economic, social, technological, legal and environmental factors, structured for immediate application. No placeholders or teasers: the content, layout and sourcing visible here are what you’ll download after payment.

Skip the Research. Get the Strategy.
Gain strategic clarity with our PESTLE Analysis of Helia Group—concise, current, and focused on the political, economic, social, technological, legal, and environmental forces shaping its future. Ideal for investors and strategists; purchase the full report for the complete, actionable breakdown.
Political factors
Housing affordability agenda
Australian federal and state focus on home ownership, including the 2024–25 First Home Guarantee with 35,000 places, boosts high‑LVR lending and elevates low‑deposit (LMI) uptake; first‑home buyers comprised about 38% of new owner‑occupier lending in 2024, amplifying originations for insurers. Cuts or reversals to grants/shared‑equity funding would materially reduce new originations, so Helia must align products and partnerships with shifting public priorities to stay a preferred partner.
Macroprudential settings
APRA macroprudential settings — including investor lending limits, prescribed serviceability buffers and constraints on high‑DTI lending — directly alter Helia’s risk mix and volumes; tighter rules shrink LMI penetration but lift credit quality. Looser settings can boost originations while increasing tail risk against Australia’s high household debt ratio (household debt to disposable income ~188% in 2023). Continuous regulator engagement underpins capital planning and pricing.
Government guarantee programs
The Commonwealth Home Guarantee Scheme (First Home, Family Home and Regional programs), administered via NHFIC, can substitute for or complement LMI for eligible cohorts, redirecting volumes away from traditional LMI customers. Expansion or tightening of places and eligibility shifts LMI demand to other borrower segments; policy design—caps and income or property eligibility—drives the competitive impact. Helia can partner with lenders or tailor products to fill coverage gaps and retain market share.
Regional planning and infrastructure
Regional planning and infrastructure shape housing demand along corridors; 2024 federal and state infrastructure pipelines have already redirected development and lifted origination volumes in prioritised growth areas while concentrating portfolio risk. Delays or cancellations have strained local markets and amplified price volatility, pressuring mortgage insurers. Helia’s geographic risk selection should mirror confirmed political project pipelines to manage concentration and origination exposure.
- Align underwriting to confirmed 2024 project pipelines
- Monitor corridor-driven origination shifts
- Stress-test portfolios for cancellation scenarios
Geopolitical and fiscal posture
Geopolitical and fiscal posture shapes housing demand and bank risk appetite: expansionary budgets and strong migration lift loan growth and LMI demand — Australia reported net overseas migration ~504,000 in 2023–24 with a 2024–25 planning level of 195,000; shifts to austerity or tighter borders can cool volumes, so Helia should scenario‑plan around the 2025 federal election and budget settings.
- Migration: net O/M ~504,000 (2023–24); planning level 195,000 (2024–25)
- Drivers: expansionary fiscal policy => higher loan/LMI demand
- Risks: austerity or border tightening => lower volumes; scenario‑plan
Policy support and high LVRs lift first-home buying; debt and migration heighten concentration risk
Policy support (First Home Guarantee 35,000 places 2024–25) and high‑LVR programs raised low‑deposit lending (first‑home buyers ~38% of new owner‑occupier lending in 2024). APRA rules and high household debt (~188% in 2023) constrain volumes; NHFIC schemes, infrastructure pipelines and migration (~504,000 in 2023–24; planning 195,000 in 2024–25) drive originations and concentration risk.
| Metric | Value |
|---|---|
| First Home Guarantee places | 35,000 (2024–25) |
| First‑home share | ~38% (2024) |
| Household debt | ~188% (2023) |
| Net migration | 504,000 (2023–24); planning 195,000 (2024–25) |
What is included in the product
Detailed Word Document
Provides a concise PESTLE assessment of how Political, Economic, Social, Technological, Environmental and Legal forces uniquely affect Helia Group, with data-backed trends and region-specific regulatory context. Designed for executives and investors to identify risks, opportunities and support forward-looking strategy and scenario planning.
Customizable Excel Spreadsheet
A concise, visually segmented PESTLE summary of Helia Group that reduces prep time and clarifies external risks for meetings. Easily dropped into slides or shared for quick team alignment.
Economic factors
Interest rate cycle
RBA cash rate at 4.35% (mid-2025) directly reduces borrower capacity, increasing arrears and prepayments as variable mortgages reprice. Rising rates compress serviceability and raise default probabilities, elevating LMI claim frequency and severity. Rate easing revives demand and improves cure rates. Helia must price products and hold capital buffers that reflect path uncertainty around current rates.
House price dynamics
House price appreciation reduces loss‑given‑default by increasing equity buffers, while falls amplify claim severity—CoreLogic showed national values rose ~3% year‑on‑year to mid‑2024 but softened into 2025 with small declines in several capital cities. Supply constraints (underbuilding relative to population growth) have supported prices in tight markets. Sharp downturns in Sydney or Melbourne could raise concentration risk in Helia’s book. Helia’s LVR, postcode and property‑type limits cap cyclic exposure.
Employment and income trends
Unemployment at 4.0% (June 2025) and annual wage growth ≈3.7% support borrower resilience, lowering arrears and claim frequency. Strong labour markets historically cut 30–50% of default risk in prime cohorts, reducing claims for lenders like Helia. Localised shocks in construction and hospitality can spike regional stress; portfolio monitoring should map exposures to labour-market heatmaps for early intervention.
Credit growth and competition
Bank appetite, broker channels and fintech entrants (eg Athena, Tic:Toc) materially shape origination flows for Helia (ASX: HLI); brokers account for around 60% of Australian home lending, keeping volume opportunities open while intensifying competition. Aggressive pricing by banks and nonbanks can boost volumes but erodes insurance margins; slower credit growth compresses premium intake and scale benefits. Helia must balance market share with underwriting discipline to protect loss ratios and ROE.
- broker-share: ~60%
- fintech-competition: Athena, Tic:Toc
- trade-off: volume vs margin
- priority: underwriting discipline
Inflation and construction costs
High inflation (Australia CPI ~3.9% y/y in 2024) lifts living costs and mortgage stress, increasing default risk for Helia; elevated build costs (estimated +5–8% in 2024) constrain new supply and reduce valuations for off‑the‑plan borrowers. Insurance operating expenses and reinsurance pricing rose sharply (reinsurance ~+15% in 2024), making expense control and dynamic pricing essential.
- Inflation: 3.9% y/y (2024)
- Build costs: +5–8% (2024)
- Reinsurance: ~+15% (2024)
- Priority: expense control, dynamic pricing
Policy support and high LVRs lift first-home buying; debt and migration heighten concentration risk
RBA cash rate 4.35% (mid‑2025) tightens serviceability and raises LMI claim risk; house values +3% y/y to mid‑2024 but softened into 2025. Unemployment 4.0% (June 2025) and wage growth ~3.7% support resilience. Broker share ~60% drives volumes; inflation 3.9% (2024) and reinsurance +15% (2024) pressure costs.
| Metric | Value |
|---|---|
| RBA cash rate | 4.35% (mid‑2025) |
| House prices | +3% y/y to mid‑2024 |
| Unemployment | 4.0% (Jun‑2025) |
| Inflation | 3.9% (2024) |
| Reinsurance | +15% (2024) |
| Broker share | ~60% |
Same Document Delivered
Helia Group PESTLE Analysis
The preview shown here is the exact document you’ll receive after purchase—fully formatted and ready to use. This Helia Group PESTLE Analysis includes political, economic, social, technological, legal and environmental factors, structured for immediate application. No placeholders or teasers: the content, layout and sourcing visible here are what you’ll download after payment.
Original: $10.00
-65%$10.00
$3.50Description
Skip the Research. Get the Strategy.
Gain strategic clarity with our PESTLE Analysis of Helia Group—concise, current, and focused on the political, economic, social, technological, legal, and environmental forces shaping its future. Ideal for investors and strategists; purchase the full report for the complete, actionable breakdown.
Political factors
Housing affordability agenda
Australian federal and state focus on home ownership, including the 2024–25 First Home Guarantee with 35,000 places, boosts high‑LVR lending and elevates low‑deposit (LMI) uptake; first‑home buyers comprised about 38% of new owner‑occupier lending in 2024, amplifying originations for insurers. Cuts or reversals to grants/shared‑equity funding would materially reduce new originations, so Helia must align products and partnerships with shifting public priorities to stay a preferred partner.
Macroprudential settings
APRA macroprudential settings — including investor lending limits, prescribed serviceability buffers and constraints on high‑DTI lending — directly alter Helia’s risk mix and volumes; tighter rules shrink LMI penetration but lift credit quality. Looser settings can boost originations while increasing tail risk against Australia’s high household debt ratio (household debt to disposable income ~188% in 2023). Continuous regulator engagement underpins capital planning and pricing.
Government guarantee programs
The Commonwealth Home Guarantee Scheme (First Home, Family Home and Regional programs), administered via NHFIC, can substitute for or complement LMI for eligible cohorts, redirecting volumes away from traditional LMI customers. Expansion or tightening of places and eligibility shifts LMI demand to other borrower segments; policy design—caps and income or property eligibility—drives the competitive impact. Helia can partner with lenders or tailor products to fill coverage gaps and retain market share.
Regional planning and infrastructure
Regional planning and infrastructure shape housing demand along corridors; 2024 federal and state infrastructure pipelines have already redirected development and lifted origination volumes in prioritised growth areas while concentrating portfolio risk. Delays or cancellations have strained local markets and amplified price volatility, pressuring mortgage insurers. Helia’s geographic risk selection should mirror confirmed political project pipelines to manage concentration and origination exposure.
- Align underwriting to confirmed 2024 project pipelines
- Monitor corridor-driven origination shifts
- Stress-test portfolios for cancellation scenarios
Geopolitical and fiscal posture
Geopolitical and fiscal posture shapes housing demand and bank risk appetite: expansionary budgets and strong migration lift loan growth and LMI demand — Australia reported net overseas migration ~504,000 in 2023–24 with a 2024–25 planning level of 195,000; shifts to austerity or tighter borders can cool volumes, so Helia should scenario‑plan around the 2025 federal election and budget settings.
- Migration: net O/M ~504,000 (2023–24); planning level 195,000 (2024–25)
- Drivers: expansionary fiscal policy => higher loan/LMI demand
- Risks: austerity or border tightening => lower volumes; scenario‑plan
Policy support and high LVRs lift first-home buying; debt and migration heighten concentration risk
Policy support (First Home Guarantee 35,000 places 2024–25) and high‑LVR programs raised low‑deposit lending (first‑home buyers ~38% of new owner‑occupier lending in 2024). APRA rules and high household debt (~188% in 2023) constrain volumes; NHFIC schemes, infrastructure pipelines and migration (~504,000 in 2023–24; planning 195,000 in 2024–25) drive originations and concentration risk.
| Metric | Value |
|---|---|
| First Home Guarantee places | 35,000 (2024–25) |
| First‑home share | ~38% (2024) |
| Household debt | ~188% (2023) |
| Net migration | 504,000 (2023–24); planning 195,000 (2024–25) |
What is included in the product
Detailed Word Document
Provides a concise PESTLE assessment of how Political, Economic, Social, Technological, Environmental and Legal forces uniquely affect Helia Group, with data-backed trends and region-specific regulatory context. Designed for executives and investors to identify risks, opportunities and support forward-looking strategy and scenario planning.
Customizable Excel Spreadsheet
A concise, visually segmented PESTLE summary of Helia Group that reduces prep time and clarifies external risks for meetings. Easily dropped into slides or shared for quick team alignment.
Economic factors
Interest rate cycle
RBA cash rate at 4.35% (mid-2025) directly reduces borrower capacity, increasing arrears and prepayments as variable mortgages reprice. Rising rates compress serviceability and raise default probabilities, elevating LMI claim frequency and severity. Rate easing revives demand and improves cure rates. Helia must price products and hold capital buffers that reflect path uncertainty around current rates.
House price dynamics
House price appreciation reduces loss‑given‑default by increasing equity buffers, while falls amplify claim severity—CoreLogic showed national values rose ~3% year‑on‑year to mid‑2024 but softened into 2025 with small declines in several capital cities. Supply constraints (underbuilding relative to population growth) have supported prices in tight markets. Sharp downturns in Sydney or Melbourne could raise concentration risk in Helia’s book. Helia’s LVR, postcode and property‑type limits cap cyclic exposure.
Employment and income trends
Unemployment at 4.0% (June 2025) and annual wage growth ≈3.7% support borrower resilience, lowering arrears and claim frequency. Strong labour markets historically cut 30–50% of default risk in prime cohorts, reducing claims for lenders like Helia. Localised shocks in construction and hospitality can spike regional stress; portfolio monitoring should map exposures to labour-market heatmaps for early intervention.
Credit growth and competition
Bank appetite, broker channels and fintech entrants (eg Athena, Tic:Toc) materially shape origination flows for Helia (ASX: HLI); brokers account for around 60% of Australian home lending, keeping volume opportunities open while intensifying competition. Aggressive pricing by banks and nonbanks can boost volumes but erodes insurance margins; slower credit growth compresses premium intake and scale benefits. Helia must balance market share with underwriting discipline to protect loss ratios and ROE.
- broker-share: ~60%
- fintech-competition: Athena, Tic:Toc
- trade-off: volume vs margin
- priority: underwriting discipline
Inflation and construction costs
High inflation (Australia CPI ~3.9% y/y in 2024) lifts living costs and mortgage stress, increasing default risk for Helia; elevated build costs (estimated +5–8% in 2024) constrain new supply and reduce valuations for off‑the‑plan borrowers. Insurance operating expenses and reinsurance pricing rose sharply (reinsurance ~+15% in 2024), making expense control and dynamic pricing essential.
- Inflation: 3.9% y/y (2024)
- Build costs: +5–8% (2024)
- Reinsurance: ~+15% (2024)
- Priority: expense control, dynamic pricing
Policy support and high LVRs lift first-home buying; debt and migration heighten concentration risk
RBA cash rate 4.35% (mid‑2025) tightens serviceability and raises LMI claim risk; house values +3% y/y to mid‑2024 but softened into 2025. Unemployment 4.0% (June 2025) and wage growth ~3.7% support resilience. Broker share ~60% drives volumes; inflation 3.9% (2024) and reinsurance +15% (2024) pressure costs.
| Metric | Value |
|---|---|
| RBA cash rate | 4.35% (mid‑2025) |
| House prices | +3% y/y to mid‑2024 |
| Unemployment | 4.0% (Jun‑2025) |
| Inflation | 3.9% (2024) |
| Reinsurance | +15% (2024) |
| Broker share | ~60% |
Same Document Delivered
Helia Group PESTLE Analysis
The preview shown here is the exact document you’ll receive after purchase—fully formatted and ready to use. This Helia Group PESTLE Analysis includes political, economic, social, technological, legal and environmental factors, structured for immediate application. No placeholders or teasers: the content, layout and sourcing visible here are what you’ll download after payment.











