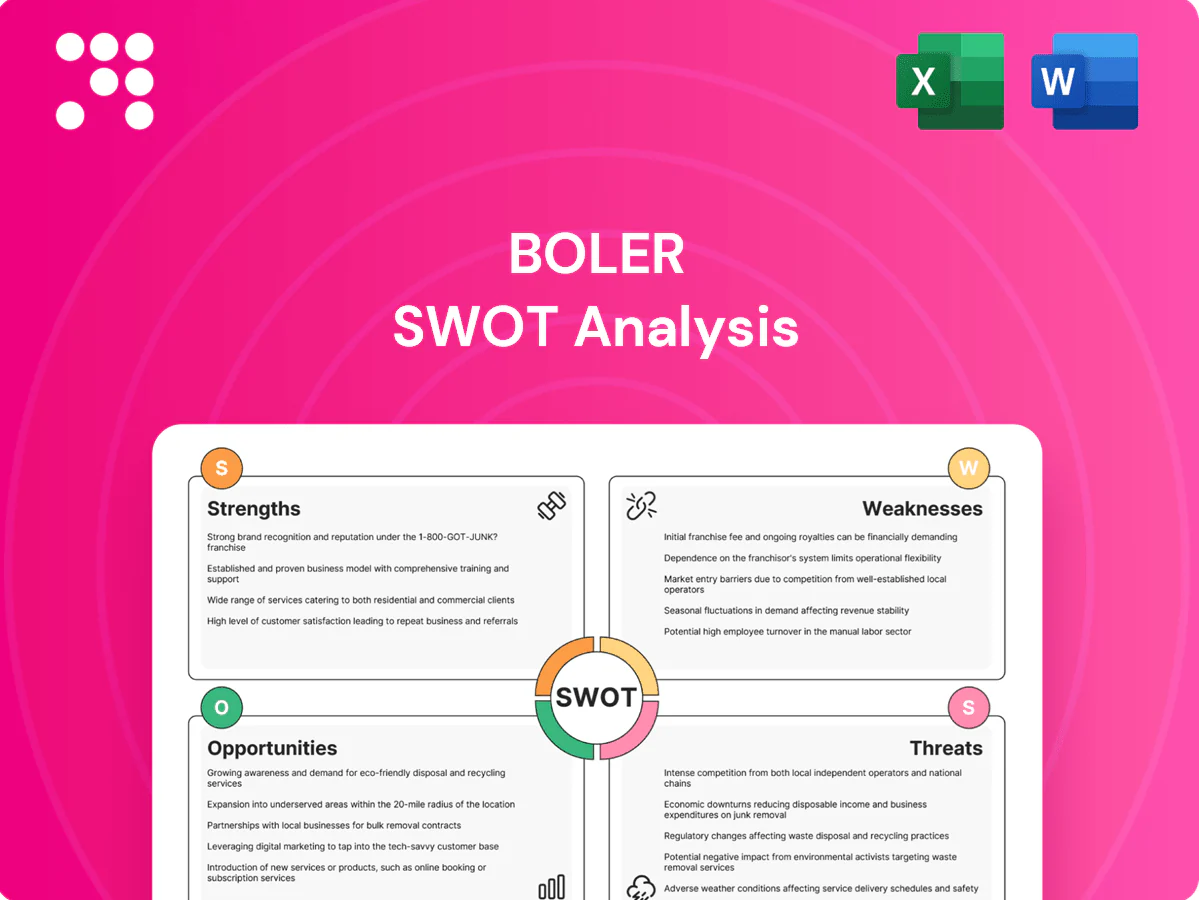
Boler SWOT Analysis

Dive Deeper Into the Company’s Strategic Blueprint
Discover Boler's strategic position with our concise SWOT preview highlighting core strengths, vulnerabilities, and market opportunities. Want deeper, actionable insights, financial context, and tailored strategic recommendations? Purchase the full SWOT analysis—professionally formatted Word and Excel deliverables ready for planning, pitches, and investment decisions.
Strengths

Market-leading commercial suspension brand
Through Hendrickson, Boler commands a leading share of heavy-duty suspension systems for trucks, trailers and buses, backed by a global footprint of over 20 manufacturing and service locations and roughly 6,000 employees; strong OEM and fleet recognition supports pricing power and preferred-supplier status. A broad installed base drives recurring aftermarket demand and strengthens margins, while scale and technical incumbency create high barriers to entry for smaller rivals.
Diversified holdings and cash flow mix
Boler complements manufacturing with real estate and other investments, creating a diversified revenue mix that smooths earnings across economic cycles. Non-operating income from property rentals and financial assets provides strategic flexibility for reinvestment. This cash flow supports funding for innovation initiatives and targeted international expansion.

Global footprint and joint ventures
Partnerships in key regions accelerate market access and localization, with Boler operating through 25 joint ventures that tap local channels and talent. JVs reduce market-entry risk and capital requirements by sharing costs and regulatory compliance. A global footprint aligns products to regional regulations and duty structures and enhances resilience against single-market downturns.

Engineering depth and product innovation
Hendrickson, part of The Boler Company, leverages deep engineering in suspensions, axles and related components to drive continuous product improvements. Its lightweighting and durability focus reduces fleet total cost of ownership via lower fuel and maintenance. Close OEM collaboration embeds designs early, creating a technical moat that supports premium positioning.
- Engineering depth: suspension and axle expertise
- Cost advantage: lightweighting-driven TCO reduction
- OEM integration: early platform embedding
- Moat: supports premium pricing
Long-term family ownership stability
Long-term family ownership provides Boler with patient capital and strategic consistency, enabling investments that favor durable customer relationships over quarterly earnings pressure. Cultural cohesion under family leadership supports talent retention and a strong quality focus, while governance concentrated among owners allows swift execution without public-market distractions.
- Patient capital prioritizes long-term value
- Consistent strategy strengthens customer loyalty
- Cohesive culture aids retention and quality
- Lean governance enables rapid decisions
Heavy-duty suspension leader: more than 20 sites, ~6,000 staff, 25 JVs
Hendrickson gives Boler a leading position in heavy-duty suspensions with a global footprint of over 20 manufacturing/service locations and roughly 6,000 employees, driving OEM preferred-supplier status and pricing power. A large installed base generates recurring aftermarket revenue and margin resilience. Family ownership provides patient capital for long-term engineering and international JV-backed expansion (25 joint ventures).
| Metric | Value |
|---|---|
| Manufacturing/service locations | >20 |
| Employees | ~6,000 |
| Joint ventures | 25 |
| Core business | Heavy-duty suspensions & aftermarket |
What is included in the product
 Detailed Word Document
Delivers a strategic overview of Boler’s internal and external business factors, outlining strengths, weaknesses, opportunities and threats to inform competitive strategy and risk management.

 Customizable Excel Spreadsheet
Provides a focused Boler SWOT matrix that quickly identifies pain points and actionable relief strategies for rapid stakeholder alignment and decision-making.
Weaknesses

Exposure to commercial vehicle cycles
Revenues tied to truck and trailer builds swing with freight and macro conditions, so downcycles compress volumes, pricing, and capacity utilization and strain margins. Aftermarket sales provide a partial cushion but typically do not fully offset OEM declines. Planning and inventory management become more complex across cycles, increasing working capital needs and forecast risk.
Private company transparency limits
Limited public disclosures hinder stakeholder benchmarking; a 2024 investor survey found 62% of respondents cite private-company transparency as a barrier to comparability. Investors and partners face information asymmetry versus public peers, which raises perceived risk and can widen cost of capital by several hundred basis points in similar private deals. This opacity also slows partnership and financing discussions, lengthening deal timetables.

High capital and tooling intensity
Manufacturing suspensions and axles requires sustained capex and tooling investments, often ranging from tens to hundreds of millions per platform, with automation, testing and materials development pushing fixed costs higher. High fixed costs mean underutilization in weak markets can compress supplier margins sharply. Typical payback periods recorded in the industry run about 3 to 7 years, dependent on stable platform adoption by OEMs.

Dependence on OEM platform wins
Dependence on OEM platform wins makes specification into new truck and trailer platforms critical for volume visibility; losing a platform can materially reduce regional share and pricing leverage. Long qualification cycles, commonly 12–36 months in commercial vehicle supply chains, delay revenue realization from innovations. High customer concentration amplifies negotiation pressure and margin risk.
- Platform reliance: risk to volumes and share
- Qualification lag: 12–36 months to revenue
- Customer concentration: increased pricing pressure
Limited consumer brand visibility
- End customers: fleets & OEMs
- Industry recognition > consumer recognition
- Marketing leverage limited
- Recruiting/diversification awareness hurdles
Freight cycles, heavy capex and disclosure gap — 62% cite benchmark risk
Revenues are cyclical, linked to freight/macroeconomic swings, compressing volumes, pricing and utilization; aftermarket sales only partially offset OEM declines. Limited disclosure hinders benchmarking—62% of 2024 investors cite private-company transparency as a comparability barrier. High platform capex (tens–hundreds $M) with typical paybacks of 3–7 years and 12–36 month qualification cycles raise working capital and execution risk.
| Metric | Value |
|---|---|
| Transparency barrier (2024) | 62% |
| Platform capex | tens–hundreds $M |
| Payback period | 3–7 years |
| Qualification lag | 12–36 months |
Preview the Actual Deliverable
Boler SWOT Analysis
This is the actual Boler SWOT analysis document you’ll receive upon purchase—no surprises, just professional quality. The preview below is taken directly from the full report; purchase unlocks the entire in-depth, editable version. You’re viewing a live excerpt of the real file, ready to download after checkout.

Dive Deeper Into the Company’s Strategic Blueprint
Discover Boler's strategic position with our concise SWOT preview highlighting core strengths, vulnerabilities, and market opportunities. Want deeper, actionable insights, financial context, and tailored strategic recommendations? Purchase the full SWOT analysis—professionally formatted Word and Excel deliverables ready for planning, pitches, and investment decisions.
Strengths
Market-leading commercial suspension brand
Through Hendrickson, Boler commands a leading share of heavy-duty suspension systems for trucks, trailers and buses, backed by a global footprint of over 20 manufacturing and service locations and roughly 6,000 employees; strong OEM and fleet recognition supports pricing power and preferred-supplier status. A broad installed base drives recurring aftermarket demand and strengthens margins, while scale and technical incumbency create high barriers to entry for smaller rivals.
Diversified holdings and cash flow mix
Boler complements manufacturing with real estate and other investments, creating a diversified revenue mix that smooths earnings across economic cycles. Non-operating income from property rentals and financial assets provides strategic flexibility for reinvestment. This cash flow supports funding for innovation initiatives and targeted international expansion.
Global footprint and joint ventures
Partnerships in key regions accelerate market access and localization, with Boler operating through 25 joint ventures that tap local channels and talent. JVs reduce market-entry risk and capital requirements by sharing costs and regulatory compliance. A global footprint aligns products to regional regulations and duty structures and enhances resilience against single-market downturns.
Engineering depth and product innovation
Hendrickson, part of The Boler Company, leverages deep engineering in suspensions, axles and related components to drive continuous product improvements. Its lightweighting and durability focus reduces fleet total cost of ownership via lower fuel and maintenance. Close OEM collaboration embeds designs early, creating a technical moat that supports premium positioning.
- Engineering depth: suspension and axle expertise
- Cost advantage: lightweighting-driven TCO reduction
- OEM integration: early platform embedding
- Moat: supports premium pricing
Long-term family ownership stability
Long-term family ownership provides Boler with patient capital and strategic consistency, enabling investments that favor durable customer relationships over quarterly earnings pressure. Cultural cohesion under family leadership supports talent retention and a strong quality focus, while governance concentrated among owners allows swift execution without public-market distractions.
- Patient capital prioritizes long-term value
- Consistent strategy strengthens customer loyalty
- Cohesive culture aids retention and quality
- Lean governance enables rapid decisions
Heavy-duty suspension leader: more than 20 sites, ~6,000 staff, 25 JVs
Hendrickson gives Boler a leading position in heavy-duty suspensions with a global footprint of over 20 manufacturing/service locations and roughly 6,000 employees, driving OEM preferred-supplier status and pricing power. A large installed base generates recurring aftermarket revenue and margin resilience. Family ownership provides patient capital for long-term engineering and international JV-backed expansion (25 joint ventures).
| Metric | Value |
|---|---|
| Manufacturing/service locations | >20 |
| Employees | ~6,000 |
| Joint ventures | 25 |
| Core business | Heavy-duty suspensions & aftermarket |
What is included in the product
Detailed Word Document
Delivers a strategic overview of Boler’s internal and external business factors, outlining strengths, weaknesses, opportunities and threats to inform competitive strategy and risk management.
Customizable Excel Spreadsheet
Provides a focused Boler SWOT matrix that quickly identifies pain points and actionable relief strategies for rapid stakeholder alignment and decision-making.
Weaknesses
Exposure to commercial vehicle cycles
Revenues tied to truck and trailer builds swing with freight and macro conditions, so downcycles compress volumes, pricing, and capacity utilization and strain margins. Aftermarket sales provide a partial cushion but typically do not fully offset OEM declines. Planning and inventory management become more complex across cycles, increasing working capital needs and forecast risk.
Private company transparency limits
Limited public disclosures hinder stakeholder benchmarking; a 2024 investor survey found 62% of respondents cite private-company transparency as a barrier to comparability. Investors and partners face information asymmetry versus public peers, which raises perceived risk and can widen cost of capital by several hundred basis points in similar private deals. This opacity also slows partnership and financing discussions, lengthening deal timetables.
High capital and tooling intensity
Manufacturing suspensions and axles requires sustained capex and tooling investments, often ranging from tens to hundreds of millions per platform, with automation, testing and materials development pushing fixed costs higher. High fixed costs mean underutilization in weak markets can compress supplier margins sharply. Typical payback periods recorded in the industry run about 3 to 7 years, dependent on stable platform adoption by OEMs.
Dependence on OEM platform wins
Dependence on OEM platform wins makes specification into new truck and trailer platforms critical for volume visibility; losing a platform can materially reduce regional share and pricing leverage. Long qualification cycles, commonly 12–36 months in commercial vehicle supply chains, delay revenue realization from innovations. High customer concentration amplifies negotiation pressure and margin risk.
- Platform reliance: risk to volumes and share
- Qualification lag: 12–36 months to revenue
- Customer concentration: increased pricing pressure
Limited consumer brand visibility
- End customers: fleets & OEMs
- Industry recognition > consumer recognition
- Marketing leverage limited
- Recruiting/diversification awareness hurdles
Freight cycles, heavy capex and disclosure gap — 62% cite benchmark risk
Revenues are cyclical, linked to freight/macroeconomic swings, compressing volumes, pricing and utilization; aftermarket sales only partially offset OEM declines. Limited disclosure hinders benchmarking—62% of 2024 investors cite private-company transparency as a comparability barrier. High platform capex (tens–hundreds $M) with typical paybacks of 3–7 years and 12–36 month qualification cycles raise working capital and execution risk.
| Metric | Value |
|---|---|
| Transparency barrier (2024) | 62% |
| Platform capex | tens–hundreds $M |
| Payback period | 3–7 years |
| Qualification lag | 12–36 months |
Preview the Actual Deliverable
Boler SWOT Analysis
This is the actual Boler SWOT analysis document you’ll receive upon purchase—no surprises, just professional quality. The preview below is taken directly from the full report; purchase unlocks the entire in-depth, editable version. You’re viewing a live excerpt of the real file, ready to download after checkout.
Original: $10.00
-65%$10.00
$3.50Description
Dive Deeper Into the Company’s Strategic Blueprint
Discover Boler's strategic position with our concise SWOT preview highlighting core strengths, vulnerabilities, and market opportunities. Want deeper, actionable insights, financial context, and tailored strategic recommendations? Purchase the full SWOT analysis—professionally formatted Word and Excel deliverables ready for planning, pitches, and investment decisions.
Strengths
Market-leading commercial suspension brand
Through Hendrickson, Boler commands a leading share of heavy-duty suspension systems for trucks, trailers and buses, backed by a global footprint of over 20 manufacturing and service locations and roughly 6,000 employees; strong OEM and fleet recognition supports pricing power and preferred-supplier status. A broad installed base drives recurring aftermarket demand and strengthens margins, while scale and technical incumbency create high barriers to entry for smaller rivals.
Diversified holdings and cash flow mix
Boler complements manufacturing with real estate and other investments, creating a diversified revenue mix that smooths earnings across economic cycles. Non-operating income from property rentals and financial assets provides strategic flexibility for reinvestment. This cash flow supports funding for innovation initiatives and targeted international expansion.
Global footprint and joint ventures
Partnerships in key regions accelerate market access and localization, with Boler operating through 25 joint ventures that tap local channels and talent. JVs reduce market-entry risk and capital requirements by sharing costs and regulatory compliance. A global footprint aligns products to regional regulations and duty structures and enhances resilience against single-market downturns.
Engineering depth and product innovation
Hendrickson, part of The Boler Company, leverages deep engineering in suspensions, axles and related components to drive continuous product improvements. Its lightweighting and durability focus reduces fleet total cost of ownership via lower fuel and maintenance. Close OEM collaboration embeds designs early, creating a technical moat that supports premium positioning.
- Engineering depth: suspension and axle expertise
- Cost advantage: lightweighting-driven TCO reduction
- OEM integration: early platform embedding
- Moat: supports premium pricing
Long-term family ownership stability
Long-term family ownership provides Boler with patient capital and strategic consistency, enabling investments that favor durable customer relationships over quarterly earnings pressure. Cultural cohesion under family leadership supports talent retention and a strong quality focus, while governance concentrated among owners allows swift execution without public-market distractions.
- Patient capital prioritizes long-term value
- Consistent strategy strengthens customer loyalty
- Cohesive culture aids retention and quality
- Lean governance enables rapid decisions
Heavy-duty suspension leader: more than 20 sites, ~6,000 staff, 25 JVs
Hendrickson gives Boler a leading position in heavy-duty suspensions with a global footprint of over 20 manufacturing/service locations and roughly 6,000 employees, driving OEM preferred-supplier status and pricing power. A large installed base generates recurring aftermarket revenue and margin resilience. Family ownership provides patient capital for long-term engineering and international JV-backed expansion (25 joint ventures).
| Metric | Value |
|---|---|
| Manufacturing/service locations | >20 |
| Employees | ~6,000 |
| Joint ventures | 25 |
| Core business | Heavy-duty suspensions & aftermarket |
What is included in the product
Detailed Word Document
Delivers a strategic overview of Boler’s internal and external business factors, outlining strengths, weaknesses, opportunities and threats to inform competitive strategy and risk management.
Customizable Excel Spreadsheet
Provides a focused Boler SWOT matrix that quickly identifies pain points and actionable relief strategies for rapid stakeholder alignment and decision-making.
Weaknesses
Exposure to commercial vehicle cycles
Revenues tied to truck and trailer builds swing with freight and macro conditions, so downcycles compress volumes, pricing, and capacity utilization and strain margins. Aftermarket sales provide a partial cushion but typically do not fully offset OEM declines. Planning and inventory management become more complex across cycles, increasing working capital needs and forecast risk.
Private company transparency limits
Limited public disclosures hinder stakeholder benchmarking; a 2024 investor survey found 62% of respondents cite private-company transparency as a barrier to comparability. Investors and partners face information asymmetry versus public peers, which raises perceived risk and can widen cost of capital by several hundred basis points in similar private deals. This opacity also slows partnership and financing discussions, lengthening deal timetables.
High capital and tooling intensity
Manufacturing suspensions and axles requires sustained capex and tooling investments, often ranging from tens to hundreds of millions per platform, with automation, testing and materials development pushing fixed costs higher. High fixed costs mean underutilization in weak markets can compress supplier margins sharply. Typical payback periods recorded in the industry run about 3 to 7 years, dependent on stable platform adoption by OEMs.
Dependence on OEM platform wins
Dependence on OEM platform wins makes specification into new truck and trailer platforms critical for volume visibility; losing a platform can materially reduce regional share and pricing leverage. Long qualification cycles, commonly 12–36 months in commercial vehicle supply chains, delay revenue realization from innovations. High customer concentration amplifies negotiation pressure and margin risk.
- Platform reliance: risk to volumes and share
- Qualification lag: 12–36 months to revenue
- Customer concentration: increased pricing pressure
Limited consumer brand visibility
- End customers: fleets & OEMs
- Industry recognition > consumer recognition
- Marketing leverage limited
- Recruiting/diversification awareness hurdles
Freight cycles, heavy capex and disclosure gap — 62% cite benchmark risk
Revenues are cyclical, linked to freight/macroeconomic swings, compressing volumes, pricing and utilization; aftermarket sales only partially offset OEM declines. Limited disclosure hinders benchmarking—62% of 2024 investors cite private-company transparency as a comparability barrier. High platform capex (tens–hundreds $M) with typical paybacks of 3–7 years and 12–36 month qualification cycles raise working capital and execution risk.
| Metric | Value |
|---|---|
| Transparency barrier (2024) | 62% |
| Platform capex | tens–hundreds $M |
| Payback period | 3–7 years |
| Qualification lag | 12–36 months |
Preview the Actual Deliverable
Boler SWOT Analysis
This is the actual Boler SWOT analysis document you’ll receive upon purchase—no surprises, just professional quality. The preview below is taken directly from the full report; purchase unlocks the entire in-depth, editable version. You’re viewing a live excerpt of the real file, ready to download after checkout.











