Heritage Insurance Holdings Business Model Canvas

Business Model Canvas: Strategic blueprint for scaling an insurance holding
Unlock Heritage Insurance Holdings’ strategic blueprint with our concise Business Model Canvas overview that maps customer segments, value propositions, key partners, and revenue streams. This snapshot reveals how the company scales, manages risk, and captures market share in a competitive insurance landscape. Purchase the full, editable Business Model Canvas to access granular insights, financial implications, and a ready-to-use template for strategy or investor presentations.
Partnerships

Global reinsurers and ILS providers
Global reinsurers absorb peak catastrophe risk and stabilize Heritage Insurance Holdings earnings after major storms through multi-year quota-share and excess-of-loss treaties that expand capacity in hurricane-prone states. ILS funds and cat bonds diversify counterparty exposure and can lower cost of capital versus traditional reinsurance. Strong reinsurer panels enable rapid program renewals and responsive event reinstatements, preserving underwriting continuity.
Independent agents and MGAs
Independent agents originate most personal and commercial residential policies in coastal markets, driving roughly 68% of Heritage’s coastal premium flow in 2024; MGAs extend reach into niche segments like condominium associations and rentals, contributing ~22% of niche-channel premiums. Incentive-aligned commission structures improved retention rates by ~4 percentage points and raised quality submissions, while joint training and co-marketing lifted placement ratios and underwriting efficiency by about 10% year-over-year.

Claims adjusting and restoration networks
Third-party adjusters can scale capacity up to fivefold during catastrophe surges, enabling rapid field presence; preferred contractors and restoration firms have been shown to reduce loss severity and cut cycle times by roughly 25–35%, lowering average claim payouts and rebuild durations. Digital inspection partners enable touchless and drone-supported assessments, accelerating FNOL-to-resolution, while service-level agreements enforce customer satisfaction and regulatory timelines.

Catastrophe modeling and data providers
Catastrophe modeling and data providers supply hurricane, flood and wind vulnerability models that inform Heritage Insurance Holdings pricing and capacity decisions, with 2024 model updates integrated for current exposures; GIS, aerial imagery and parcel-level property data refine risk selection; event-response feeds enable near real-time portfolio stress monitoring; external model governance partners validate assumptions to meet regulatory expectations.
- 2024 model updates integrated
- Parcel-level risk selection via GIS/aerial imagery
- Real-time event-response portfolio stress feeds
- Third-party model governance for regulatory validation
Regulators, rating agencies, and capital markets
Regulators such as the Florida Office of Insurance Regulation ensure compliance and product approvals, while rating agencies assess capitalization, reinsurance and risk management which affects distribution access; NOAA's 2024 Atlantic outlook forecast 14–21 named storms, reinforcing this scrutiny. Banking and capital markets provide liquidity lines and surplus-raising channels, and transparent dialogue sustains confidence during active storm seasons.
- Regulators: Florida OIR oversight
- Rating impact: distribution access
- Capital partners: credit lines, equity/debt
- Market signal: NOAA 2024 forecast 14–21 storms
Reinsurance/ILS cede ~45%; claims cut 25–35%
Reinsurers and ILS (cat bonds) provide multi-year quota-share and excess protection, stabilizing post-storm earnings and expanding capacity; 2024 renewals kept ceded share ~45%. Independent agents/MGAs drive ~90% of coastal/niche distribution (68% agents, 22% MGAs), boosting retention +4pp and placement +10%. TP adjusters, contractors and digital inspection partners cut claim cycle times 25–35% and scale 5x during CATs.
| Partner | 2024 Metric |
|---|---|
| Reinsurance/ILS | c.45% ceded |
| Agents/MGAs | 68% / 22% premium |
| Claims partners | 25–35% cycle reduction |
What is included in the product
 Detailed Word Document
A concise, investor-ready Business Model Canvas for Heritage Insurance Holdings detailing customer segments, value propositions, channels, revenue streams and key resources across the 9 BMC blocks, with linked competitive advantages and a SWOT to support strategic decisions and funding discussions.

 Customizable Excel Spreadsheet
High-level view of Heritage Insurance Holdings’ business model with editable cells to quickly pinpoint and resolve distribution, underwriting, and cost-structure pain points. Clean, shareable one-page snapshot saves hours of formatting and helps teams iterate solutions fast for boardroom decisions or operational improvements.
Activities

Catastrophe-focused underwriting
Assess wind, hail, and flood exposures using granular property attributes (roof age, construction, elevation) and align deductibles, limits, and terms to modeled loss costs from vendor catastrophe models. Apply geographic and peril aggregates to manage concentration and reinsurance attachment layers. Continuously refine underwriting guidelines as climate-driven peril patterns and building code changes evolve.
Risk transfer and capital management
Structure quota‑share and excess‑of‑loss programs to smooth volatility, targeting retention aligned with surplus and earnings—benchmarks for 2024 ILS capacity exceeded $100B and cat bond issuance approached $20B, expanding third‑party capacity. Optimize retention to preserve statutory surplus and ROE while using sidecars and ILS to diversify peak risk. Rigorously monitor counterparty credit and collateral sufficiency pre‑ and post‑event.

Claims triage and catastrophe response
Heritage pre-stages adjusters and vetted vendors ahead of likely impact zones to shorten response time and mirror NOAA’s 2024 above‑normal Atlantic outlook. Digital FNOL, aerial imagery and analytics drive rapid coverage decisions and routing, accelerating triage and payments. Complex losses and vulnerable policyholders are prioritized while severity drivers are tracked to refine subrogation and fraud controls.

Pricing, actuarial, and portfolio optimization
Blend actuarial indications with forward-looking cat models to stress-test premiums and exposures, targeting a 12–15% ROE while rebalancing geographies, construction types and policy forms to shift risk away from high-loss corridors.
- File rate and form changes to offset 2024 CPI ~3.4% and maintain adequacy
- Monitor reinsurance pricing to keep combined ratio under 95%
- Use portfolio optimization to reduce peak zone concentration
Regulatory compliance and producer enablement
Regulatory compliance and producer enablement ensures multi-state filings via SERFF (used by states as of 2024), solvency reporting and market conduct readiness while providing portals, APIs and appetite guides to agents and MGAs. Training and underwriting feedback raise submission quality; compliant retention and cross-sell campaigns protect license risk.
- Multi-state filings: SERFF (2024)
- Portals/APIs for agents and MGAs
- Underwriter training and feedback loops
- Compliant retention & cross-sell campaigns
Align cat models, leverage ILS and cat bonds to target 12-15% ROE
Assess granular wind, hail and flood exposures, align deductibles/limits to vendor cat models and update underwriting as climate and codes change. Manage retention via quota‑share and XS programs, leveraging 2024 ILS capacity >$100B and ~ $20B cat bond market to target 12–15% ROE and CR <95%. Pre‑stage adjusters, use FNOL/imagery for rapid claims and track severity for subrogation.
| Metric | 2024 |
|---|---|
| ILS capacity | >$100B |
| Cat bonds issued | ~$20B |
| CPI | 3.4% |
| Target ROE | 12–15% |
Delivered as Displayed
Business Model Canvas
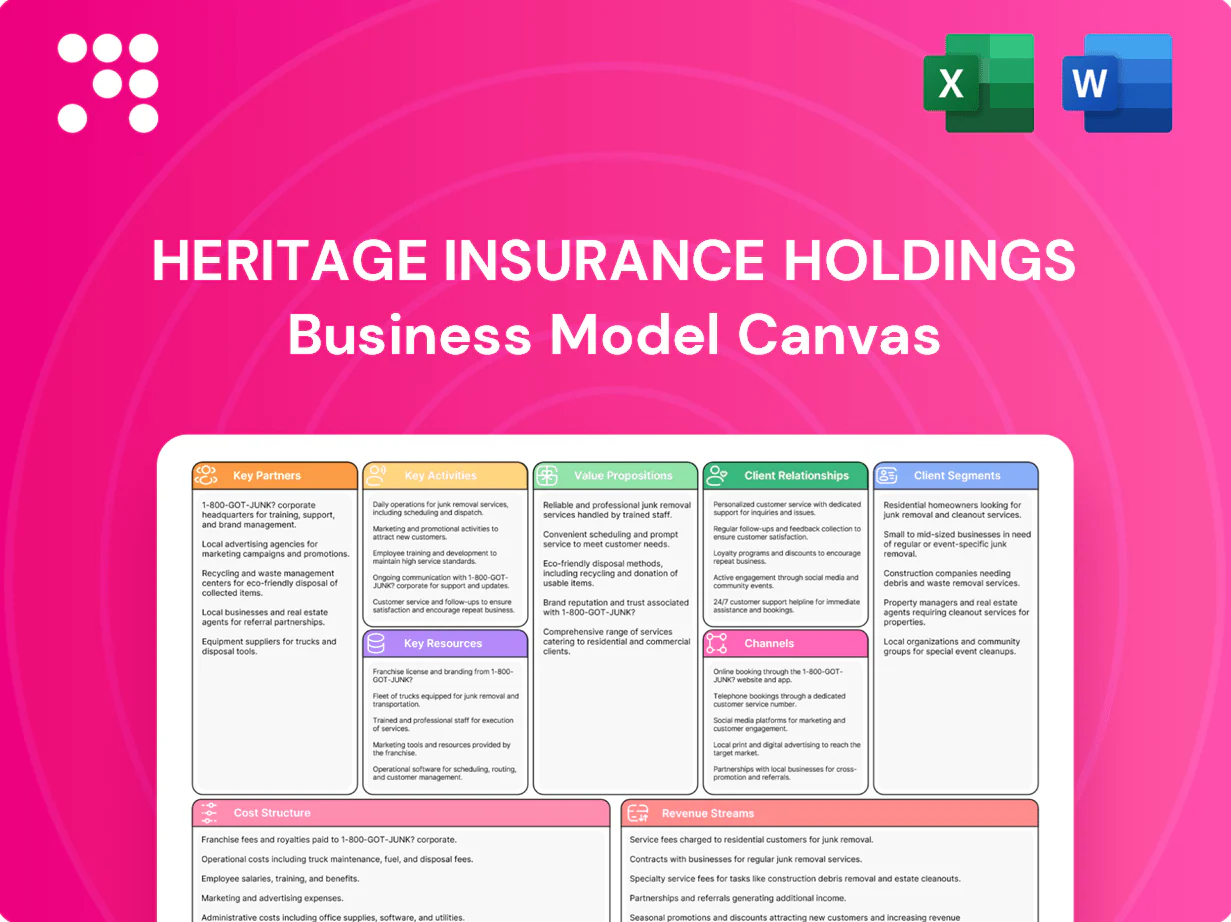
The Business Model Canvas you’re previewing for Heritage Insurance Holdings is the exact deliverable—not a mockup—and contains the same content, structure, and formatting you’ll receive after purchase. Upon ordering you’ll get the complete, editable file ready for presenting, editing, and sharing. No placeholders, no surprises—what you see is what you’ll download.

Business Model Canvas: Strategic blueprint for scaling an insurance holding
Unlock Heritage Insurance Holdings’ strategic blueprint with our concise Business Model Canvas overview that maps customer segments, value propositions, key partners, and revenue streams. This snapshot reveals how the company scales, manages risk, and captures market share in a competitive insurance landscape. Purchase the full, editable Business Model Canvas to access granular insights, financial implications, and a ready-to-use template for strategy or investor presentations.
Partnerships
Global reinsurers and ILS providers
Global reinsurers absorb peak catastrophe risk and stabilize Heritage Insurance Holdings earnings after major storms through multi-year quota-share and excess-of-loss treaties that expand capacity in hurricane-prone states. ILS funds and cat bonds diversify counterparty exposure and can lower cost of capital versus traditional reinsurance. Strong reinsurer panels enable rapid program renewals and responsive event reinstatements, preserving underwriting continuity.
Independent agents and MGAs
Independent agents originate most personal and commercial residential policies in coastal markets, driving roughly 68% of Heritage’s coastal premium flow in 2024; MGAs extend reach into niche segments like condominium associations and rentals, contributing ~22% of niche-channel premiums. Incentive-aligned commission structures improved retention rates by ~4 percentage points and raised quality submissions, while joint training and co-marketing lifted placement ratios and underwriting efficiency by about 10% year-over-year.
Claims adjusting and restoration networks
Third-party adjusters can scale capacity up to fivefold during catastrophe surges, enabling rapid field presence; preferred contractors and restoration firms have been shown to reduce loss severity and cut cycle times by roughly 25–35%, lowering average claim payouts and rebuild durations. Digital inspection partners enable touchless and drone-supported assessments, accelerating FNOL-to-resolution, while service-level agreements enforce customer satisfaction and regulatory timelines.
Catastrophe modeling and data providers
Catastrophe modeling and data providers supply hurricane, flood and wind vulnerability models that inform Heritage Insurance Holdings pricing and capacity decisions, with 2024 model updates integrated for current exposures; GIS, aerial imagery and parcel-level property data refine risk selection; event-response feeds enable near real-time portfolio stress monitoring; external model governance partners validate assumptions to meet regulatory expectations.
- 2024 model updates integrated
- Parcel-level risk selection via GIS/aerial imagery
- Real-time event-response portfolio stress feeds
- Third-party model governance for regulatory validation
Regulators, rating agencies, and capital markets
Regulators such as the Florida Office of Insurance Regulation ensure compliance and product approvals, while rating agencies assess capitalization, reinsurance and risk management which affects distribution access; NOAA's 2024 Atlantic outlook forecast 14–21 named storms, reinforcing this scrutiny. Banking and capital markets provide liquidity lines and surplus-raising channels, and transparent dialogue sustains confidence during active storm seasons.
- Regulators: Florida OIR oversight
- Rating impact: distribution access
- Capital partners: credit lines, equity/debt
- Market signal: NOAA 2024 forecast 14–21 storms
Reinsurance/ILS cede ~45%; claims cut 25–35%
Reinsurers and ILS (cat bonds) provide multi-year quota-share and excess protection, stabilizing post-storm earnings and expanding capacity; 2024 renewals kept ceded share ~45%. Independent agents/MGAs drive ~90% of coastal/niche distribution (68% agents, 22% MGAs), boosting retention +4pp and placement +10%. TP adjusters, contractors and digital inspection partners cut claim cycle times 25–35% and scale 5x during CATs.
| Partner | 2024 Metric |
|---|---|
| Reinsurance/ILS | c.45% ceded |
| Agents/MGAs | 68% / 22% premium |
| Claims partners | 25–35% cycle reduction |
What is included in the product
Detailed Word Document
A concise, investor-ready Business Model Canvas for Heritage Insurance Holdings detailing customer segments, value propositions, channels, revenue streams and key resources across the 9 BMC blocks, with linked competitive advantages and a SWOT to support strategic decisions and funding discussions.
Customizable Excel Spreadsheet
High-level view of Heritage Insurance Holdings’ business model with editable cells to quickly pinpoint and resolve distribution, underwriting, and cost-structure pain points. Clean, shareable one-page snapshot saves hours of formatting and helps teams iterate solutions fast for boardroom decisions or operational improvements.
Activities
Catastrophe-focused underwriting
Assess wind, hail, and flood exposures using granular property attributes (roof age, construction, elevation) and align deductibles, limits, and terms to modeled loss costs from vendor catastrophe models. Apply geographic and peril aggregates to manage concentration and reinsurance attachment layers. Continuously refine underwriting guidelines as climate-driven peril patterns and building code changes evolve.
Risk transfer and capital management
Structure quota‑share and excess‑of‑loss programs to smooth volatility, targeting retention aligned with surplus and earnings—benchmarks for 2024 ILS capacity exceeded $100B and cat bond issuance approached $20B, expanding third‑party capacity. Optimize retention to preserve statutory surplus and ROE while using sidecars and ILS to diversify peak risk. Rigorously monitor counterparty credit and collateral sufficiency pre‑ and post‑event.
Claims triage and catastrophe response
Heritage pre-stages adjusters and vetted vendors ahead of likely impact zones to shorten response time and mirror NOAA’s 2024 above‑normal Atlantic outlook. Digital FNOL, aerial imagery and analytics drive rapid coverage decisions and routing, accelerating triage and payments. Complex losses and vulnerable policyholders are prioritized while severity drivers are tracked to refine subrogation and fraud controls.
Pricing, actuarial, and portfolio optimization
Blend actuarial indications with forward-looking cat models to stress-test premiums and exposures, targeting a 12–15% ROE while rebalancing geographies, construction types and policy forms to shift risk away from high-loss corridors.
- File rate and form changes to offset 2024 CPI ~3.4% and maintain adequacy
- Monitor reinsurance pricing to keep combined ratio under 95%
- Use portfolio optimization to reduce peak zone concentration
Regulatory compliance and producer enablement
Regulatory compliance and producer enablement ensures multi-state filings via SERFF (used by states as of 2024), solvency reporting and market conduct readiness while providing portals, APIs and appetite guides to agents and MGAs. Training and underwriting feedback raise submission quality; compliant retention and cross-sell campaigns protect license risk.
- Multi-state filings: SERFF (2024)
- Portals/APIs for agents and MGAs
- Underwriter training and feedback loops
- Compliant retention & cross-sell campaigns
Align cat models, leverage ILS and cat bonds to target 12-15% ROE
Assess granular wind, hail and flood exposures, align deductibles/limits to vendor cat models and update underwriting as climate and codes change. Manage retention via quota‑share and XS programs, leveraging 2024 ILS capacity >$100B and ~ $20B cat bond market to target 12–15% ROE and CR <95%. Pre‑stage adjusters, use FNOL/imagery for rapid claims and track severity for subrogation.
| Metric | 2024 |
|---|---|
| ILS capacity | >$100B |
| Cat bonds issued | ~$20B |
| CPI | 3.4% |
| Target ROE | 12–15% |
Delivered as Displayed
Business Model Canvas
The Business Model Canvas you’re previewing for Heritage Insurance Holdings is the exact deliverable—not a mockup—and contains the same content, structure, and formatting you’ll receive after purchase. Upon ordering you’ll get the complete, editable file ready for presenting, editing, and sharing. No placeholders, no surprises—what you see is what you’ll download.
Description
Business Model Canvas: Strategic blueprint for scaling an insurance holding
Unlock Heritage Insurance Holdings’ strategic blueprint with our concise Business Model Canvas overview that maps customer segments, value propositions, key partners, and revenue streams. This snapshot reveals how the company scales, manages risk, and captures market share in a competitive insurance landscape. Purchase the full, editable Business Model Canvas to access granular insights, financial implications, and a ready-to-use template for strategy or investor presentations.
Partnerships
Global reinsurers and ILS providers
Global reinsurers absorb peak catastrophe risk and stabilize Heritage Insurance Holdings earnings after major storms through multi-year quota-share and excess-of-loss treaties that expand capacity in hurricane-prone states. ILS funds and cat bonds diversify counterparty exposure and can lower cost of capital versus traditional reinsurance. Strong reinsurer panels enable rapid program renewals and responsive event reinstatements, preserving underwriting continuity.
Independent agents and MGAs
Independent agents originate most personal and commercial residential policies in coastal markets, driving roughly 68% of Heritage’s coastal premium flow in 2024; MGAs extend reach into niche segments like condominium associations and rentals, contributing ~22% of niche-channel premiums. Incentive-aligned commission structures improved retention rates by ~4 percentage points and raised quality submissions, while joint training and co-marketing lifted placement ratios and underwriting efficiency by about 10% year-over-year.
Claims adjusting and restoration networks
Third-party adjusters can scale capacity up to fivefold during catastrophe surges, enabling rapid field presence; preferred contractors and restoration firms have been shown to reduce loss severity and cut cycle times by roughly 25–35%, lowering average claim payouts and rebuild durations. Digital inspection partners enable touchless and drone-supported assessments, accelerating FNOL-to-resolution, while service-level agreements enforce customer satisfaction and regulatory timelines.
Catastrophe modeling and data providers
Catastrophe modeling and data providers supply hurricane, flood and wind vulnerability models that inform Heritage Insurance Holdings pricing and capacity decisions, with 2024 model updates integrated for current exposures; GIS, aerial imagery and parcel-level property data refine risk selection; event-response feeds enable near real-time portfolio stress monitoring; external model governance partners validate assumptions to meet regulatory expectations.
- 2024 model updates integrated
- Parcel-level risk selection via GIS/aerial imagery
- Real-time event-response portfolio stress feeds
- Third-party model governance for regulatory validation
Regulators, rating agencies, and capital markets
Regulators such as the Florida Office of Insurance Regulation ensure compliance and product approvals, while rating agencies assess capitalization, reinsurance and risk management which affects distribution access; NOAA's 2024 Atlantic outlook forecast 14–21 named storms, reinforcing this scrutiny. Banking and capital markets provide liquidity lines and surplus-raising channels, and transparent dialogue sustains confidence during active storm seasons.
- Regulators: Florida OIR oversight
- Rating impact: distribution access
- Capital partners: credit lines, equity/debt
- Market signal: NOAA 2024 forecast 14–21 storms
Reinsurance/ILS cede ~45%; claims cut 25–35%
Reinsurers and ILS (cat bonds) provide multi-year quota-share and excess protection, stabilizing post-storm earnings and expanding capacity; 2024 renewals kept ceded share ~45%. Independent agents/MGAs drive ~90% of coastal/niche distribution (68% agents, 22% MGAs), boosting retention +4pp and placement +10%. TP adjusters, contractors and digital inspection partners cut claim cycle times 25–35% and scale 5x during CATs.
| Partner | 2024 Metric |
|---|---|
| Reinsurance/ILS | c.45% ceded |
| Agents/MGAs | 68% / 22% premium |
| Claims partners | 25–35% cycle reduction |
What is included in the product
Detailed Word Document
A concise, investor-ready Business Model Canvas for Heritage Insurance Holdings detailing customer segments, value propositions, channels, revenue streams and key resources across the 9 BMC blocks, with linked competitive advantages and a SWOT to support strategic decisions and funding discussions.
Customizable Excel Spreadsheet
High-level view of Heritage Insurance Holdings’ business model with editable cells to quickly pinpoint and resolve distribution, underwriting, and cost-structure pain points. Clean, shareable one-page snapshot saves hours of formatting and helps teams iterate solutions fast for boardroom decisions or operational improvements.
Activities
Catastrophe-focused underwriting
Assess wind, hail, and flood exposures using granular property attributes (roof age, construction, elevation) and align deductibles, limits, and terms to modeled loss costs from vendor catastrophe models. Apply geographic and peril aggregates to manage concentration and reinsurance attachment layers. Continuously refine underwriting guidelines as climate-driven peril patterns and building code changes evolve.
Risk transfer and capital management
Structure quota‑share and excess‑of‑loss programs to smooth volatility, targeting retention aligned with surplus and earnings—benchmarks for 2024 ILS capacity exceeded $100B and cat bond issuance approached $20B, expanding third‑party capacity. Optimize retention to preserve statutory surplus and ROE while using sidecars and ILS to diversify peak risk. Rigorously monitor counterparty credit and collateral sufficiency pre‑ and post‑event.
Claims triage and catastrophe response
Heritage pre-stages adjusters and vetted vendors ahead of likely impact zones to shorten response time and mirror NOAA’s 2024 above‑normal Atlantic outlook. Digital FNOL, aerial imagery and analytics drive rapid coverage decisions and routing, accelerating triage and payments. Complex losses and vulnerable policyholders are prioritized while severity drivers are tracked to refine subrogation and fraud controls.
Pricing, actuarial, and portfolio optimization
Blend actuarial indications with forward-looking cat models to stress-test premiums and exposures, targeting a 12–15% ROE while rebalancing geographies, construction types and policy forms to shift risk away from high-loss corridors.
- File rate and form changes to offset 2024 CPI ~3.4% and maintain adequacy
- Monitor reinsurance pricing to keep combined ratio under 95%
- Use portfolio optimization to reduce peak zone concentration
Regulatory compliance and producer enablement
Regulatory compliance and producer enablement ensures multi-state filings via SERFF (used by states as of 2024), solvency reporting and market conduct readiness while providing portals, APIs and appetite guides to agents and MGAs. Training and underwriting feedback raise submission quality; compliant retention and cross-sell campaigns protect license risk.
- Multi-state filings: SERFF (2024)
- Portals/APIs for agents and MGAs
- Underwriter training and feedback loops
- Compliant retention & cross-sell campaigns
Align cat models, leverage ILS and cat bonds to target 12-15% ROE
Assess granular wind, hail and flood exposures, align deductibles/limits to vendor cat models and update underwriting as climate and codes change. Manage retention via quota‑share and XS programs, leveraging 2024 ILS capacity >$100B and ~ $20B cat bond market to target 12–15% ROE and CR <95%. Pre‑stage adjusters, use FNOL/imagery for rapid claims and track severity for subrogation.
| Metric | 2024 |
|---|---|
| ILS capacity | >$100B |
| Cat bonds issued | ~$20B |
| CPI | 3.4% |
| Target ROE | 12–15% |
Delivered as Displayed
Business Model Canvas
The Business Model Canvas you’re previewing for Heritage Insurance Holdings is the exact deliverable—not a mockup—and contains the same content, structure, and formatting you’ll receive after purchase. Upon ordering you’ll get the complete, editable file ready for presenting, editing, and sharing. No placeholders, no surprises—what you see is what you’ll download.











