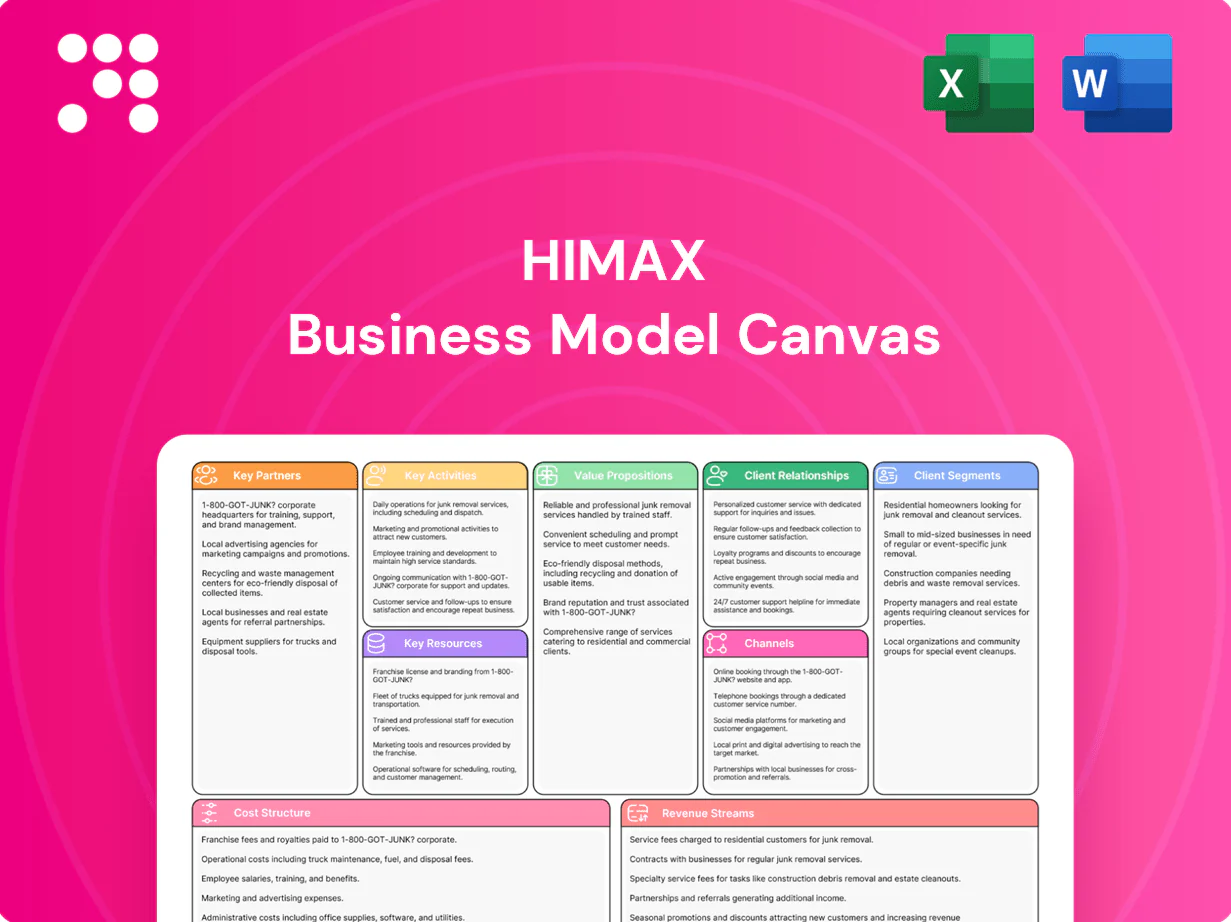
Himax Business Model Canvas

Business Model Canvas — Strategic blueprint for a leading semiconductor display company
Unlock the full strategic blueprint behind Himax with our Business Model Canvas—three to five concise pages of company-specific insights showing value propositions, key partners, revenue streams and cost drivers. Ideal for investors, consultants and founders seeking actionable analysis. Download the editable Word and Excel files to benchmark, adapt and scale with confidence.
Partnerships

Leading foundries and OSATs
Fabless execution depends on leading foundries and OSATs: TSMC held ~56% of global pure-play foundry revenue in 2023 and ramped advanced nodes in 2024, while the global OSAT market was about $36B in 2023. These partners provide node access, cost efficiency and yield scaling. Joint yield and packaging roadmaps cut ramp time and defects; multi-sourcing mitigates supply risk and secures allocation in upcycles.
Panel makers and module integrators
Himax (NASDAQ: HIMX) maintains close ties with LCD and OLED panel manufacturers to align driver specifications with panel roadmaps, ensuring early electrical and timing compatibility.
Early sample sharing and co-validation shorten time-to-mass-production, improve DPPM control, and enable predictable ramp schedules.
Long-term supply agreements secure capacity and tiered pricing, reducing supply risk and supporting joint roadmap investments.

OEM/ODM and Tier-1 automotive
Partnerships with device OEMs/ODMs and Tier-1 automotive suppliers secure design-ins by aligning Himax sensor and display modules to joint requirements that set feature sets, functional-safety targets and 5–10 year lifecycle support.
PPAP submissions and AEC-Q qualification drive quality assurance and traceability for vehicle platforms, while multi-tier validation builds Tier-1 trust.
Program volume forecasts—commonly 100k+ units/year per platform—inform capacity planning, capital allocation and cost-down roadmaps.

SoC/IP ecosystem alliances
Ecosystem partners include application processors, GPU vendors and interface IP providers; Himax co-qualifies interoperability across MIPI, eDP, HDMI, LVDS and automotive links to streamline platform integration. Reference designs shorten customer integration cycles and joint marketing in 2024 expanded reach into new automotive and consumer platforms.
- MIPI Alliance members >350 (2024)
- Co-qualification: MIPI, eDP, HDMI, LVDS, automotive links
- Reference designs: lower integration friction
- Joint marketing: expanded platform reach
EDA, test, and materials suppliers
EDA toolchains from vendors like Synopsys and Cadence and advanced DFT/analog flows are critical enablers for Himax in 2024, improving yield and functional quality. Collaborative probe/test equipment programs lower test time and cost through joint test-plan development. Specialty materials partnerships enhance reliability under thermal and automotive conditions.
- EDA: advanced DFT & analog flows
- Test: co-developed probe/test programs
- Materials: thermal & automotive grade
Foundry and OSAT alliances cut ramp time and supply risk for 100k+ unit display programs
Himax relies on foundries/OSATs for node access and yield scale (TSMC ~56% pure‑play foundry revenue 2023; global OSAT ~$36B 2023), panel OEMs for driver alignment, and OEM/automotive partners for long lifecycle design‑ins and volume forecasts (100k+ units/yr). Co‑validation, reference designs and joint test/EDA programs cut ramp time and cost and mitigate supply risk.
| Partner Type | Key Metric (2023/2024) | Role |
|---|---|---|
| Foundries | TSMC ~56% (2023) | Node access, capacity |
| OSAT | $36B market (2023) | Packaging/yield |
| Panel OEMs | LCD/OLED alignments (2024) | Driver co‑spec |
| OEMs/Automotive | 100k+ units/yr programs | Design‑ins, lifecycle |
| Ecosystem | MIPI members >350 (2024) | Interface co‑qual |
What is included in the product
 Detailed Word Document
A comprehensive Business Model Canvas for Himax covering the 9 classic blocks—customer segments, value propositions, channels, customer relationships, revenue streams, key resources, key activities, key partners, and cost structure—aligned with real-world operations and strategic plans. Includes SWOT-linked insights and competitive advantages, ideal for investor presentations and strategic decision-making.

 Customizable Excel Spreadsheet
High-level view of Himax’s business model with editable cells, condensing semiconductor strategy into a digestible one-page snapshot—perfect for boardrooms, rapid comparison, and collaborative adaptation, saving hours of formatting and structuring your own model.
Activities

Mixed-signal IC design and verification
Mixed-signal IC design and verification focuses on display drivers, timing controllers, PMICs and video processors, co-optimizing analog front-ends, high-voltage drivers and digital logic; rigorous simulation, characterization and DFT sustain yield and performance, while silicon bring-up and ECO loops de-risk ramps—Himax reported 2024 revenue of $1.05B, supporting continued R&D and production scale.
System firmware and algorithms
Tuning of gamma, color, HDR and power‑saving algorithms elevates perceived visual quality and efficiency; firmware enables panel compensation, dimming and motion processing to meet OEM QC targets. Field updates in 2024 continue to deliver new features and issue resolution, while toolchains let OEMs co‑tune for device‑specific performance.

Customer co-development and FAEs
Himax FAE teams provide schematic review, signal-integrity and thermal-design support, accelerating customer co-development and reducing qualification failures. Joint EVK and reference designs shorten prototype cycles and can cut time-to-market by up to 30%. Onsite and remote debugging reduce launch risk and post-launch costs. Design-win tracking drives forecasting accuracy and lifecycle management across product portfolios.

Quality, reliability, and compliance
Automotive AEC-Q100, PPAP (levels 1–5) and ISO 26262-aligned functional safety processes are executed across Himax production lines; HTOL, HAST and ESD programs validate robustness. SPC and end-to-end traceability track DPPM targets (industry benchmark <1000) across sites. Continuous improvement programs lowered RMA frequency and warranty spend through targeted corrective actions in 2024.
- AEA-Q100: full automotive qualification
- PPAP: levels 1–5 implemented
- Stress tests: HTOL, HAST, ESD
- SPC+traceability: DPPM target <1000
- CI: reduced RMA/warranty in 2024
Supply chain and cost optimization
Supply chain and cost optimization align wafer starts, packaging slots and logistics to demand, reducing lead times and protecting launches and seasonal peaks with inventory buffers.
Yield learning and test-time reduction lower COGS while multi-sourcing and die shrinks raise gross margins; Himax reported FY2023 revenue of 1.02 billion USD.
- Wafer starts aligned to demand
- Packaging slots & logistics balanced
- Yield & test-time reductions cut COGS
- Multi-sourcing and die shrinks improve margins
- Inventory buffers secure launches/peaks
Mixed-signal IC de-risking: $1.05B, -30% TTM, DPPM 1000
Mixed-signal IC design, verification and silicon bring-up de-risk ramps and sustain performance, funded by 2024 revenue of $1.05B. Firmware tuning, HDR/gamma and FAE co-development accelerate OEM wins and cut time-to-market by up to 30%. AEC-Q100/PPAP, SPC and yield/test reductions lower COGS and DPPM targets (<1000); FY2023 revenue was $1.02B.
| Metric | 2023 | 2024 |
|---|---|---|
| Revenue | $1.02B | $1.05B |
| Time-to-market | — | -30% |
| DPPM target | <1000 | <1000 |
What You See Is What You Get
Business Model Canvas
The document you're previewing is the actual Himax Business Model Canvas—not a mockup or sample. When you purchase, you'll receive this exact, fully editable file with all content and pages included, ready to download in Word and Excel formats for immediate use.

Business Model Canvas — Strategic blueprint for a leading semiconductor display company
Unlock the full strategic blueprint behind Himax with our Business Model Canvas—three to five concise pages of company-specific insights showing value propositions, key partners, revenue streams and cost drivers. Ideal for investors, consultants and founders seeking actionable analysis. Download the editable Word and Excel files to benchmark, adapt and scale with confidence.
Partnerships
Leading foundries and OSATs
Fabless execution depends on leading foundries and OSATs: TSMC held ~56% of global pure-play foundry revenue in 2023 and ramped advanced nodes in 2024, while the global OSAT market was about $36B in 2023. These partners provide node access, cost efficiency and yield scaling. Joint yield and packaging roadmaps cut ramp time and defects; multi-sourcing mitigates supply risk and secures allocation in upcycles.
Panel makers and module integrators
Himax (NASDAQ: HIMX) maintains close ties with LCD and OLED panel manufacturers to align driver specifications with panel roadmaps, ensuring early electrical and timing compatibility.
Early sample sharing and co-validation shorten time-to-mass-production, improve DPPM control, and enable predictable ramp schedules.
Long-term supply agreements secure capacity and tiered pricing, reducing supply risk and supporting joint roadmap investments.
OEM/ODM and Tier-1 automotive
Partnerships with device OEMs/ODMs and Tier-1 automotive suppliers secure design-ins by aligning Himax sensor and display modules to joint requirements that set feature sets, functional-safety targets and 5–10 year lifecycle support.
PPAP submissions and AEC-Q qualification drive quality assurance and traceability for vehicle platforms, while multi-tier validation builds Tier-1 trust.
Program volume forecasts—commonly 100k+ units/year per platform—inform capacity planning, capital allocation and cost-down roadmaps.
SoC/IP ecosystem alliances
Ecosystem partners include application processors, GPU vendors and interface IP providers; Himax co-qualifies interoperability across MIPI, eDP, HDMI, LVDS and automotive links to streamline platform integration. Reference designs shorten customer integration cycles and joint marketing in 2024 expanded reach into new automotive and consumer platforms.
- MIPI Alliance members >350 (2024)
- Co-qualification: MIPI, eDP, HDMI, LVDS, automotive links
- Reference designs: lower integration friction
- Joint marketing: expanded platform reach
EDA, test, and materials suppliers
EDA toolchains from vendors like Synopsys and Cadence and advanced DFT/analog flows are critical enablers for Himax in 2024, improving yield and functional quality. Collaborative probe/test equipment programs lower test time and cost through joint test-plan development. Specialty materials partnerships enhance reliability under thermal and automotive conditions.
- EDA: advanced DFT & analog flows
- Test: co-developed probe/test programs
- Materials: thermal & automotive grade
Foundry and OSAT alliances cut ramp time and supply risk for 100k+ unit display programs
Himax relies on foundries/OSATs for node access and yield scale (TSMC ~56% pure‑play foundry revenue 2023; global OSAT ~$36B 2023), panel OEMs for driver alignment, and OEM/automotive partners for long lifecycle design‑ins and volume forecasts (100k+ units/yr). Co‑validation, reference designs and joint test/EDA programs cut ramp time and cost and mitigate supply risk.
| Partner Type | Key Metric (2023/2024) | Role |
|---|---|---|
| Foundries | TSMC ~56% (2023) | Node access, capacity |
| OSAT | $36B market (2023) | Packaging/yield |
| Panel OEMs | LCD/OLED alignments (2024) | Driver co‑spec |
| OEMs/Automotive | 100k+ units/yr programs | Design‑ins, lifecycle |
| Ecosystem | MIPI members >350 (2024) | Interface co‑qual |
What is included in the product
Detailed Word Document
A comprehensive Business Model Canvas for Himax covering the 9 classic blocks—customer segments, value propositions, channels, customer relationships, revenue streams, key resources, key activities, key partners, and cost structure—aligned with real-world operations and strategic plans. Includes SWOT-linked insights and competitive advantages, ideal for investor presentations and strategic decision-making.
Customizable Excel Spreadsheet
High-level view of Himax’s business model with editable cells, condensing semiconductor strategy into a digestible one-page snapshot—perfect for boardrooms, rapid comparison, and collaborative adaptation, saving hours of formatting and structuring your own model.
Activities
Mixed-signal IC design and verification
Mixed-signal IC design and verification focuses on display drivers, timing controllers, PMICs and video processors, co-optimizing analog front-ends, high-voltage drivers and digital logic; rigorous simulation, characterization and DFT sustain yield and performance, while silicon bring-up and ECO loops de-risk ramps—Himax reported 2024 revenue of $1.05B, supporting continued R&D and production scale.
System firmware and algorithms
Tuning of gamma, color, HDR and power‑saving algorithms elevates perceived visual quality and efficiency; firmware enables panel compensation, dimming and motion processing to meet OEM QC targets. Field updates in 2024 continue to deliver new features and issue resolution, while toolchains let OEMs co‑tune for device‑specific performance.
Customer co-development and FAEs
Himax FAE teams provide schematic review, signal-integrity and thermal-design support, accelerating customer co-development and reducing qualification failures. Joint EVK and reference designs shorten prototype cycles and can cut time-to-market by up to 30%. Onsite and remote debugging reduce launch risk and post-launch costs. Design-win tracking drives forecasting accuracy and lifecycle management across product portfolios.
Quality, reliability, and compliance
Automotive AEC-Q100, PPAP (levels 1–5) and ISO 26262-aligned functional safety processes are executed across Himax production lines; HTOL, HAST and ESD programs validate robustness. SPC and end-to-end traceability track DPPM targets (industry benchmark <1000) across sites. Continuous improvement programs lowered RMA frequency and warranty spend through targeted corrective actions in 2024.
- AEA-Q100: full automotive qualification
- PPAP: levels 1–5 implemented
- Stress tests: HTOL, HAST, ESD
- SPC+traceability: DPPM target <1000
- CI: reduced RMA/warranty in 2024
Supply chain and cost optimization
Supply chain and cost optimization align wafer starts, packaging slots and logistics to demand, reducing lead times and protecting launches and seasonal peaks with inventory buffers.
Yield learning and test-time reduction lower COGS while multi-sourcing and die shrinks raise gross margins; Himax reported FY2023 revenue of 1.02 billion USD.
- Wafer starts aligned to demand
- Packaging slots & logistics balanced
- Yield & test-time reductions cut COGS
- Multi-sourcing and die shrinks improve margins
- Inventory buffers secure launches/peaks
Mixed-signal IC de-risking: $1.05B, -30% TTM, DPPM 1000
Mixed-signal IC design, verification and silicon bring-up de-risk ramps and sustain performance, funded by 2024 revenue of $1.05B. Firmware tuning, HDR/gamma and FAE co-development accelerate OEM wins and cut time-to-market by up to 30%. AEC-Q100/PPAP, SPC and yield/test reductions lower COGS and DPPM targets (<1000); FY2023 revenue was $1.02B.
| Metric | 2023 | 2024 |
|---|---|---|
| Revenue | $1.02B | $1.05B |
| Time-to-market | — | -30% |
| DPPM target | <1000 | <1000 |
What You See Is What You Get
Business Model Canvas
The document you're previewing is the actual Himax Business Model Canvas—not a mockup or sample. When you purchase, you'll receive this exact, fully editable file with all content and pages included, ready to download in Word and Excel formats for immediate use.
Original: $10.00
-65%$10.00
$3.50Description
Business Model Canvas — Strategic blueprint for a leading semiconductor display company
Unlock the full strategic blueprint behind Himax with our Business Model Canvas—three to five concise pages of company-specific insights showing value propositions, key partners, revenue streams and cost drivers. Ideal for investors, consultants and founders seeking actionable analysis. Download the editable Word and Excel files to benchmark, adapt and scale with confidence.
Partnerships
Leading foundries and OSATs
Fabless execution depends on leading foundries and OSATs: TSMC held ~56% of global pure-play foundry revenue in 2023 and ramped advanced nodes in 2024, while the global OSAT market was about $36B in 2023. These partners provide node access, cost efficiency and yield scaling. Joint yield and packaging roadmaps cut ramp time and defects; multi-sourcing mitigates supply risk and secures allocation in upcycles.
Panel makers and module integrators
Himax (NASDAQ: HIMX) maintains close ties with LCD and OLED panel manufacturers to align driver specifications with panel roadmaps, ensuring early electrical and timing compatibility.
Early sample sharing and co-validation shorten time-to-mass-production, improve DPPM control, and enable predictable ramp schedules.
Long-term supply agreements secure capacity and tiered pricing, reducing supply risk and supporting joint roadmap investments.
OEM/ODM and Tier-1 automotive
Partnerships with device OEMs/ODMs and Tier-1 automotive suppliers secure design-ins by aligning Himax sensor and display modules to joint requirements that set feature sets, functional-safety targets and 5–10 year lifecycle support.
PPAP submissions and AEC-Q qualification drive quality assurance and traceability for vehicle platforms, while multi-tier validation builds Tier-1 trust.
Program volume forecasts—commonly 100k+ units/year per platform—inform capacity planning, capital allocation and cost-down roadmaps.
SoC/IP ecosystem alliances
Ecosystem partners include application processors, GPU vendors and interface IP providers; Himax co-qualifies interoperability across MIPI, eDP, HDMI, LVDS and automotive links to streamline platform integration. Reference designs shorten customer integration cycles and joint marketing in 2024 expanded reach into new automotive and consumer platforms.
- MIPI Alliance members >350 (2024)
- Co-qualification: MIPI, eDP, HDMI, LVDS, automotive links
- Reference designs: lower integration friction
- Joint marketing: expanded platform reach
EDA, test, and materials suppliers
EDA toolchains from vendors like Synopsys and Cadence and advanced DFT/analog flows are critical enablers for Himax in 2024, improving yield and functional quality. Collaborative probe/test equipment programs lower test time and cost through joint test-plan development. Specialty materials partnerships enhance reliability under thermal and automotive conditions.
- EDA: advanced DFT & analog flows
- Test: co-developed probe/test programs
- Materials: thermal & automotive grade
Foundry and OSAT alliances cut ramp time and supply risk for 100k+ unit display programs
Himax relies on foundries/OSATs for node access and yield scale (TSMC ~56% pure‑play foundry revenue 2023; global OSAT ~$36B 2023), panel OEMs for driver alignment, and OEM/automotive partners for long lifecycle design‑ins and volume forecasts (100k+ units/yr). Co‑validation, reference designs and joint test/EDA programs cut ramp time and cost and mitigate supply risk.
| Partner Type | Key Metric (2023/2024) | Role |
|---|---|---|
| Foundries | TSMC ~56% (2023) | Node access, capacity |
| OSAT | $36B market (2023) | Packaging/yield |
| Panel OEMs | LCD/OLED alignments (2024) | Driver co‑spec |
| OEMs/Automotive | 100k+ units/yr programs | Design‑ins, lifecycle |
| Ecosystem | MIPI members >350 (2024) | Interface co‑qual |
What is included in the product
Detailed Word Document
A comprehensive Business Model Canvas for Himax covering the 9 classic blocks—customer segments, value propositions, channels, customer relationships, revenue streams, key resources, key activities, key partners, and cost structure—aligned with real-world operations and strategic plans. Includes SWOT-linked insights and competitive advantages, ideal for investor presentations and strategic decision-making.
Customizable Excel Spreadsheet
High-level view of Himax’s business model with editable cells, condensing semiconductor strategy into a digestible one-page snapshot—perfect for boardrooms, rapid comparison, and collaborative adaptation, saving hours of formatting and structuring your own model.
Activities
Mixed-signal IC design and verification
Mixed-signal IC design and verification focuses on display drivers, timing controllers, PMICs and video processors, co-optimizing analog front-ends, high-voltage drivers and digital logic; rigorous simulation, characterization and DFT sustain yield and performance, while silicon bring-up and ECO loops de-risk ramps—Himax reported 2024 revenue of $1.05B, supporting continued R&D and production scale.
System firmware and algorithms
Tuning of gamma, color, HDR and power‑saving algorithms elevates perceived visual quality and efficiency; firmware enables panel compensation, dimming and motion processing to meet OEM QC targets. Field updates in 2024 continue to deliver new features and issue resolution, while toolchains let OEMs co‑tune for device‑specific performance.
Customer co-development and FAEs
Himax FAE teams provide schematic review, signal-integrity and thermal-design support, accelerating customer co-development and reducing qualification failures. Joint EVK and reference designs shorten prototype cycles and can cut time-to-market by up to 30%. Onsite and remote debugging reduce launch risk and post-launch costs. Design-win tracking drives forecasting accuracy and lifecycle management across product portfolios.
Quality, reliability, and compliance
Automotive AEC-Q100, PPAP (levels 1–5) and ISO 26262-aligned functional safety processes are executed across Himax production lines; HTOL, HAST and ESD programs validate robustness. SPC and end-to-end traceability track DPPM targets (industry benchmark <1000) across sites. Continuous improvement programs lowered RMA frequency and warranty spend through targeted corrective actions in 2024.
- AEA-Q100: full automotive qualification
- PPAP: levels 1–5 implemented
- Stress tests: HTOL, HAST, ESD
- SPC+traceability: DPPM target <1000
- CI: reduced RMA/warranty in 2024
Supply chain and cost optimization
Supply chain and cost optimization align wafer starts, packaging slots and logistics to demand, reducing lead times and protecting launches and seasonal peaks with inventory buffers.
Yield learning and test-time reduction lower COGS while multi-sourcing and die shrinks raise gross margins; Himax reported FY2023 revenue of 1.02 billion USD.
- Wafer starts aligned to demand
- Packaging slots & logistics balanced
- Yield & test-time reductions cut COGS
- Multi-sourcing and die shrinks improve margins
- Inventory buffers secure launches/peaks
Mixed-signal IC de-risking: $1.05B, -30% TTM, DPPM 1000
Mixed-signal IC design, verification and silicon bring-up de-risk ramps and sustain performance, funded by 2024 revenue of $1.05B. Firmware tuning, HDR/gamma and FAE co-development accelerate OEM wins and cut time-to-market by up to 30%. AEC-Q100/PPAP, SPC and yield/test reductions lower COGS and DPPM targets (<1000); FY2023 revenue was $1.02B.
| Metric | 2023 | 2024 |
|---|---|---|
| Revenue | $1.02B | $1.05B |
| Time-to-market | — | -30% |
| DPPM target | <1000 | <1000 |
What You See Is What You Get
Business Model Canvas
The document you're previewing is the actual Himax Business Model Canvas—not a mockup or sample. When you purchase, you'll receive this exact, fully editable file with all content and pages included, ready to download in Word and Excel formats for immediate use.











