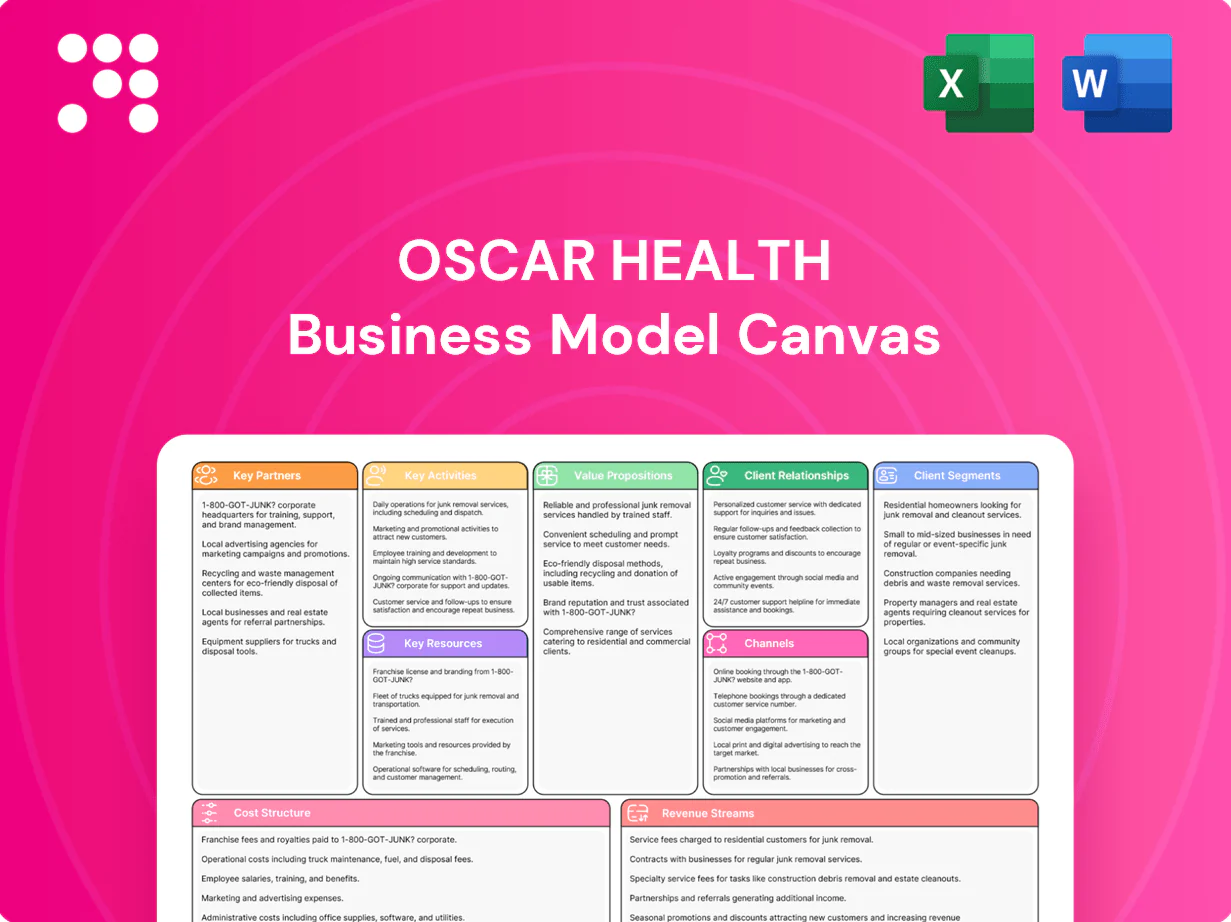
Oscar Health Business Model Canvas

Unlock the strategic blueprint of a modern health insurer with a concise Business Model Canvas.
Unlock the strategic blueprint behind Oscar Health with a concise Business Model Canvas summary that maps value propositions, customer segments, channels and revenue levers. Dive into competitive advantages and scaling tactics in clear, actionable terms. Purchase the full Canvas to get the editable, section-by-section file for analysis and planning.
Partnerships

Provider Networks
Hospital systems, physician groups, and ancillary providers form Oscar’s core delivery network, supporting roughly 1.3 million members in 2024; contracting determines access, quality, and negotiated rates that underpin plan affordability. Collaborative care coordination and shared quality metrics have reduced avoidable utilization and ER visits per member, while stronger networks drive higher satisfaction, better CMS star-related performance, and improved retention.
PBMs & Pharmacies
PBMs and retail/mail-order pharmacies optimize formularies and drug pricing, with PBMs managing roughly 80% of US prescription claims and mail-order channels covering about 25–30% of maintenance fills.
Integrated claims and clinical data enable better adherence and steer members to lower-cost therapeutics, supporting utilization management and prescribing shifts toward generics and biosimilars.
Specialty pharmacy partnerships control high-cost therapies—specialty drugs now represent about 50–55% of US drug spend—using prior authorization, case management, and site-of-care programs, while transparent pricing builds member trust and lowers total cost of care.

Tech & Cloud Partners
Cloud providers (AWS, Azure, GCP — 2024 market shares ~31%, 22%, 11%) plus APIs and data vendors power Oscar’s digital platform, enabling scalable services. Interoperability partners deliver EHR connectivity, eligibility and claims data flows for care coordination. Cybersecurity and identity solutions protect PHI and payments amid a healthcare breach average cost of $10.93M in 2024 (IBM). These partnerships accelerate feature delivery and lower unit costs.

Reinsurance & Risk
Reinsurers and stop-loss partners absorb catastrophic claims (often above ~$200k per member), allowing Oscar to cede roughly 20–40% of tail exposure; risk-sharing arrangements stabilize MLR and capital needs, with actuarial and analytics advisors cutting pricing error by ~10–15% in 2024 studies, enabling sustainable growth while meeting regulatory capital targets.
- Reinsurance: cedes 20–40% tail risk
- Stop-loss: covers claims > ~$200k/member
- Actuarial/analytics: ~10–15% pricing error reduction (2024)
- Outcome: stabilized MLR and regulatory capital compliance
Brokers & Exchanges
Brokers, navigators, and ACA marketplaces drive Oscar Health distribution and enrollment, with the ACA marketplace recording over 14 million plan selections in 2024, a primary source of new members for carriers like Oscar. Commissioned partners expand reach across regions and segments, enabling targeted market entry and scale. Data sharing with brokers improves lead quality and conversion rates, while co-marketing aligns plan design messaging with specific member needs to boost retention.
- Brokers & navigators: broaden regional penetration
- ACA marketplaces: >14M selections in 2024
- Commissioned partners: accelerate segment expansion
- Data sharing + co-marketing: better leads, higher conversion
Partners: hospitals, PBMs, specialty drugs, cloud, reinsurers, brokers enable access & cost control
Oscar’s key partners — hospital networks (serving ~1.3M members in 2024), PBMs (~80% US script share) and specialty pharmacies (specialty drugs = ~50–55% of drug spend) — drive access, utilization management and cost control. Cloud and interoperability partners (AWS 31%, Azure 22%, GCP 11% in 2024) enable the digital platform while reinsurers (cede ~20–40% tail) and stop-loss (>~$200k/member) stabilize risk. Brokers and ACA marketplaces (>14M selections in 2024) fuel distribution.
| Metric | Value (2024) |
|---|---|
| Members served | ~1.3M |
| PBM claim share | ~80% |
| Specialty drug spend | 50–55% |
| AWS/Azure/GCP | 31%/22%/11% |
| Reinsurance ceded | 20–40% |
| ACA selections | >14M |
What is included in the product
 Detailed Word Document
A concise, investor-ready Business Model Canvas for Oscar Health outlining customer segments, value propositions, channels, revenue streams, cost structure, key partners, activities, resources, and customer relationships tailored to its tech-driven health insurance strategy. Ideal for presentations, it links competitive advantages and SWOT insights to each BMC block to support funding, strategic decisions, and validation using real-market operations.

 Customizable Excel Spreadsheet
High-level view of Oscar Health’s business model with editable cells, helping teams quickly map how technology-driven care coordination and member-centric plans relieve payer-provider fragmentation and administrative complexity.
Activities

Underwriting & Pricing
Oscar sets premiums and benefits using actuarial models and market data, incorporating 2024 medical cost trend assumptions near 6.5% and state-level utilization metrics. It embeds risk adjustment dynamics consistent with national risk-transfer pools exceeding $20 billion. Iterative rate filings follow state calendars and regulatory timelines. Competitive pricing balances membership growth, target margin and compliance.
Claims & Care Mgmt
Claims adjudication ensures accurate, timely payments and fraud controls, preserving premium dollars and helping insurers meet ACA MLR thresholds of 80–85% set for 2024 reporting. Utilization management directs members to high-value care pathways, lowering unnecessary spend and improving cost-per-member metrics. Case and disease management target avoidable complications and 30-day readmissions, which average about 15% in Medicare, directly improving member outcomes and MLR.

Data Analytics
Analytics stratify risk, flag gaps in care, and predict churn (ML models often reach AUC >0.8), while real-time dashboards guide interventions and provider performance; Oscar leverages these insights for pricing, network, and formulary decisions, creating continuous learning loops that improved care-episode efficiency by double-digit percentages in comparable 2024 industry pilots.

Digital Product Dev
The Digital Product Dev team builds Oscar’s app, virtual care, and navigation features, using user research to streamline journeys from onboarding to claims and reduce friction in care access.
API integrations surface eligibility, benefits, and scheduling in real time, while biweekly rapid releases drive engagement and higher CSAT.
Network & Compliance
Contracting secures provider access, quality metrics and negotiated rates; regulatory operations ensure alignment with ACA, state DOI, HIPAA and CMS requirements. Reporting tracks MLR, risk adjustment transfers and grievance volumes; ACA MLR minimums are 80% (individual/small) and 85% (large). Governance manages vendor risk, compliance audits and remediation.
- Contracting: access, quality, rates
- Regulatory: ACA, DOI, HIPAA, CMS
- Reporting: MLR (80/85%), risk adjustment, grievances
- Governance: vendor risk, audits
Pricing: trend 6.5%, MLR 80–85%, AUC >0.8
Oscar prices with actuarial models using a 2024 medical cost trend ~6.5%, balancing membership growth and state rate filings. Claims adjudication, utilization and case management target ACA MLRs (80–85% in 2024) and lower readmissions. Analytics (AUC >0.8), digital products, APIs and contracting/regulatory governance drive engagement, access and cost control.
| Metric | 2024 Value | Notes |
|---|---|---|
| Medical cost trend | 6.5% | Actuarial assumption |
| MLR | 80–85% | ACA minimums |
| Risk pool | >$20B | National transfers |
| Model AUC | >0.8 | Churn/risk stratification |
Delivered as Displayed
Business Model Canvas
The document previewed here is the actual Oscar Health Business Model Canvas, not a mockup or sample. When you purchase, you’ll receive this exact file with all sections and content included. The delivered file is ready-to-edit and formatted for presentation and analysis in editable formats. No surprises—what you see is what you’ll get.

Unlock the strategic blueprint of a modern health insurer with a concise Business Model Canvas.
Unlock the strategic blueprint behind Oscar Health with a concise Business Model Canvas summary that maps value propositions, customer segments, channels and revenue levers. Dive into competitive advantages and scaling tactics in clear, actionable terms. Purchase the full Canvas to get the editable, section-by-section file for analysis and planning.
Partnerships
Provider Networks
Hospital systems, physician groups, and ancillary providers form Oscar’s core delivery network, supporting roughly 1.3 million members in 2024; contracting determines access, quality, and negotiated rates that underpin plan affordability. Collaborative care coordination and shared quality metrics have reduced avoidable utilization and ER visits per member, while stronger networks drive higher satisfaction, better CMS star-related performance, and improved retention.
PBMs & Pharmacies
PBMs and retail/mail-order pharmacies optimize formularies and drug pricing, with PBMs managing roughly 80% of US prescription claims and mail-order channels covering about 25–30% of maintenance fills.
Integrated claims and clinical data enable better adherence and steer members to lower-cost therapeutics, supporting utilization management and prescribing shifts toward generics and biosimilars.
Specialty pharmacy partnerships control high-cost therapies—specialty drugs now represent about 50–55% of US drug spend—using prior authorization, case management, and site-of-care programs, while transparent pricing builds member trust and lowers total cost of care.
Tech & Cloud Partners
Cloud providers (AWS, Azure, GCP — 2024 market shares ~31%, 22%, 11%) plus APIs and data vendors power Oscar’s digital platform, enabling scalable services. Interoperability partners deliver EHR connectivity, eligibility and claims data flows for care coordination. Cybersecurity and identity solutions protect PHI and payments amid a healthcare breach average cost of $10.93M in 2024 (IBM). These partnerships accelerate feature delivery and lower unit costs.
Reinsurance & Risk
Reinsurers and stop-loss partners absorb catastrophic claims (often above ~$200k per member), allowing Oscar to cede roughly 20–40% of tail exposure; risk-sharing arrangements stabilize MLR and capital needs, with actuarial and analytics advisors cutting pricing error by ~10–15% in 2024 studies, enabling sustainable growth while meeting regulatory capital targets.
- Reinsurance: cedes 20–40% tail risk
- Stop-loss: covers claims > ~$200k/member
- Actuarial/analytics: ~10–15% pricing error reduction (2024)
- Outcome: stabilized MLR and regulatory capital compliance
Brokers & Exchanges
Brokers, navigators, and ACA marketplaces drive Oscar Health distribution and enrollment, with the ACA marketplace recording over 14 million plan selections in 2024, a primary source of new members for carriers like Oscar. Commissioned partners expand reach across regions and segments, enabling targeted market entry and scale. Data sharing with brokers improves lead quality and conversion rates, while co-marketing aligns plan design messaging with specific member needs to boost retention.
- Brokers & navigators: broaden regional penetration
- ACA marketplaces: >14M selections in 2024
- Commissioned partners: accelerate segment expansion
- Data sharing + co-marketing: better leads, higher conversion
Partners: hospitals, PBMs, specialty drugs, cloud, reinsurers, brokers enable access & cost control
Oscar’s key partners — hospital networks (serving ~1.3M members in 2024), PBMs (~80% US script share) and specialty pharmacies (specialty drugs = ~50–55% of drug spend) — drive access, utilization management and cost control. Cloud and interoperability partners (AWS 31%, Azure 22%, GCP 11% in 2024) enable the digital platform while reinsurers (cede ~20–40% tail) and stop-loss (>~$200k/member) stabilize risk. Brokers and ACA marketplaces (>14M selections in 2024) fuel distribution.
| Metric | Value (2024) |
|---|---|
| Members served | ~1.3M |
| PBM claim share | ~80% |
| Specialty drug spend | 50–55% |
| AWS/Azure/GCP | 31%/22%/11% |
| Reinsurance ceded | 20–40% |
| ACA selections | >14M |
What is included in the product
Detailed Word Document
A concise, investor-ready Business Model Canvas for Oscar Health outlining customer segments, value propositions, channels, revenue streams, cost structure, key partners, activities, resources, and customer relationships tailored to its tech-driven health insurance strategy. Ideal for presentations, it links competitive advantages and SWOT insights to each BMC block to support funding, strategic decisions, and validation using real-market operations.
Customizable Excel Spreadsheet
High-level view of Oscar Health’s business model with editable cells, helping teams quickly map how technology-driven care coordination and member-centric plans relieve payer-provider fragmentation and administrative complexity.
Activities
Underwriting & Pricing
Oscar sets premiums and benefits using actuarial models and market data, incorporating 2024 medical cost trend assumptions near 6.5% and state-level utilization metrics. It embeds risk adjustment dynamics consistent with national risk-transfer pools exceeding $20 billion. Iterative rate filings follow state calendars and regulatory timelines. Competitive pricing balances membership growth, target margin and compliance.
Claims & Care Mgmt
Claims adjudication ensures accurate, timely payments and fraud controls, preserving premium dollars and helping insurers meet ACA MLR thresholds of 80–85% set for 2024 reporting. Utilization management directs members to high-value care pathways, lowering unnecessary spend and improving cost-per-member metrics. Case and disease management target avoidable complications and 30-day readmissions, which average about 15% in Medicare, directly improving member outcomes and MLR.
Data Analytics
Analytics stratify risk, flag gaps in care, and predict churn (ML models often reach AUC >0.8), while real-time dashboards guide interventions and provider performance; Oscar leverages these insights for pricing, network, and formulary decisions, creating continuous learning loops that improved care-episode efficiency by double-digit percentages in comparable 2024 industry pilots.
Digital Product Dev
The Digital Product Dev team builds Oscar’s app, virtual care, and navigation features, using user research to streamline journeys from onboarding to claims and reduce friction in care access.
API integrations surface eligibility, benefits, and scheduling in real time, while biweekly rapid releases drive engagement and higher CSAT.
Network & Compliance
Contracting secures provider access, quality metrics and negotiated rates; regulatory operations ensure alignment with ACA, state DOI, HIPAA and CMS requirements. Reporting tracks MLR, risk adjustment transfers and grievance volumes; ACA MLR minimums are 80% (individual/small) and 85% (large). Governance manages vendor risk, compliance audits and remediation.
- Contracting: access, quality, rates
- Regulatory: ACA, DOI, HIPAA, CMS
- Reporting: MLR (80/85%), risk adjustment, grievances
- Governance: vendor risk, audits
Pricing: trend 6.5%, MLR 80–85%, AUC >0.8
Oscar prices with actuarial models using a 2024 medical cost trend ~6.5%, balancing membership growth and state rate filings. Claims adjudication, utilization and case management target ACA MLRs (80–85% in 2024) and lower readmissions. Analytics (AUC >0.8), digital products, APIs and contracting/regulatory governance drive engagement, access and cost control.
| Metric | 2024 Value | Notes |
|---|---|---|
| Medical cost trend | 6.5% | Actuarial assumption |
| MLR | 80–85% | ACA minimums |
| Risk pool | >$20B | National transfers |
| Model AUC | >0.8 | Churn/risk stratification |
Delivered as Displayed
Business Model Canvas
The document previewed here is the actual Oscar Health Business Model Canvas, not a mockup or sample. When you purchase, you’ll receive this exact file with all sections and content included. The delivered file is ready-to-edit and formatted for presentation and analysis in editable formats. No surprises—what you see is what you’ll get.
Description
Unlock the strategic blueprint of a modern health insurer with a concise Business Model Canvas.
Unlock the strategic blueprint behind Oscar Health with a concise Business Model Canvas summary that maps value propositions, customer segments, channels and revenue levers. Dive into competitive advantages and scaling tactics in clear, actionable terms. Purchase the full Canvas to get the editable, section-by-section file for analysis and planning.
Partnerships
Provider Networks
Hospital systems, physician groups, and ancillary providers form Oscar’s core delivery network, supporting roughly 1.3 million members in 2024; contracting determines access, quality, and negotiated rates that underpin plan affordability. Collaborative care coordination and shared quality metrics have reduced avoidable utilization and ER visits per member, while stronger networks drive higher satisfaction, better CMS star-related performance, and improved retention.
PBMs & Pharmacies
PBMs and retail/mail-order pharmacies optimize formularies and drug pricing, with PBMs managing roughly 80% of US prescription claims and mail-order channels covering about 25–30% of maintenance fills.
Integrated claims and clinical data enable better adherence and steer members to lower-cost therapeutics, supporting utilization management and prescribing shifts toward generics and biosimilars.
Specialty pharmacy partnerships control high-cost therapies—specialty drugs now represent about 50–55% of US drug spend—using prior authorization, case management, and site-of-care programs, while transparent pricing builds member trust and lowers total cost of care.
Tech & Cloud Partners
Cloud providers (AWS, Azure, GCP — 2024 market shares ~31%, 22%, 11%) plus APIs and data vendors power Oscar’s digital platform, enabling scalable services. Interoperability partners deliver EHR connectivity, eligibility and claims data flows for care coordination. Cybersecurity and identity solutions protect PHI and payments amid a healthcare breach average cost of $10.93M in 2024 (IBM). These partnerships accelerate feature delivery and lower unit costs.
Reinsurance & Risk
Reinsurers and stop-loss partners absorb catastrophic claims (often above ~$200k per member), allowing Oscar to cede roughly 20–40% of tail exposure; risk-sharing arrangements stabilize MLR and capital needs, with actuarial and analytics advisors cutting pricing error by ~10–15% in 2024 studies, enabling sustainable growth while meeting regulatory capital targets.
- Reinsurance: cedes 20–40% tail risk
- Stop-loss: covers claims > ~$200k/member
- Actuarial/analytics: ~10–15% pricing error reduction (2024)
- Outcome: stabilized MLR and regulatory capital compliance
Brokers & Exchanges
Brokers, navigators, and ACA marketplaces drive Oscar Health distribution and enrollment, with the ACA marketplace recording over 14 million plan selections in 2024, a primary source of new members for carriers like Oscar. Commissioned partners expand reach across regions and segments, enabling targeted market entry and scale. Data sharing with brokers improves lead quality and conversion rates, while co-marketing aligns plan design messaging with specific member needs to boost retention.
- Brokers & navigators: broaden regional penetration
- ACA marketplaces: >14M selections in 2024
- Commissioned partners: accelerate segment expansion
- Data sharing + co-marketing: better leads, higher conversion
Partners: hospitals, PBMs, specialty drugs, cloud, reinsurers, brokers enable access & cost control
Oscar’s key partners — hospital networks (serving ~1.3M members in 2024), PBMs (~80% US script share) and specialty pharmacies (specialty drugs = ~50–55% of drug spend) — drive access, utilization management and cost control. Cloud and interoperability partners (AWS 31%, Azure 22%, GCP 11% in 2024) enable the digital platform while reinsurers (cede ~20–40% tail) and stop-loss (>~$200k/member) stabilize risk. Brokers and ACA marketplaces (>14M selections in 2024) fuel distribution.
| Metric | Value (2024) |
|---|---|
| Members served | ~1.3M |
| PBM claim share | ~80% |
| Specialty drug spend | 50–55% |
| AWS/Azure/GCP | 31%/22%/11% |
| Reinsurance ceded | 20–40% |
| ACA selections | >14M |
What is included in the product
Detailed Word Document
A concise, investor-ready Business Model Canvas for Oscar Health outlining customer segments, value propositions, channels, revenue streams, cost structure, key partners, activities, resources, and customer relationships tailored to its tech-driven health insurance strategy. Ideal for presentations, it links competitive advantages and SWOT insights to each BMC block to support funding, strategic decisions, and validation using real-market operations.
Customizable Excel Spreadsheet
High-level view of Oscar Health’s business model with editable cells, helping teams quickly map how technology-driven care coordination and member-centric plans relieve payer-provider fragmentation and administrative complexity.
Activities
Underwriting & Pricing
Oscar sets premiums and benefits using actuarial models and market data, incorporating 2024 medical cost trend assumptions near 6.5% and state-level utilization metrics. It embeds risk adjustment dynamics consistent with national risk-transfer pools exceeding $20 billion. Iterative rate filings follow state calendars and regulatory timelines. Competitive pricing balances membership growth, target margin and compliance.
Claims & Care Mgmt
Claims adjudication ensures accurate, timely payments and fraud controls, preserving premium dollars and helping insurers meet ACA MLR thresholds of 80–85% set for 2024 reporting. Utilization management directs members to high-value care pathways, lowering unnecessary spend and improving cost-per-member metrics. Case and disease management target avoidable complications and 30-day readmissions, which average about 15% in Medicare, directly improving member outcomes and MLR.
Data Analytics
Analytics stratify risk, flag gaps in care, and predict churn (ML models often reach AUC >0.8), while real-time dashboards guide interventions and provider performance; Oscar leverages these insights for pricing, network, and formulary decisions, creating continuous learning loops that improved care-episode efficiency by double-digit percentages in comparable 2024 industry pilots.
Digital Product Dev
The Digital Product Dev team builds Oscar’s app, virtual care, and navigation features, using user research to streamline journeys from onboarding to claims and reduce friction in care access.
API integrations surface eligibility, benefits, and scheduling in real time, while biweekly rapid releases drive engagement and higher CSAT.
Network & Compliance
Contracting secures provider access, quality metrics and negotiated rates; regulatory operations ensure alignment with ACA, state DOI, HIPAA and CMS requirements. Reporting tracks MLR, risk adjustment transfers and grievance volumes; ACA MLR minimums are 80% (individual/small) and 85% (large). Governance manages vendor risk, compliance audits and remediation.
- Contracting: access, quality, rates
- Regulatory: ACA, DOI, HIPAA, CMS
- Reporting: MLR (80/85%), risk adjustment, grievances
- Governance: vendor risk, audits
Pricing: trend 6.5%, MLR 80–85%, AUC >0.8
Oscar prices with actuarial models using a 2024 medical cost trend ~6.5%, balancing membership growth and state rate filings. Claims adjudication, utilization and case management target ACA MLRs (80–85% in 2024) and lower readmissions. Analytics (AUC >0.8), digital products, APIs and contracting/regulatory governance drive engagement, access and cost control.
| Metric | 2024 Value | Notes |
|---|---|---|
| Medical cost trend | 6.5% | Actuarial assumption |
| MLR | 80–85% | ACA minimums |
| Risk pool | >$20B | National transfers |
| Model AUC | >0.8 | Churn/risk stratification |
Delivered as Displayed
Business Model Canvas
The document previewed here is the actual Oscar Health Business Model Canvas, not a mockup or sample. When you purchase, you’ll receive this exact file with all sections and content included. The delivered file is ready-to-edit and formatted for presentation and analysis in editable formats. No surprises—what you see is what you’ll get.











