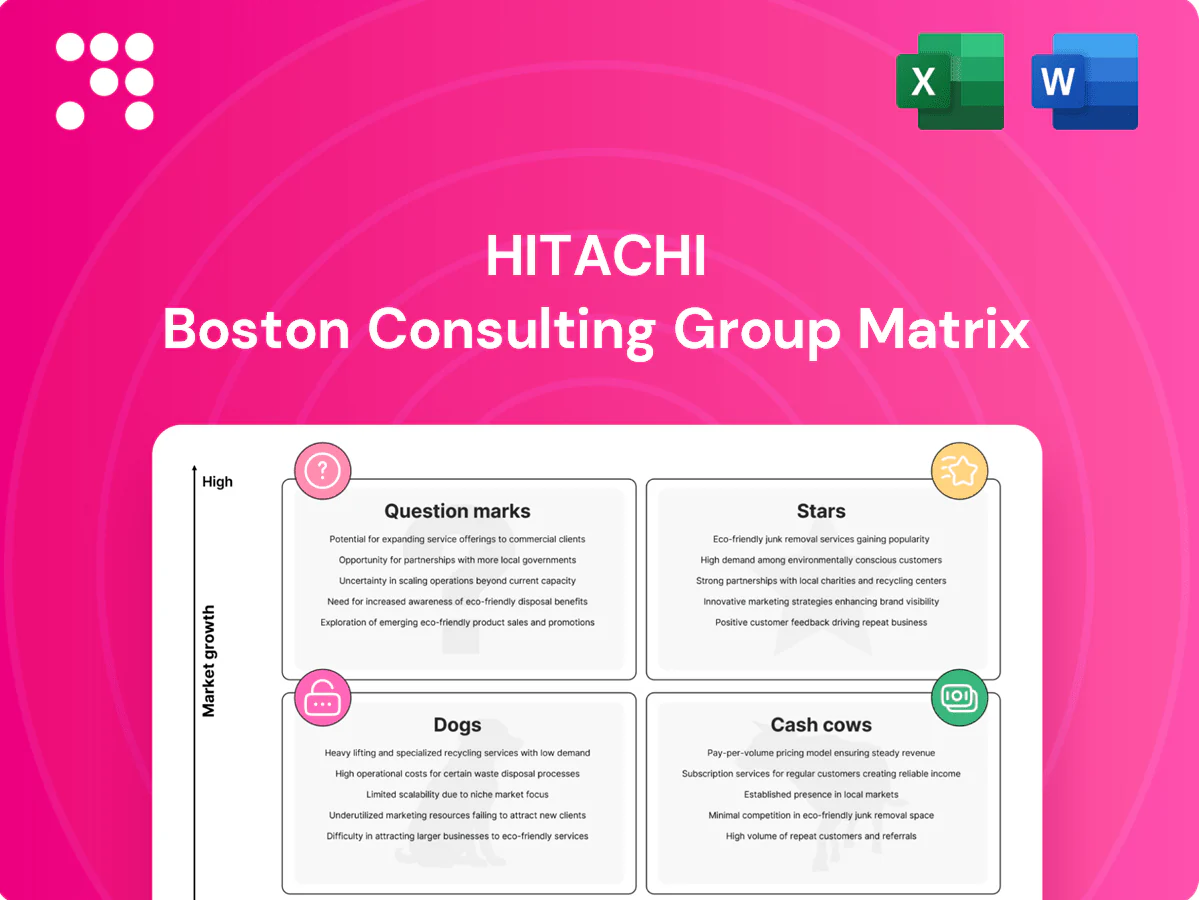
Hitachi Boston Consulting Group Matrix

Download Your Competitive Advantage
Curious where Hitachi’s businesses sit — Stars, Cash Cows, Dogs, or Question Marks? This quick look teases the shifts, but the full Hitachi BCG Matrix gives quadrant-level placements, data-backed recommendations, and a ready-to-use Word report plus a high-level Excel summary. Buy now to skip the legwork and get strategic clarity you can present and act on immediately.
Stars

Lumada digital platform
Lumada sits in Hitachi's BCG Stars quadrant as digital/OT+IT demand accelerates; IDC forecasts global digital transformation spending of about $2.8 trillion in 2024, keeping Lumada in the slipstream. Strong OT-plus-IT references across manufacturing and utilities are driving share gains, though Lumada currently consumes cash for builds, partners and go-to-market. Continue investing—as adoption matures this can convert to a cash generator; message should emphasize outcomes, not plumbing.
Hitachi Energy (grid modernization)
Electrification, HVDC and renewables integration are booming and Hitachi Energy sits at the core, executing multi-GW grid projects with long cycles and heavy capex, so cash in and cash out remain intensive. Leadership is consolidating market positions while pushing capacity expansion and delivery reliability. Maintain the pedal on service-wrap and O&M to capture recurring margins. This platform is positioned to convert project scale into future cash cow dynamics.

Rail systems & signaling
Urbanization is driving rail demand—UN DESA projects 68% urban population by 2050—while decarbonization policies push smart signaling and rolling stock upgrades. Hitachi’s credibility wins major tenders, but sustained investment in delivery and local supply chains is required. Visibility is strong and lifecycle services lift margins, supporting strategies to defend share and lock in long-term O&M contracts.

EV & ADAS (Hitachi Astemo)
EV powertrain, inverters and ADAS are in hypergrowth—global BEV sales reached ~14 million in 2024 (~16% of new cars) and inverter/EV power electronics markets are forecasted to grow high-teens CAGR to 2030; Astemo’s integrated inverter-to-ADAS stack aligns with OEM modularization, hitting the sweet spot for secured platform wins.
- Ramp risk: high upfront program costs and lumpy auto cycles
- Scale: software monetization + standardized components = margin expansion
- Outcome: today's platform wins become tomorrow's annuity
Industrial IoT OT–IT integration
Factories, energy and logistics demand uptime, yield and safety; Hitachi’s deep OT footprint combined with IT analytics differentiates it as the Industrial IoT market—estimated at about $263B in 2024—expands rapidly. Engagements are complex and services-heavy, causing upfront cash burn to win logos; productizing repeatable plays is critical to lock share before the field crowds.
- OT depth + IT analytics: differentiator
- 2024 IIoT market ≈ $263B
- High services intensity → upfront cash burn
- Productize repeatable plays to secure share
Turn DX, IIoT and BEV growth into repeatable service wraps and software annuities
Lumada, Hitachi Energy, Rail and Astemo sit in Stars as 2024 digital/OT+IT spend (~$2.8T), IIoT ~$263B and BEV sales ~14M drive rapid demand; strong references and large projects accelerate share gains but require upfront cash.
Focus on service-wrap, productized repeatable plays and software monetization to convert growth into future annuities.
| Metric | 2024 |
|---|---|
| DX spend | $2.8T |
| IIoT | $263B |
| BEV sales | ~14M (16%) |
What is included in the product
 Detailed Word Document
Hitachi BCG Matrix maps product units into Stars, Cash Cows, Question Marks, Dogs with strategic investment, hold, or divest guidance.

 Customizable Excel Spreadsheet
One-page Hitachi BCG Matrix highlighting unit positions to simplify strategy and cut analysis time
Cash Cows

Elevators & escalators (installed base)
Hitachi’s elevators & escalators sit on a massive installed base within a global fleet of roughly 17 million units, delivering predictable aftermarket revenue that often represents about 60% of lifecycle income and service margins in the 30–50% range. Growth is mature, so marketing focuses on uptime and response times rather than buzz. Investments in remote monitoring and technician productivity tools can boost service yield and shrink downtime. Cash flow from this segment quietly funds higher-growth bets.
Enterprise storage & infrastructure (Vantara)
Enterprise storage & infrastructure (Vantara) is mature but sticky in mission-critical workloads, with typical hardware and platform refresh cycles every 3–5 years keeping steady cash flow. The business competes on reliability and lower TCO rather than hype, leaning on SLAs and long-term support. Focus on optimizing support, capacity planning, and hybrid cloud add-ons to defend margin; don’t overspend—just keep the installed base satisfied.

Social infrastructure O&M
Social infrastructure O&M—water, grid control and public systems—delivers steady EBIT margins around 12–15% with contract renewal rates exceeding 85% in 2024; growth is modest (~2–4% annually) but churn is low because switching is operationally painful. Standardizing toolsets and processes lifts utilization by 6–10%, freeing cash that bankrolls R&D (roughly 3–5% of segment revenue) without creating headline risk.

Industrial maintenance services
Industrial maintenance services are Hitachi cash cows: lifecycle service on equipment fleets delivers recurring, defensible revenue with low promotional spend where wins hinge on SLA performance. Digitizing workflows and applying predictive maintenance (predictive-maintenance market ~6.5B in 2024) widens margin and reduces downtime. Milk firmly, but do not starve the talent bench—retain engineers and data scientists to sustain SLAs and innovation.
- Recurring revenue
- Low promo spend
- SLA-driven wins
- Digitize & predictive (~6.5B 2024)
- Protect talent bench
Air conditioning & home appliances (core markets)
Mature categories with strong brand equity in Japan/Asia, commanding roughly 20–25% share in key markets in 2024; price pressure persists but service and reliability keep share stable. Focus on channel efficiency and energy-saving features (inverter and R32 models improving efficiency ~15–25% vs a decade ago) to protect margin. Cash-positive, low drama with steady operating cash flow.
- Market share: ~20–25% (Japan/Asia, 2024)
- Efficiency gains: +15–25% vs 2014
- Priority: channel efficiency, energy-saving tech
- Financial posture: cash-positive, stable margins
Aftermarket muscle: 17M elevators, 60% lifecycle, storage & predictive maintenance
Hitachi cash cows: elevators/escalators—17M installed units, aftermarket ~60% of lifecycle revenue, service margins 30–50%. Vantara storage—3–5y refresh cycle, sticky mission-critical revenue. Social infra O&M—EBIT ~12–15%, renewal >85% (2024). Industrial maintenance—recurring SLAs, digitization lifts margins; predictive-maintenance market ~$6.5B (2024).
| Segment | Key metric | 2024 |
|---|---|---|
| Elevators | Installed base / aftermarket% | 17M / ~60% |
| Vantara | Refresh cycle | 3–5 years |
| Social O&M | EBIT / renewals | 12–15% / >85% |
| Maintenance | Market / focus | $6.5B / predictive |
Full Transparency, Always
Hitachi BCG Matrix
The file you’re previewing here is the exact Hitachi BCG Matrix report you’ll receive after purchase. No watermarks, no demo text—just the final, fully formatted analysis ready to use. Once bought, the full file is instantly downloadable and editable for presentations or planning. What you see is what you get—clean, professional, and ready to plug into your strategy work.

Download Your Competitive Advantage
Curious where Hitachi’s businesses sit — Stars, Cash Cows, Dogs, or Question Marks? This quick look teases the shifts, but the full Hitachi BCG Matrix gives quadrant-level placements, data-backed recommendations, and a ready-to-use Word report plus a high-level Excel summary. Buy now to skip the legwork and get strategic clarity you can present and act on immediately.
Stars
Lumada digital platform
Lumada sits in Hitachi's BCG Stars quadrant as digital/OT+IT demand accelerates; IDC forecasts global digital transformation spending of about $2.8 trillion in 2024, keeping Lumada in the slipstream. Strong OT-plus-IT references across manufacturing and utilities are driving share gains, though Lumada currently consumes cash for builds, partners and go-to-market. Continue investing—as adoption matures this can convert to a cash generator; message should emphasize outcomes, not plumbing.
Hitachi Energy (grid modernization)
Electrification, HVDC and renewables integration are booming and Hitachi Energy sits at the core, executing multi-GW grid projects with long cycles and heavy capex, so cash in and cash out remain intensive. Leadership is consolidating market positions while pushing capacity expansion and delivery reliability. Maintain the pedal on service-wrap and O&M to capture recurring margins. This platform is positioned to convert project scale into future cash cow dynamics.
Rail systems & signaling
Urbanization is driving rail demand—UN DESA projects 68% urban population by 2050—while decarbonization policies push smart signaling and rolling stock upgrades. Hitachi’s credibility wins major tenders, but sustained investment in delivery and local supply chains is required. Visibility is strong and lifecycle services lift margins, supporting strategies to defend share and lock in long-term O&M contracts.
EV & ADAS (Hitachi Astemo)
EV powertrain, inverters and ADAS are in hypergrowth—global BEV sales reached ~14 million in 2024 (~16% of new cars) and inverter/EV power electronics markets are forecasted to grow high-teens CAGR to 2030; Astemo’s integrated inverter-to-ADAS stack aligns with OEM modularization, hitting the sweet spot for secured platform wins.
- Ramp risk: high upfront program costs and lumpy auto cycles
- Scale: software monetization + standardized components = margin expansion
- Outcome: today's platform wins become tomorrow's annuity
Industrial IoT OT–IT integration
Factories, energy and logistics demand uptime, yield and safety; Hitachi’s deep OT footprint combined with IT analytics differentiates it as the Industrial IoT market—estimated at about $263B in 2024—expands rapidly. Engagements are complex and services-heavy, causing upfront cash burn to win logos; productizing repeatable plays is critical to lock share before the field crowds.
- OT depth + IT analytics: differentiator
- 2024 IIoT market ≈ $263B
- High services intensity → upfront cash burn
- Productize repeatable plays to secure share
Turn DX, IIoT and BEV growth into repeatable service wraps and software annuities
Lumada, Hitachi Energy, Rail and Astemo sit in Stars as 2024 digital/OT+IT spend (~$2.8T), IIoT ~$263B and BEV sales ~14M drive rapid demand; strong references and large projects accelerate share gains but require upfront cash.
Focus on service-wrap, productized repeatable plays and software monetization to convert growth into future annuities.
| Metric | 2024 |
|---|---|
| DX spend | $2.8T |
| IIoT | $263B |
| BEV sales | ~14M (16%) |
What is included in the product
Detailed Word Document
Hitachi BCG Matrix maps product units into Stars, Cash Cows, Question Marks, Dogs with strategic investment, hold, or divest guidance.
Customizable Excel Spreadsheet
One-page Hitachi BCG Matrix highlighting unit positions to simplify strategy and cut analysis time
Cash Cows
Elevators & escalators (installed base)
Hitachi’s elevators & escalators sit on a massive installed base within a global fleet of roughly 17 million units, delivering predictable aftermarket revenue that often represents about 60% of lifecycle income and service margins in the 30–50% range. Growth is mature, so marketing focuses on uptime and response times rather than buzz. Investments in remote monitoring and technician productivity tools can boost service yield and shrink downtime. Cash flow from this segment quietly funds higher-growth bets.
Enterprise storage & infrastructure (Vantara)
Enterprise storage & infrastructure (Vantara) is mature but sticky in mission-critical workloads, with typical hardware and platform refresh cycles every 3–5 years keeping steady cash flow. The business competes on reliability and lower TCO rather than hype, leaning on SLAs and long-term support. Focus on optimizing support, capacity planning, and hybrid cloud add-ons to defend margin; don’t overspend—just keep the installed base satisfied.
Social infrastructure O&M
Social infrastructure O&M—water, grid control and public systems—delivers steady EBIT margins around 12–15% with contract renewal rates exceeding 85% in 2024; growth is modest (~2–4% annually) but churn is low because switching is operationally painful. Standardizing toolsets and processes lifts utilization by 6–10%, freeing cash that bankrolls R&D (roughly 3–5% of segment revenue) without creating headline risk.
Industrial maintenance services
Industrial maintenance services are Hitachi cash cows: lifecycle service on equipment fleets delivers recurring, defensible revenue with low promotional spend where wins hinge on SLA performance. Digitizing workflows and applying predictive maintenance (predictive-maintenance market ~6.5B in 2024) widens margin and reduces downtime. Milk firmly, but do not starve the talent bench—retain engineers and data scientists to sustain SLAs and innovation.
- Recurring revenue
- Low promo spend
- SLA-driven wins
- Digitize & predictive (~6.5B 2024)
- Protect talent bench
Air conditioning & home appliances (core markets)
Mature categories with strong brand equity in Japan/Asia, commanding roughly 20–25% share in key markets in 2024; price pressure persists but service and reliability keep share stable. Focus on channel efficiency and energy-saving features (inverter and R32 models improving efficiency ~15–25% vs a decade ago) to protect margin. Cash-positive, low drama with steady operating cash flow.
- Market share: ~20–25% (Japan/Asia, 2024)
- Efficiency gains: +15–25% vs 2014
- Priority: channel efficiency, energy-saving tech
- Financial posture: cash-positive, stable margins
Aftermarket muscle: 17M elevators, 60% lifecycle, storage & predictive maintenance
Hitachi cash cows: elevators/escalators—17M installed units, aftermarket ~60% of lifecycle revenue, service margins 30–50%. Vantara storage—3–5y refresh cycle, sticky mission-critical revenue. Social infra O&M—EBIT ~12–15%, renewal >85% (2024). Industrial maintenance—recurring SLAs, digitization lifts margins; predictive-maintenance market ~$6.5B (2024).
| Segment | Key metric | 2024 |
|---|---|---|
| Elevators | Installed base / aftermarket% | 17M / ~60% |
| Vantara | Refresh cycle | 3–5 years |
| Social O&M | EBIT / renewals | 12–15% / >85% |
| Maintenance | Market / focus | $6.5B / predictive |
Full Transparency, Always
Hitachi BCG Matrix
The file you’re previewing here is the exact Hitachi BCG Matrix report you’ll receive after purchase. No watermarks, no demo text—just the final, fully formatted analysis ready to use. Once bought, the full file is instantly downloadable and editable for presentations or planning. What you see is what you get—clean, professional, and ready to plug into your strategy work.
Description
Download Your Competitive Advantage
Curious where Hitachi’s businesses sit — Stars, Cash Cows, Dogs, or Question Marks? This quick look teases the shifts, but the full Hitachi BCG Matrix gives quadrant-level placements, data-backed recommendations, and a ready-to-use Word report plus a high-level Excel summary. Buy now to skip the legwork and get strategic clarity you can present and act on immediately.
Stars
Lumada digital platform
Lumada sits in Hitachi's BCG Stars quadrant as digital/OT+IT demand accelerates; IDC forecasts global digital transformation spending of about $2.8 trillion in 2024, keeping Lumada in the slipstream. Strong OT-plus-IT references across manufacturing and utilities are driving share gains, though Lumada currently consumes cash for builds, partners and go-to-market. Continue investing—as adoption matures this can convert to a cash generator; message should emphasize outcomes, not plumbing.
Hitachi Energy (grid modernization)
Electrification, HVDC and renewables integration are booming and Hitachi Energy sits at the core, executing multi-GW grid projects with long cycles and heavy capex, so cash in and cash out remain intensive. Leadership is consolidating market positions while pushing capacity expansion and delivery reliability. Maintain the pedal on service-wrap and O&M to capture recurring margins. This platform is positioned to convert project scale into future cash cow dynamics.
Rail systems & signaling
Urbanization is driving rail demand—UN DESA projects 68% urban population by 2050—while decarbonization policies push smart signaling and rolling stock upgrades. Hitachi’s credibility wins major tenders, but sustained investment in delivery and local supply chains is required. Visibility is strong and lifecycle services lift margins, supporting strategies to defend share and lock in long-term O&M contracts.
EV & ADAS (Hitachi Astemo)
EV powertrain, inverters and ADAS are in hypergrowth—global BEV sales reached ~14 million in 2024 (~16% of new cars) and inverter/EV power electronics markets are forecasted to grow high-teens CAGR to 2030; Astemo’s integrated inverter-to-ADAS stack aligns with OEM modularization, hitting the sweet spot for secured platform wins.
- Ramp risk: high upfront program costs and lumpy auto cycles
- Scale: software monetization + standardized components = margin expansion
- Outcome: today's platform wins become tomorrow's annuity
Industrial IoT OT–IT integration
Factories, energy and logistics demand uptime, yield and safety; Hitachi’s deep OT footprint combined with IT analytics differentiates it as the Industrial IoT market—estimated at about $263B in 2024—expands rapidly. Engagements are complex and services-heavy, causing upfront cash burn to win logos; productizing repeatable plays is critical to lock share before the field crowds.
- OT depth + IT analytics: differentiator
- 2024 IIoT market ≈ $263B
- High services intensity → upfront cash burn
- Productize repeatable plays to secure share
Turn DX, IIoT and BEV growth into repeatable service wraps and software annuities
Lumada, Hitachi Energy, Rail and Astemo sit in Stars as 2024 digital/OT+IT spend (~$2.8T), IIoT ~$263B and BEV sales ~14M drive rapid demand; strong references and large projects accelerate share gains but require upfront cash.
Focus on service-wrap, productized repeatable plays and software monetization to convert growth into future annuities.
| Metric | 2024 |
|---|---|
| DX spend | $2.8T |
| IIoT | $263B |
| BEV sales | ~14M (16%) |
What is included in the product
Detailed Word Document
Hitachi BCG Matrix maps product units into Stars, Cash Cows, Question Marks, Dogs with strategic investment, hold, or divest guidance.
Customizable Excel Spreadsheet
One-page Hitachi BCG Matrix highlighting unit positions to simplify strategy and cut analysis time
Cash Cows
Elevators & escalators (installed base)
Hitachi’s elevators & escalators sit on a massive installed base within a global fleet of roughly 17 million units, delivering predictable aftermarket revenue that often represents about 60% of lifecycle income and service margins in the 30–50% range. Growth is mature, so marketing focuses on uptime and response times rather than buzz. Investments in remote monitoring and technician productivity tools can boost service yield and shrink downtime. Cash flow from this segment quietly funds higher-growth bets.
Enterprise storage & infrastructure (Vantara)
Enterprise storage & infrastructure (Vantara) is mature but sticky in mission-critical workloads, with typical hardware and platform refresh cycles every 3–5 years keeping steady cash flow. The business competes on reliability and lower TCO rather than hype, leaning on SLAs and long-term support. Focus on optimizing support, capacity planning, and hybrid cloud add-ons to defend margin; don’t overspend—just keep the installed base satisfied.
Social infrastructure O&M
Social infrastructure O&M—water, grid control and public systems—delivers steady EBIT margins around 12–15% with contract renewal rates exceeding 85% in 2024; growth is modest (~2–4% annually) but churn is low because switching is operationally painful. Standardizing toolsets and processes lifts utilization by 6–10%, freeing cash that bankrolls R&D (roughly 3–5% of segment revenue) without creating headline risk.
Industrial maintenance services
Industrial maintenance services are Hitachi cash cows: lifecycle service on equipment fleets delivers recurring, defensible revenue with low promotional spend where wins hinge on SLA performance. Digitizing workflows and applying predictive maintenance (predictive-maintenance market ~6.5B in 2024) widens margin and reduces downtime. Milk firmly, but do not starve the talent bench—retain engineers and data scientists to sustain SLAs and innovation.
- Recurring revenue
- Low promo spend
- SLA-driven wins
- Digitize & predictive (~6.5B 2024)
- Protect talent bench
Air conditioning & home appliances (core markets)
Mature categories with strong brand equity in Japan/Asia, commanding roughly 20–25% share in key markets in 2024; price pressure persists but service and reliability keep share stable. Focus on channel efficiency and energy-saving features (inverter and R32 models improving efficiency ~15–25% vs a decade ago) to protect margin. Cash-positive, low drama with steady operating cash flow.
- Market share: ~20–25% (Japan/Asia, 2024)
- Efficiency gains: +15–25% vs 2014
- Priority: channel efficiency, energy-saving tech
- Financial posture: cash-positive, stable margins
Aftermarket muscle: 17M elevators, 60% lifecycle, storage & predictive maintenance
Hitachi cash cows: elevators/escalators—17M installed units, aftermarket ~60% of lifecycle revenue, service margins 30–50%. Vantara storage—3–5y refresh cycle, sticky mission-critical revenue. Social infra O&M—EBIT ~12–15%, renewal >85% (2024). Industrial maintenance—recurring SLAs, digitization lifts margins; predictive-maintenance market ~$6.5B (2024).
| Segment | Key metric | 2024 |
|---|---|---|
| Elevators | Installed base / aftermarket% | 17M / ~60% |
| Vantara | Refresh cycle | 3–5 years |
| Social O&M | EBIT / renewals | 12–15% / >85% |
| Maintenance | Market / focus | $6.5B / predictive |
Full Transparency, Always
Hitachi BCG Matrix
The file you’re previewing here is the exact Hitachi BCG Matrix report you’ll receive after purchase. No watermarks, no demo text—just the final, fully formatted analysis ready to use. Once bought, the full file is instantly downloadable and editable for presentations or planning. What you see is what you get—clean, professional, and ready to plug into your strategy work.











