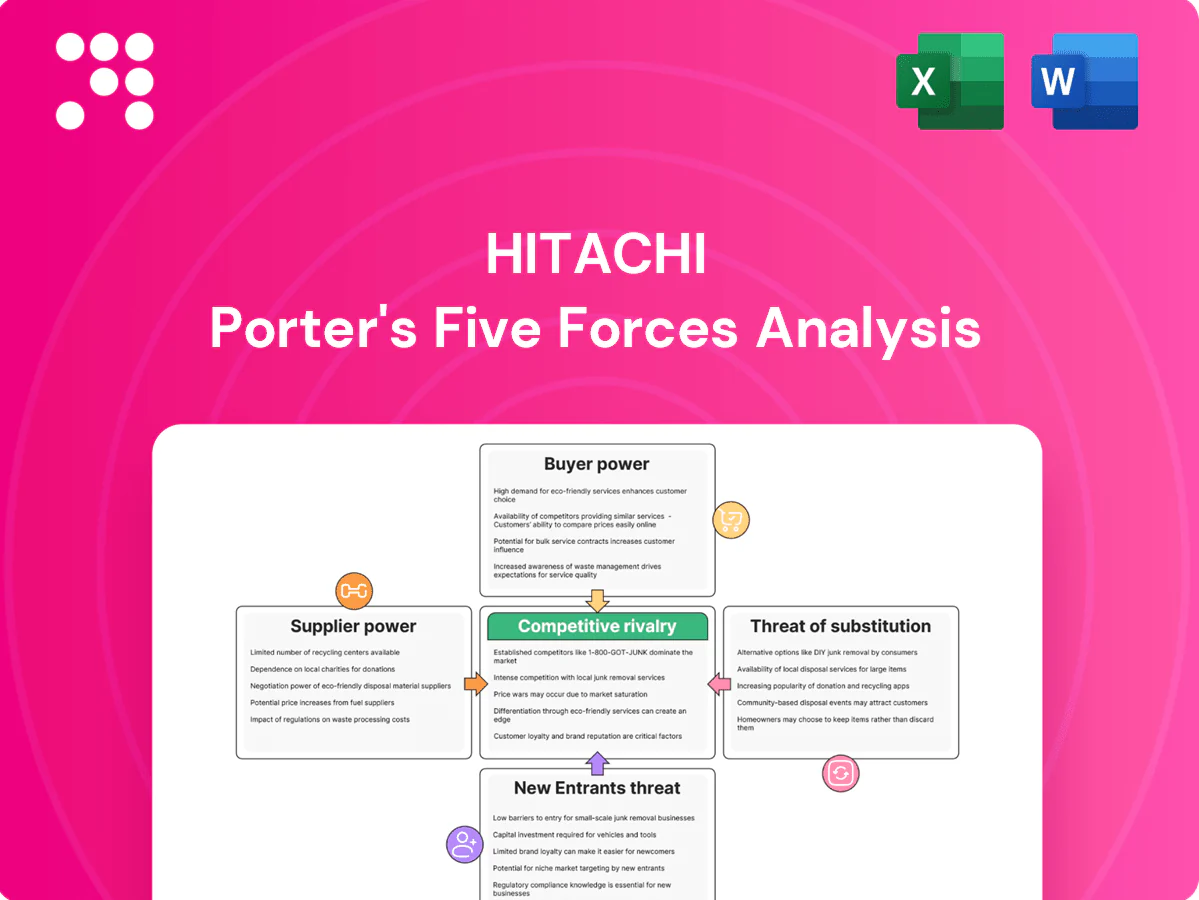
Hitachi Porter's Five Forces Analysis

From Overview to Strategy Blueprint
Hitachi faces nuanced competitive pressures across suppliers, buyers, substitutes, new entrants, and industry rivalry, each shaping its strategic choices and profitability. This snapshot highlights key tension points and areas of resilience in Hitachi’s market position. Ready for deeper, data-driven insights? Unlock the full Porter’s Five Forces Analysis for ratings, visuals, and actionable recommendations.
Suppliers Bargaining Power

Critical components concentration
Hitachi depends on specialized semiconductors, power electronics and rare-earth materials supplied by a handful of global vendors; TSMC held about 53% of foundry share in 2024 and China accounted for roughly 60% of rare‑earth processing in 2024, concentrating supplier power. This concentration elevates pricing power and lead times. Hitachi mitigates via multi‑sourcing and qualifying alternates, though substitution is often infeasible. Strategic inventories and long‑term contracts further dampen supply shocks.
OT equipment and niche tooling
Precision OT equipment, turbines, rail components and industrial sensors often come from niche suppliers, creating high switching costs and qualification cycles that raise supplier leverage. Hitachi’s scale—approximately 10 trillion yen consolidated revenue in FY2024—and long-term vendor relationships improve pricing and lead times, yet bespoke specifications for rail and power gear can lock in dependence. Co-development and priority-supply agreements help rebalance power while securing capacity.

Cloud and software dependencies
Platform partnerships with hyperscalers create ecosystem lock-in—AWS (≈32% market share), Azure (≈23%) and GCP (≈11%) in 2024 concentrate critical services. Competition limits unilateral hikes, but egress, compliance and refactoring costs still add material friction for migrations. Hitachi secures enterprise-wide agreements to obtain multi-10% discounts and roadmap influence. Open architectures lower but do not remove dependency.

Logistics and geopolitical exposure
Global supply-chain tariffs, export controls and port bottlenecks in 2024 can add roughly 2–5% to input costs and extend lead times, pressures suppliers can pass to buyers; regionalization and near-shoring cut transit risk but raise duplication costs by an estimated 5–10%. Hitachi’s diversified global footprint across Asia, Europe and the Americas cushions single-market shocks, yet critical-path components can still compress margins during disruptions.
- Tariff/export pass-through: ~2–5% input cost
- Duplication cost from regionalization: ~5–10%
- Hitachi: diversified footprint reduces single-market exposure
- Critical-path risk: potential margin compression during disruptions
ESG and compliance requirements
Hitachi’s stringent ESG and safety standards shrink the supplier pool by requiring certified environmental management, labor and safety practices, raising compliance costs that suppliers may pass through as higher prices or longer lead times.
Preferred-supplier programs lock in quality and supply-chain transparency in exchange for volume commitments, moderating supplier bargaining power but making rapid supplier substitution difficult during disruptions.
Foundry and rare‑earth concentration (≈53%, ≈60%) raise cost and lead‑time risk
Supplier power is concentrated for semiconductors (TSMC ≈53% foundry share 2024) and rare earths (China ≈60% processing 2024), raising price and lead‑time risk. Hitachi’s ≈10 trillion yen FY2024 scale, multi‑sourcing, long‑term contracts and preferred‑supplier programs partially offset leverage. ESG and bespoke components sustain switching costs and margin vulnerability during disruptions.
| Metric | Value |
|---|---|
| TSMC foundry share | ≈53% (2024) |
| China rare‑earth processing | ≈60% (2024) |
| Hitachi revenue | ≈10T yen FY2024 |
| Tariff/export impact | ~2–5% |
| Regionalization cost | ~5–10% |
What is included in the product
 Detailed Word Document
Tailored Porter's Five Forces for Hitachi, this analysis uncovers competitive drivers, supplier and buyer power, entry barriers, substitutes and disruptive threats, with strategic insights you can edit into reports or decks.

 Customizable Excel Spreadsheet
A concise Porter's Five Forces snapshot tailored for Hitachi—clarifies supplier, buyer, rivalry, entrant, and substitute pressures at a glance to speed strategic decisions and prioritize mitigation actions.
Customers Bargaining Power

Enterprise and government buyers
Large utilities, rail operators, manufacturers and public agencies procure via RFPs with strict SLAs, and OECD data show public procurement totals about 12% of GDP, giving these buyers strong price and term leverage. Hitachi’s differentiated OT-IT integration reduces pure price focus by offering integrated operational value beyond hardware. Multi-year service bundles create mutual dependence through long contract durations and recurring revenue streams.
High switching costs in integrated solutions
High switching costs arise from complex systems, deep data integration, and industry certifications that make migration burdensome; 2024 industry reports highlight integration and compliance as primary barriers to change. Customers still use competitive bids at contract renewal to pressure pricing. Interoperable, modular architectures reduce lock-in and perceived risk. Demonstrable lifecycle performance metrics support premium pricing.

Outcome-based and TCO focus
Buyers now prioritize reliability, uptime and energy efficiency over upfront price, shifting negotiations toward total cost of ownership and strict performance guarantees; data centers consumed about 1% of global electricity in 2024, amplifying energy focus. Hitachi can capture value by monetizing analytics and managed services tied to uptime and efficiency. Contractual missed outcomes trigger penalties or rebates, increasing buyer bargaining power.

Global alternatives and standardization
- Standards: WTO 164 members (2024)
- Standards: ISO 167 member bodies (2024)
- Hitachi: localized support & compliance
- Risk reduction: reference projects + KPIs
Data portability and sovereignty
Customers increasingly demand operational data control and sovereign hosting; 2024 surveys show 68% of enterprise buyers list data residency as a procurement requirement, forcing Hitachi to offer architectural concessions and flexible pricing to win deals. Data portability reduces perceived lock-in and enlarges buyer bargaining room, while trust credentials like ISO 27001 and SOC 2 help recapture value.
- 68% 2024 buyers require data residency
- Portability increases negotiation leverage
- Certifications (ISO 27001, SOC 2) restore premium pricing
Buyer leverage: 12% GDP procurement, 68% data residency
Large public and industrial buyers (public procurement ~12% GDP, 2024) use RFPs and SLAs to extract price and terms leverage. High switching costs from OT‑IT integration and certifications (ISO 27001/SOC 2) temper pure price pressure but renewals reintroduce competitive bidding. Data residency (68% of buyers, 2024) and global standards (WTO 164, ISO 167) increase buyer comparability and bargaining power.
| Metric | 2024 Value |
|---|---|
| Public procurement | ~12% GDP |
| Data residency demand | 68% |
| WTO members | 164 |
| ISO member bodies | 167 |
Same Document Delivered
Hitachi Porter's Five Forces Analysis
This Hitachi Porter’s Five Forces Analysis preview is the exact, fully formatted document you’ll receive immediately after purchase. It contains the complete competitive assessment—threats of new entrants, supplier and buyer power, substitute risks, and industry rivalry—ready for download and use. No samples or placeholders; what you see is the deliverable. Instant access upon payment.

From Overview to Strategy Blueprint
Hitachi faces nuanced competitive pressures across suppliers, buyers, substitutes, new entrants, and industry rivalry, each shaping its strategic choices and profitability. This snapshot highlights key tension points and areas of resilience in Hitachi’s market position. Ready for deeper, data-driven insights? Unlock the full Porter’s Five Forces Analysis for ratings, visuals, and actionable recommendations.
Suppliers Bargaining Power
Critical components concentration
Hitachi depends on specialized semiconductors, power electronics and rare-earth materials supplied by a handful of global vendors; TSMC held about 53% of foundry share in 2024 and China accounted for roughly 60% of rare‑earth processing in 2024, concentrating supplier power. This concentration elevates pricing power and lead times. Hitachi mitigates via multi‑sourcing and qualifying alternates, though substitution is often infeasible. Strategic inventories and long‑term contracts further dampen supply shocks.
OT equipment and niche tooling
Precision OT equipment, turbines, rail components and industrial sensors often come from niche suppliers, creating high switching costs and qualification cycles that raise supplier leverage. Hitachi’s scale—approximately 10 trillion yen consolidated revenue in FY2024—and long-term vendor relationships improve pricing and lead times, yet bespoke specifications for rail and power gear can lock in dependence. Co-development and priority-supply agreements help rebalance power while securing capacity.
Cloud and software dependencies
Platform partnerships with hyperscalers create ecosystem lock-in—AWS (≈32% market share), Azure (≈23%) and GCP (≈11%) in 2024 concentrate critical services. Competition limits unilateral hikes, but egress, compliance and refactoring costs still add material friction for migrations. Hitachi secures enterprise-wide agreements to obtain multi-10% discounts and roadmap influence. Open architectures lower but do not remove dependency.
Logistics and geopolitical exposure
Global supply-chain tariffs, export controls and port bottlenecks in 2024 can add roughly 2–5% to input costs and extend lead times, pressures suppliers can pass to buyers; regionalization and near-shoring cut transit risk but raise duplication costs by an estimated 5–10%. Hitachi’s diversified global footprint across Asia, Europe and the Americas cushions single-market shocks, yet critical-path components can still compress margins during disruptions.
- Tariff/export pass-through: ~2–5% input cost
- Duplication cost from regionalization: ~5–10%
- Hitachi: diversified footprint reduces single-market exposure
- Critical-path risk: potential margin compression during disruptions
ESG and compliance requirements
Hitachi’s stringent ESG and safety standards shrink the supplier pool by requiring certified environmental management, labor and safety practices, raising compliance costs that suppliers may pass through as higher prices or longer lead times.
Preferred-supplier programs lock in quality and supply-chain transparency in exchange for volume commitments, moderating supplier bargaining power but making rapid supplier substitution difficult during disruptions.
Foundry and rare‑earth concentration (≈53%, ≈60%) raise cost and lead‑time risk
Supplier power is concentrated for semiconductors (TSMC ≈53% foundry share 2024) and rare earths (China ≈60% processing 2024), raising price and lead‑time risk. Hitachi’s ≈10 trillion yen FY2024 scale, multi‑sourcing, long‑term contracts and preferred‑supplier programs partially offset leverage. ESG and bespoke components sustain switching costs and margin vulnerability during disruptions.
| Metric | Value |
|---|---|
| TSMC foundry share | ≈53% (2024) |
| China rare‑earth processing | ≈60% (2024) |
| Hitachi revenue | ≈10T yen FY2024 |
| Tariff/export impact | ~2–5% |
| Regionalization cost | ~5–10% |
What is included in the product
Detailed Word Document
Tailored Porter's Five Forces for Hitachi, this analysis uncovers competitive drivers, supplier and buyer power, entry barriers, substitutes and disruptive threats, with strategic insights you can edit into reports or decks.
Customizable Excel Spreadsheet
A concise Porter's Five Forces snapshot tailored for Hitachi—clarifies supplier, buyer, rivalry, entrant, and substitute pressures at a glance to speed strategic decisions and prioritize mitigation actions.
Customers Bargaining Power
Enterprise and government buyers
Large utilities, rail operators, manufacturers and public agencies procure via RFPs with strict SLAs, and OECD data show public procurement totals about 12% of GDP, giving these buyers strong price and term leverage. Hitachi’s differentiated OT-IT integration reduces pure price focus by offering integrated operational value beyond hardware. Multi-year service bundles create mutual dependence through long contract durations and recurring revenue streams.
High switching costs in integrated solutions
High switching costs arise from complex systems, deep data integration, and industry certifications that make migration burdensome; 2024 industry reports highlight integration and compliance as primary barriers to change. Customers still use competitive bids at contract renewal to pressure pricing. Interoperable, modular architectures reduce lock-in and perceived risk. Demonstrable lifecycle performance metrics support premium pricing.
Outcome-based and TCO focus
Buyers now prioritize reliability, uptime and energy efficiency over upfront price, shifting negotiations toward total cost of ownership and strict performance guarantees; data centers consumed about 1% of global electricity in 2024, amplifying energy focus. Hitachi can capture value by monetizing analytics and managed services tied to uptime and efficiency. Contractual missed outcomes trigger penalties or rebates, increasing buyer bargaining power.
Global alternatives and standardization
- Standards: WTO 164 members (2024)
- Standards: ISO 167 member bodies (2024)
- Hitachi: localized support & compliance
- Risk reduction: reference projects + KPIs
Data portability and sovereignty
Customers increasingly demand operational data control and sovereign hosting; 2024 surveys show 68% of enterprise buyers list data residency as a procurement requirement, forcing Hitachi to offer architectural concessions and flexible pricing to win deals. Data portability reduces perceived lock-in and enlarges buyer bargaining room, while trust credentials like ISO 27001 and SOC 2 help recapture value.
- 68% 2024 buyers require data residency
- Portability increases negotiation leverage
- Certifications (ISO 27001, SOC 2) restore premium pricing
Buyer leverage: 12% GDP procurement, 68% data residency
Large public and industrial buyers (public procurement ~12% GDP, 2024) use RFPs and SLAs to extract price and terms leverage. High switching costs from OT‑IT integration and certifications (ISO 27001/SOC 2) temper pure price pressure but renewals reintroduce competitive bidding. Data residency (68% of buyers, 2024) and global standards (WTO 164, ISO 167) increase buyer comparability and bargaining power.
| Metric | 2024 Value |
|---|---|
| Public procurement | ~12% GDP |
| Data residency demand | 68% |
| WTO members | 164 |
| ISO member bodies | 167 |
Same Document Delivered
Hitachi Porter's Five Forces Analysis
This Hitachi Porter’s Five Forces Analysis preview is the exact, fully formatted document you’ll receive immediately after purchase. It contains the complete competitive assessment—threats of new entrants, supplier and buyer power, substitute risks, and industry rivalry—ready for download and use. No samples or placeholders; what you see is the deliverable. Instant access upon payment.
Original: $10.00
-65%$10.00
$3.50Description
From Overview to Strategy Blueprint
Hitachi faces nuanced competitive pressures across suppliers, buyers, substitutes, new entrants, and industry rivalry, each shaping its strategic choices and profitability. This snapshot highlights key tension points and areas of resilience in Hitachi’s market position. Ready for deeper, data-driven insights? Unlock the full Porter’s Five Forces Analysis for ratings, visuals, and actionable recommendations.
Suppliers Bargaining Power
Critical components concentration
Hitachi depends on specialized semiconductors, power electronics and rare-earth materials supplied by a handful of global vendors; TSMC held about 53% of foundry share in 2024 and China accounted for roughly 60% of rare‑earth processing in 2024, concentrating supplier power. This concentration elevates pricing power and lead times. Hitachi mitigates via multi‑sourcing and qualifying alternates, though substitution is often infeasible. Strategic inventories and long‑term contracts further dampen supply shocks.
OT equipment and niche tooling
Precision OT equipment, turbines, rail components and industrial sensors often come from niche suppliers, creating high switching costs and qualification cycles that raise supplier leverage. Hitachi’s scale—approximately 10 trillion yen consolidated revenue in FY2024—and long-term vendor relationships improve pricing and lead times, yet bespoke specifications for rail and power gear can lock in dependence. Co-development and priority-supply agreements help rebalance power while securing capacity.
Cloud and software dependencies
Platform partnerships with hyperscalers create ecosystem lock-in—AWS (≈32% market share), Azure (≈23%) and GCP (≈11%) in 2024 concentrate critical services. Competition limits unilateral hikes, but egress, compliance and refactoring costs still add material friction for migrations. Hitachi secures enterprise-wide agreements to obtain multi-10% discounts and roadmap influence. Open architectures lower but do not remove dependency.
Logistics and geopolitical exposure
Global supply-chain tariffs, export controls and port bottlenecks in 2024 can add roughly 2–5% to input costs and extend lead times, pressures suppliers can pass to buyers; regionalization and near-shoring cut transit risk but raise duplication costs by an estimated 5–10%. Hitachi’s diversified global footprint across Asia, Europe and the Americas cushions single-market shocks, yet critical-path components can still compress margins during disruptions.
- Tariff/export pass-through: ~2–5% input cost
- Duplication cost from regionalization: ~5–10%
- Hitachi: diversified footprint reduces single-market exposure
- Critical-path risk: potential margin compression during disruptions
ESG and compliance requirements
Hitachi’s stringent ESG and safety standards shrink the supplier pool by requiring certified environmental management, labor and safety practices, raising compliance costs that suppliers may pass through as higher prices or longer lead times.
Preferred-supplier programs lock in quality and supply-chain transparency in exchange for volume commitments, moderating supplier bargaining power but making rapid supplier substitution difficult during disruptions.
Foundry and rare‑earth concentration (≈53%, ≈60%) raise cost and lead‑time risk
Supplier power is concentrated for semiconductors (TSMC ≈53% foundry share 2024) and rare earths (China ≈60% processing 2024), raising price and lead‑time risk. Hitachi’s ≈10 trillion yen FY2024 scale, multi‑sourcing, long‑term contracts and preferred‑supplier programs partially offset leverage. ESG and bespoke components sustain switching costs and margin vulnerability during disruptions.
| Metric | Value |
|---|---|
| TSMC foundry share | ≈53% (2024) |
| China rare‑earth processing | ≈60% (2024) |
| Hitachi revenue | ≈10T yen FY2024 |
| Tariff/export impact | ~2–5% |
| Regionalization cost | ~5–10% |
What is included in the product
Detailed Word Document
Tailored Porter's Five Forces for Hitachi, this analysis uncovers competitive drivers, supplier and buyer power, entry barriers, substitutes and disruptive threats, with strategic insights you can edit into reports or decks.
Customizable Excel Spreadsheet
A concise Porter's Five Forces snapshot tailored for Hitachi—clarifies supplier, buyer, rivalry, entrant, and substitute pressures at a glance to speed strategic decisions and prioritize mitigation actions.
Customers Bargaining Power
Enterprise and government buyers
Large utilities, rail operators, manufacturers and public agencies procure via RFPs with strict SLAs, and OECD data show public procurement totals about 12% of GDP, giving these buyers strong price and term leverage. Hitachi’s differentiated OT-IT integration reduces pure price focus by offering integrated operational value beyond hardware. Multi-year service bundles create mutual dependence through long contract durations and recurring revenue streams.
High switching costs in integrated solutions
High switching costs arise from complex systems, deep data integration, and industry certifications that make migration burdensome; 2024 industry reports highlight integration and compliance as primary barriers to change. Customers still use competitive bids at contract renewal to pressure pricing. Interoperable, modular architectures reduce lock-in and perceived risk. Demonstrable lifecycle performance metrics support premium pricing.
Outcome-based and TCO focus
Buyers now prioritize reliability, uptime and energy efficiency over upfront price, shifting negotiations toward total cost of ownership and strict performance guarantees; data centers consumed about 1% of global electricity in 2024, amplifying energy focus. Hitachi can capture value by monetizing analytics and managed services tied to uptime and efficiency. Contractual missed outcomes trigger penalties or rebates, increasing buyer bargaining power.
Global alternatives and standardization
- Standards: WTO 164 members (2024)
- Standards: ISO 167 member bodies (2024)
- Hitachi: localized support & compliance
- Risk reduction: reference projects + KPIs
Data portability and sovereignty
Customers increasingly demand operational data control and sovereign hosting; 2024 surveys show 68% of enterprise buyers list data residency as a procurement requirement, forcing Hitachi to offer architectural concessions and flexible pricing to win deals. Data portability reduces perceived lock-in and enlarges buyer bargaining room, while trust credentials like ISO 27001 and SOC 2 help recapture value.
- 68% 2024 buyers require data residency
- Portability increases negotiation leverage
- Certifications (ISO 27001, SOC 2) restore premium pricing
Buyer leverage: 12% GDP procurement, 68% data residency
Large public and industrial buyers (public procurement ~12% GDP, 2024) use RFPs and SLAs to extract price and terms leverage. High switching costs from OT‑IT integration and certifications (ISO 27001/SOC 2) temper pure price pressure but renewals reintroduce competitive bidding. Data residency (68% of buyers, 2024) and global standards (WTO 164, ISO 167) increase buyer comparability and bargaining power.
| Metric | 2024 Value |
|---|---|
| Public procurement | ~12% GDP |
| Data residency demand | 68% |
| WTO members | 164 |
| ISO member bodies | 167 |
Same Document Delivered
Hitachi Porter's Five Forces Analysis
This Hitachi Porter’s Five Forces Analysis preview is the exact, fully formatted document you’ll receive immediately after purchase. It contains the complete competitive assessment—threats of new entrants, supplier and buyer power, substitute risks, and industry rivalry—ready for download and use. No samples or placeholders; what you see is the deliverable. Instant access upon payment.











