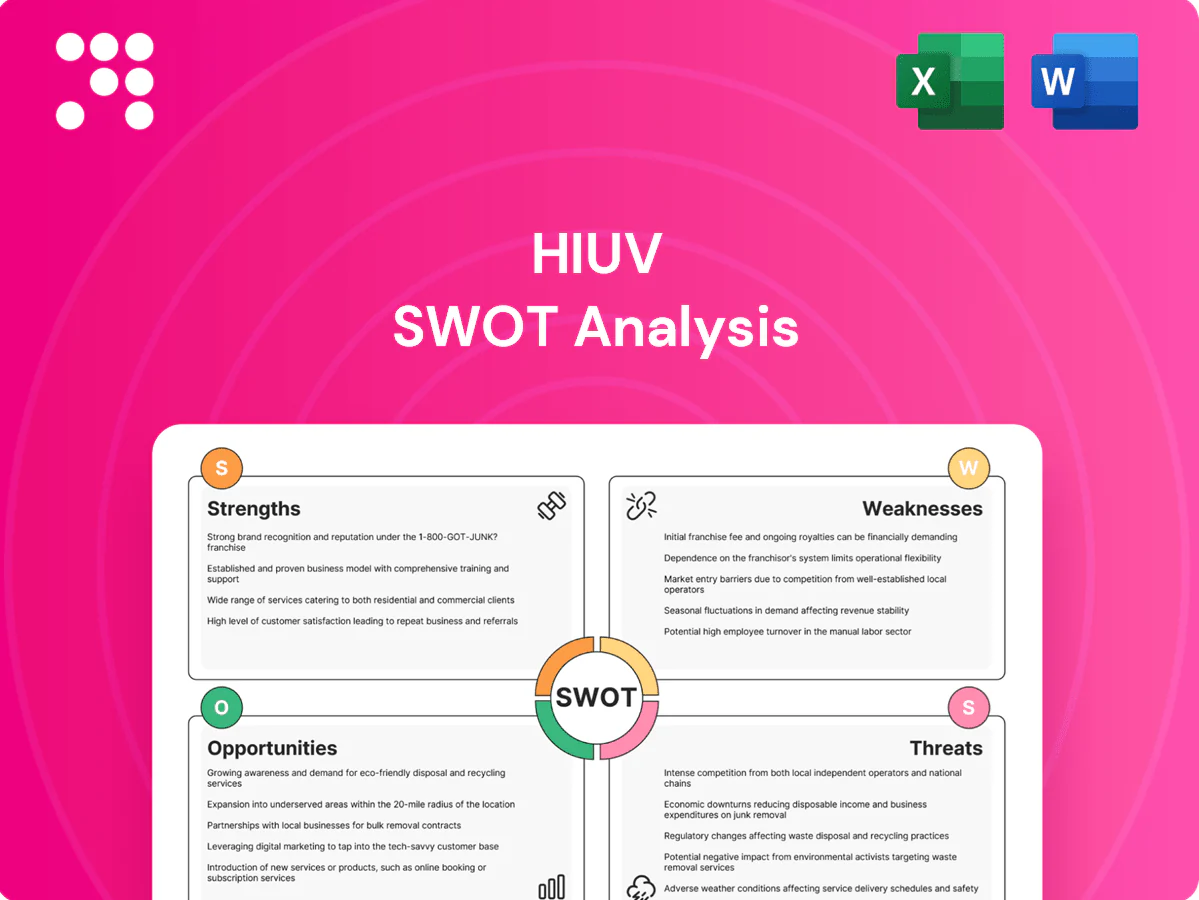
HIUV SWOT Analysis

Your Strategic Toolkit Starts Here
Explore HIUV’s strategic landscape with a focused SWOT snapshot that highlights core strengths, emerging risks, and key growth drivers shaping its market trajectory. For decision-ready depth — including research-backed insights, expert commentary, and editable Word + Excel deliverables — purchase the full SWOT analysis. Unlock the full report to plan, pitch, or invest with confidence.
Strengths

Leading EVA supplier to PV makers
HIUV is a key EVA supplier to photovoltaic module makers, anchoring it in a high-growth solar value chain as global PV additions reached an estimated 450 GW in 2024; established supplier status boosts RFQ win rates and long-term contracts, shortens vendor qualification cycles enabling premium pricing for performance-critical grades, and improves demand visibility for more accurate capacity planning and working-capital management.
Strong R&D in encapsulation materials
Continuous formulation innovation—piloted in 2024—has measurably improved adhesion, UV stability, PID resistance and lamination throughput, while enabling tailored grades for mono, bifacial and glass-glass modules. This technical depth creates switching costs and supports co-development with tier-1 OEMs since 2024, and opens adjacent chemistries such as POE and POE-blends for next-generation cells.

Scale manufacturing and quality consistency
Large-scale production lines reduce unit costs and stabilize supply for global customers, supporting demand as cumulative global PV capacity surpassed 1 TW (IEA, 2022). Tight process control yields uniform gel content, optical clarity and shrinkage within narrow specs, lowering module defect incidence. Consistency minimizes OEM warranty exposure, while scale enables rapid ramp-up to meet surge demand driven by expanding solar deployments.

Diverse solar-focused film portfolio
Diverse solar-focused film portfolio spanning EVA and related next-gen materials broadens addressable use cases, enabling HIUV to qualify multiple grades with the same customer and support system-level bundling that increases share of wallet while lowering dependence on any single encapsulant grade as of 2024 market trends.
- Multi-grade qualification
- Bundling boosts wallet share
- Use-case diversification
- Reduced single-grade risk
Industry certifications and OEM relationships
Industry certifications and OEM relationships lower adoption barriers through compliance with audits and standards, securing early placement in design and BOM decisions and supporting multi-year contracts typically spanning 3–5 years; approved-vendor status also tightens supply commitments and improves forecasting and collaborative problem-solving.
- Compliance: reduces audit delays and market entry friction
- OEM ties: embed HIUV in BOMs early
- Contracts: 3–5 year lock-ins improve volume visibility
- Forecasting: better accuracy and joint resolution
EVA supply chains seize premiums amid ~450 GW PV surge, enabling 3–5 year OEM contracts
HIUV anchors the EVA supply chain amid record PV additions ~450 GW in 2024, securing longer RFQ cycles and premium pricing through tier-1 co-development since 2024. Continuous formulation pilots in 2024 improved adhesion, UV and PID resistance enabling multi-grade qualification and POE entry. Large-scale lines ensure consistency as cumulative PV capacity exceeded 1 TW (IEA, 2022), supporting 3–5 year OEM contracts.
| Metric | Value | Source |
|---|---|---|
| 2024 PV additions | ~450 GW | Market data 2024 |
| Cumulative PV | >1 TW | IEA 2022 |
| Contract terms | 3–5 years | Company/OEM practice |
What is included in the product
 Detailed Word Document
Provides a concise SWOT analysis of HIUV, outlining internal strengths and weaknesses alongside external opportunities and threats to assess its competitive position, strategic risks, and growth potential.

 Customizable Excel Spreadsheet
Delivers a focused SWOT matrix tailored to HIUV, simplifying identification and mitigation of strategic risks so teams can prioritize actions and resolve pain points faster.
Weaknesses

High concentration in solar encapsulants
High concentration in solar encapsulants leaves HIUV exposed to PV cyclicality and policy/subsidy swings that drive sharp revenue volatility. Limited diversification beyond solar reduces resilience during industry downturns. Large buyers can reallocate procurement across suppliers within quarters, rapidly shifting volumes. Concentration also restricts pricing power as encapsulants commoditize.
Raw material and energy cost exposure
HIUV faces raw-material and energy exposure as EVA resin and additives track petrochemical cycles (Brent crude averaged about $86/bbl in 2024), making resin input costs volatile. Energy-intensive lamination amplifies utility swings, and pass-through pricing often lags market moves, compressing margins during price spikes. Timing of inventory purchases can cause gross-margin variability by creating short-term cost mismatches.

Price competition and commoditization
Encapsulant films face intense price pressure from domestic peers, with module ASPs having fallen roughly 30% in 2021–2023, compressing supplier margins. As film specs converge (EVA/POE parity in many applications), meaningful differentiation is harder to sustain and premium pricing is limited. Tender-driven procurement in markets like China and India routinely awards lowest-cost bids, eroding profitability even as volumes grow.

Capex-heavy operations
Extrusion and curing lines demand continual investment to remain competitive, with routine retrofit cycles and line renewals driving sustained capital outlays. High depreciation from recent plant builds strains cash flow during weak pricing cycles, reducing flexibility. Upgrades to support TOPCon/HJT cells require additional tens of millions of dollars per line and risk lower short-term ROI if demand shifts.
- Capex intensity: ongoing retrofit cycles
- Depreciation: compresses cash flow in downturns
- TOPCon/HJT: tens of millions per upgrade
- Overcapacity: risks lower utilization and ROI
Customer concentration risk
Tier-1 module customers can represent 30–60% of supplier revenue, so contract renegotiations or qualification losses can abruptly slash volumes and cash flow. Large OEMs (e.g., Tesla, VW) leverage buying power to pressure pricing and payment terms; customer geographic concentration (e.g., Europe/US focus) amplifies macro and regulatory risks.
- Customer concentration: 30–60% revenue exposure
- Contract risk: abrupt volume/qualification impact
- Buyer power: pricing and payment pressure
- Geographic concentration: amplified macro risk
PV buyer concentration, module ASPs down 30% and retrofit capex squeeze
HIUV is highly solar‑concentrated (30–60% revenue from Tier‑1 module OEMs), exposing it to PV cyclicality, tender price pressure (module ASPs down ~30% in 2021–23) and buyer leverage. EVA/resin costs follow petrochemicals (Brent ~$86/bbl in 2024), plus energy intensity and retrofit capex (tens of millions per TOPCon/HJT line) compress margins and cash flow.
| Metric | Value |
|---|---|
| Customer concentration | 30–60% |
| Module ASP decline | ~30% (2021–23) |
| Brent crude (2024) | $86/bbl |
| Upgrade capex | Tens of $M/line |
Same Document Delivered
HIUV SWOT Analysis
This is the actual SWOT analysis document you’ll receive upon purchase—no surprises, just professional quality. The preview below is taken directly from the full SWOT report for HIUV, and purchasing unlocks the complete, editable version. Buy now to download the full, detailed file immediately.

Your Strategic Toolkit Starts Here
Explore HIUV’s strategic landscape with a focused SWOT snapshot that highlights core strengths, emerging risks, and key growth drivers shaping its market trajectory. For decision-ready depth — including research-backed insights, expert commentary, and editable Word + Excel deliverables — purchase the full SWOT analysis. Unlock the full report to plan, pitch, or invest with confidence.
Strengths
Leading EVA supplier to PV makers
HIUV is a key EVA supplier to photovoltaic module makers, anchoring it in a high-growth solar value chain as global PV additions reached an estimated 450 GW in 2024; established supplier status boosts RFQ win rates and long-term contracts, shortens vendor qualification cycles enabling premium pricing for performance-critical grades, and improves demand visibility for more accurate capacity planning and working-capital management.
Strong R&D in encapsulation materials
Continuous formulation innovation—piloted in 2024—has measurably improved adhesion, UV stability, PID resistance and lamination throughput, while enabling tailored grades for mono, bifacial and glass-glass modules. This technical depth creates switching costs and supports co-development with tier-1 OEMs since 2024, and opens adjacent chemistries such as POE and POE-blends for next-generation cells.
Scale manufacturing and quality consistency
Large-scale production lines reduce unit costs and stabilize supply for global customers, supporting demand as cumulative global PV capacity surpassed 1 TW (IEA, 2022). Tight process control yields uniform gel content, optical clarity and shrinkage within narrow specs, lowering module defect incidence. Consistency minimizes OEM warranty exposure, while scale enables rapid ramp-up to meet surge demand driven by expanding solar deployments.
Diverse solar-focused film portfolio
Diverse solar-focused film portfolio spanning EVA and related next-gen materials broadens addressable use cases, enabling HIUV to qualify multiple grades with the same customer and support system-level bundling that increases share of wallet while lowering dependence on any single encapsulant grade as of 2024 market trends.
- Multi-grade qualification
- Bundling boosts wallet share
- Use-case diversification
- Reduced single-grade risk
Industry certifications and OEM relationships
Industry certifications and OEM relationships lower adoption barriers through compliance with audits and standards, securing early placement in design and BOM decisions and supporting multi-year contracts typically spanning 3–5 years; approved-vendor status also tightens supply commitments and improves forecasting and collaborative problem-solving.
- Compliance: reduces audit delays and market entry friction
- OEM ties: embed HIUV in BOMs early
- Contracts: 3–5 year lock-ins improve volume visibility
- Forecasting: better accuracy and joint resolution
EVA supply chains seize premiums amid ~450 GW PV surge, enabling 3–5 year OEM contracts
HIUV anchors the EVA supply chain amid record PV additions ~450 GW in 2024, securing longer RFQ cycles and premium pricing through tier-1 co-development since 2024. Continuous formulation pilots in 2024 improved adhesion, UV and PID resistance enabling multi-grade qualification and POE entry. Large-scale lines ensure consistency as cumulative PV capacity exceeded 1 TW (IEA, 2022), supporting 3–5 year OEM contracts.
| Metric | Value | Source |
|---|---|---|
| 2024 PV additions | ~450 GW | Market data 2024 |
| Cumulative PV | >1 TW | IEA 2022 |
| Contract terms | 3–5 years | Company/OEM practice |
What is included in the product
Detailed Word Document
Provides a concise SWOT analysis of HIUV, outlining internal strengths and weaknesses alongside external opportunities and threats to assess its competitive position, strategic risks, and growth potential.
Customizable Excel Spreadsheet
Delivers a focused SWOT matrix tailored to HIUV, simplifying identification and mitigation of strategic risks so teams can prioritize actions and resolve pain points faster.
Weaknesses
High concentration in solar encapsulants
High concentration in solar encapsulants leaves HIUV exposed to PV cyclicality and policy/subsidy swings that drive sharp revenue volatility. Limited diversification beyond solar reduces resilience during industry downturns. Large buyers can reallocate procurement across suppliers within quarters, rapidly shifting volumes. Concentration also restricts pricing power as encapsulants commoditize.
Raw material and energy cost exposure
HIUV faces raw-material and energy exposure as EVA resin and additives track petrochemical cycles (Brent crude averaged about $86/bbl in 2024), making resin input costs volatile. Energy-intensive lamination amplifies utility swings, and pass-through pricing often lags market moves, compressing margins during price spikes. Timing of inventory purchases can cause gross-margin variability by creating short-term cost mismatches.
Price competition and commoditization
Encapsulant films face intense price pressure from domestic peers, with module ASPs having fallen roughly 30% in 2021–2023, compressing supplier margins. As film specs converge (EVA/POE parity in many applications), meaningful differentiation is harder to sustain and premium pricing is limited. Tender-driven procurement in markets like China and India routinely awards lowest-cost bids, eroding profitability even as volumes grow.
Capex-heavy operations
Extrusion and curing lines demand continual investment to remain competitive, with routine retrofit cycles and line renewals driving sustained capital outlays. High depreciation from recent plant builds strains cash flow during weak pricing cycles, reducing flexibility. Upgrades to support TOPCon/HJT cells require additional tens of millions of dollars per line and risk lower short-term ROI if demand shifts.
- Capex intensity: ongoing retrofit cycles
- Depreciation: compresses cash flow in downturns
- TOPCon/HJT: tens of millions per upgrade
- Overcapacity: risks lower utilization and ROI
Customer concentration risk
Tier-1 module customers can represent 30–60% of supplier revenue, so contract renegotiations or qualification losses can abruptly slash volumes and cash flow. Large OEMs (e.g., Tesla, VW) leverage buying power to pressure pricing and payment terms; customer geographic concentration (e.g., Europe/US focus) amplifies macro and regulatory risks.
- Customer concentration: 30–60% revenue exposure
- Contract risk: abrupt volume/qualification impact
- Buyer power: pricing and payment pressure
- Geographic concentration: amplified macro risk
PV buyer concentration, module ASPs down 30% and retrofit capex squeeze
HIUV is highly solar‑concentrated (30–60% revenue from Tier‑1 module OEMs), exposing it to PV cyclicality, tender price pressure (module ASPs down ~30% in 2021–23) and buyer leverage. EVA/resin costs follow petrochemicals (Brent ~$86/bbl in 2024), plus energy intensity and retrofit capex (tens of millions per TOPCon/HJT line) compress margins and cash flow.
| Metric | Value |
|---|---|
| Customer concentration | 30–60% |
| Module ASP decline | ~30% (2021–23) |
| Brent crude (2024) | $86/bbl |
| Upgrade capex | Tens of $M/line |
Same Document Delivered
HIUV SWOT Analysis
This is the actual SWOT analysis document you’ll receive upon purchase—no surprises, just professional quality. The preview below is taken directly from the full SWOT report for HIUV, and purchasing unlocks the complete, editable version. Buy now to download the full, detailed file immediately.
Description
Your Strategic Toolkit Starts Here
Explore HIUV’s strategic landscape with a focused SWOT snapshot that highlights core strengths, emerging risks, and key growth drivers shaping its market trajectory. For decision-ready depth — including research-backed insights, expert commentary, and editable Word + Excel deliverables — purchase the full SWOT analysis. Unlock the full report to plan, pitch, or invest with confidence.
Strengths
Leading EVA supplier to PV makers
HIUV is a key EVA supplier to photovoltaic module makers, anchoring it in a high-growth solar value chain as global PV additions reached an estimated 450 GW in 2024; established supplier status boosts RFQ win rates and long-term contracts, shortens vendor qualification cycles enabling premium pricing for performance-critical grades, and improves demand visibility for more accurate capacity planning and working-capital management.
Strong R&D in encapsulation materials
Continuous formulation innovation—piloted in 2024—has measurably improved adhesion, UV stability, PID resistance and lamination throughput, while enabling tailored grades for mono, bifacial and glass-glass modules. This technical depth creates switching costs and supports co-development with tier-1 OEMs since 2024, and opens adjacent chemistries such as POE and POE-blends for next-generation cells.
Scale manufacturing and quality consistency
Large-scale production lines reduce unit costs and stabilize supply for global customers, supporting demand as cumulative global PV capacity surpassed 1 TW (IEA, 2022). Tight process control yields uniform gel content, optical clarity and shrinkage within narrow specs, lowering module defect incidence. Consistency minimizes OEM warranty exposure, while scale enables rapid ramp-up to meet surge demand driven by expanding solar deployments.
Diverse solar-focused film portfolio
Diverse solar-focused film portfolio spanning EVA and related next-gen materials broadens addressable use cases, enabling HIUV to qualify multiple grades with the same customer and support system-level bundling that increases share of wallet while lowering dependence on any single encapsulant grade as of 2024 market trends.
- Multi-grade qualification
- Bundling boosts wallet share
- Use-case diversification
- Reduced single-grade risk
Industry certifications and OEM relationships
Industry certifications and OEM relationships lower adoption barriers through compliance with audits and standards, securing early placement in design and BOM decisions and supporting multi-year contracts typically spanning 3–5 years; approved-vendor status also tightens supply commitments and improves forecasting and collaborative problem-solving.
- Compliance: reduces audit delays and market entry friction
- OEM ties: embed HIUV in BOMs early
- Contracts: 3–5 year lock-ins improve volume visibility
- Forecasting: better accuracy and joint resolution
EVA supply chains seize premiums amid ~450 GW PV surge, enabling 3–5 year OEM contracts
HIUV anchors the EVA supply chain amid record PV additions ~450 GW in 2024, securing longer RFQ cycles and premium pricing through tier-1 co-development since 2024. Continuous formulation pilots in 2024 improved adhesion, UV and PID resistance enabling multi-grade qualification and POE entry. Large-scale lines ensure consistency as cumulative PV capacity exceeded 1 TW (IEA, 2022), supporting 3–5 year OEM contracts.
| Metric | Value | Source |
|---|---|---|
| 2024 PV additions | ~450 GW | Market data 2024 |
| Cumulative PV | >1 TW | IEA 2022 |
| Contract terms | 3–5 years | Company/OEM practice |
What is included in the product
Detailed Word Document
Provides a concise SWOT analysis of HIUV, outlining internal strengths and weaknesses alongside external opportunities and threats to assess its competitive position, strategic risks, and growth potential.
Customizable Excel Spreadsheet
Delivers a focused SWOT matrix tailored to HIUV, simplifying identification and mitigation of strategic risks so teams can prioritize actions and resolve pain points faster.
Weaknesses
High concentration in solar encapsulants
High concentration in solar encapsulants leaves HIUV exposed to PV cyclicality and policy/subsidy swings that drive sharp revenue volatility. Limited diversification beyond solar reduces resilience during industry downturns. Large buyers can reallocate procurement across suppliers within quarters, rapidly shifting volumes. Concentration also restricts pricing power as encapsulants commoditize.
Raw material and energy cost exposure
HIUV faces raw-material and energy exposure as EVA resin and additives track petrochemical cycles (Brent crude averaged about $86/bbl in 2024), making resin input costs volatile. Energy-intensive lamination amplifies utility swings, and pass-through pricing often lags market moves, compressing margins during price spikes. Timing of inventory purchases can cause gross-margin variability by creating short-term cost mismatches.
Price competition and commoditization
Encapsulant films face intense price pressure from domestic peers, with module ASPs having fallen roughly 30% in 2021–2023, compressing supplier margins. As film specs converge (EVA/POE parity in many applications), meaningful differentiation is harder to sustain and premium pricing is limited. Tender-driven procurement in markets like China and India routinely awards lowest-cost bids, eroding profitability even as volumes grow.
Capex-heavy operations
Extrusion and curing lines demand continual investment to remain competitive, with routine retrofit cycles and line renewals driving sustained capital outlays. High depreciation from recent plant builds strains cash flow during weak pricing cycles, reducing flexibility. Upgrades to support TOPCon/HJT cells require additional tens of millions of dollars per line and risk lower short-term ROI if demand shifts.
- Capex intensity: ongoing retrofit cycles
- Depreciation: compresses cash flow in downturns
- TOPCon/HJT: tens of millions per upgrade
- Overcapacity: risks lower utilization and ROI
Customer concentration risk
Tier-1 module customers can represent 30–60% of supplier revenue, so contract renegotiations or qualification losses can abruptly slash volumes and cash flow. Large OEMs (e.g., Tesla, VW) leverage buying power to pressure pricing and payment terms; customer geographic concentration (e.g., Europe/US focus) amplifies macro and regulatory risks.
- Customer concentration: 30–60% revenue exposure
- Contract risk: abrupt volume/qualification impact
- Buyer power: pricing and payment pressure
- Geographic concentration: amplified macro risk
PV buyer concentration, module ASPs down 30% and retrofit capex squeeze
HIUV is highly solar‑concentrated (30–60% revenue from Tier‑1 module OEMs), exposing it to PV cyclicality, tender price pressure (module ASPs down ~30% in 2021–23) and buyer leverage. EVA/resin costs follow petrochemicals (Brent ~$86/bbl in 2024), plus energy intensity and retrofit capex (tens of millions per TOPCon/HJT line) compress margins and cash flow.
| Metric | Value |
|---|---|
| Customer concentration | 30–60% |
| Module ASP decline | ~30% (2021–23) |
| Brent crude (2024) | $86/bbl |
| Upgrade capex | Tens of $M/line |
Same Document Delivered
HIUV SWOT Analysis
This is the actual SWOT analysis document you’ll receive upon purchase—no surprises, just professional quality. The preview below is taken directly from the full SWOT report for HIUV, and purchasing unlocks the complete, editable version. Buy now to download the full, detailed file immediately.











