China Oil And Gas Group Boston Consulting Group Matrix

Unlock Strategic Clarity
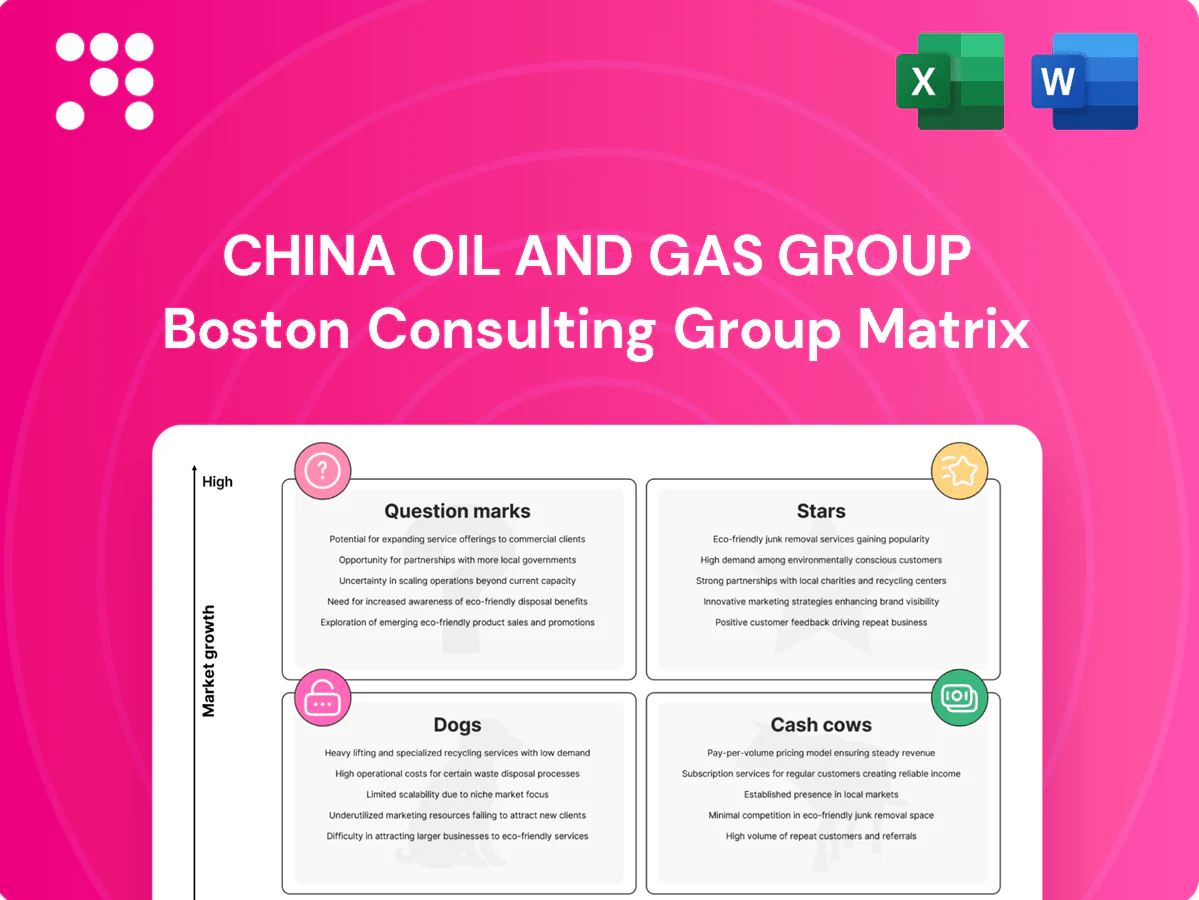
China Oil And Gas Group’s BCG Matrix snapshot shows where core assets sit as potential Stars or risky Dogs amid shifting energy demand, and hints at which divisions are pulling the balance sheet. This preview teases quadrant placements and early recommendations—useful but incomplete. Purchase the full BCG Matrix for a complete, data-backed breakdown, quadrant-by-quadrant strategies, and editable Word/Excel files so you can act fast and align capital where it counts.
Stars

Core CBM acreage
Surging coal-to-gas switching is lifting CBM demand—China's natural gas consumption reached about 360 bcm in 2023—and China Oil And Gas Group's meaningful core CBM acreage plus operating know-how give scale benefits and preferential offtake access. The asset requires steady capex for drilling, dewatering and gathering to sustain production. Maintain share now; as basin growth normalizes it can mature into a cash cow.
City-gas distribution
City-gas distribution in fast-growing regions drives volume growth and defensible share as urbanization (China urban population ~64.7% in 2023) and rising gas use (China ~357 bcm natural gas consumption in 2023, IEA) expand connections. Network effects, local permit regimes and sunk pipeline costs create high barriers to entry. Promotion focuses on new connections and reliability rather than brand ads. Heavy ongoing build‑out sustains high capex but market leaders recover investment through scale and tariff stability.

Midstream trunk pipelines
Controlled trunk corridors secure throughput and anchor long‑term contracts, supporting stable tariffs as China’s oil and gas pipeline network exceeded 300,000 km in 2024. As gas adoption rises—China’s gas consumption grew roughly 4% in 2024—utilization and bargaining power remain strong for trunk operators. Expansion loops and compressor upgrades still consume meaningful capital and drive midstream capex allocation. Protecting right‑of‑way and interconnects preserves the star position.

LNG logistics & trucking
China Oil And Gas Group’s LNG logistics & trucking is a Star: small‑scale LNG trucking extends supply to industrial users beyond pipeline reach while China has been the world’s largest LNG importer since 2021, supporting sustained demand. The company’s integrated supply chain lowers delivered cost and improves service, but the segment is capex‑ and working‑capital hungry. Scale and route density sustain high share as regional demand expands.
- Market position: Star
- Demand driver: off‑grid industrial users
- Strength: integrated supply lowers cost & improves service
- Weakness: high capex and working capital
- Advantage: scale and route density sustain share
Integrated gas solutions
Integrated gas solutions
Bundle of upstream gas + midstream + downstream sales solves customer pain end-to-end, enabling higher share capture per customer in China’s expanding gas market (2024 consumption ~368 bcm, ~4.5% YoY growth). Requires investment in digital dispatch, metering, and service to scale. Maintain momentum to convert growth into durable cash generation.- End-to-end value capture: higher share per customer
- Market context: China gas ~368 bcm in 2024, +4.5% YoY
- Invest: digital dispatch, smart metering, field service
- Goal: convert volume growth into durable cash flow
CBM, city gas & LNG truck lift China gas 368 bcm (+4.5%)
Stars: CBM, city gas, trunk corridors, LNG trucking and integrated gas solutions drive volume and share as China gas ~368 bcm in 2024 (+4.5% YoY); high capex but strong scale, network effects and offtake access suggest transition to cash cows as markets mature.
| Segment | 2024 metric | Key risk |
|---|---|---|
| CBM | scale acreage, drilling capex | dewatering costs |
| City gas | urbanization ~64.7% | build‑out capex |
What is included in the product
 Detailed Word Document
Comprehensive BCG Matrix review of China Oil and Gas Group, identifying Stars, Cash Cows, Question Marks and Dogs with strategic actions.

 Customizable Excel Spreadsheet
One-page BCG matrix mapping China Oil & Gas units to cut analysis time and speed C-level decisions.
Cash Cows

Legacy oil output
Legacy oil output produces steady cash with typical decline rates of roughly 3–5%/yr from mature fields, delivering predictable opex (~$12–18/bbl for onshore Chinese assets in 2024) and selective capex to sustain plateau. Existing infrastructure keeps upstream margins high relative to greenfield projects, enabling low promotion needs. Milk these cash flows to fund gas-growth programs and technology pilots, aligned with 2024 capex reallocation trends of ~20–30% toward gas and low‑carbon projects.
City-gate wholesale
City-gate wholesale secures long-tenor municipal supply contracts (typically >10 years), delivering predictable volumes that underpinned c.60% of China Oil And Gas Group's gas throughput in 2024. Admin and sales costs fall materially once pricing and terms are locked, lowering unit OPEX. Margins benefit from scale logistics and cash generation is being redeployed to high-growth upstream and retail expansion projects.

Gas processing plants
Established treating and dehydration units in China Oil And Gas Group ran at ~90% utilization in 2024, delivering steady cash flow. Incremental debottlenecking projects with modest capex (typically <5% of replacement cost) raised throughput by 5–10%, boosting near-term free cash. Commodity processing fees in mature basins stayed resilient, changing by less than 5% year-on-year in 2024. Keep reliability high and unit opex low to sustain the cash cow.

Storage caverns capacity
Booked storage capacity smooths seasonal spreads and underpins balancing services; 2024 utilization stayed above 80% supporting steady liftings and calendar arbitrage. Revenue is stable with limited incremental marketing; maintenance capex is modest versus cash generation, typically low single-digit percent of operating cash flow. Optimize injection/withdrawal cadence to maximize carry and seasonal basis capture.
- Booked utilization: >80% (2024)
- Revenue: steady, low marketing
- Maintenance capex: low single-digit % of OCF
- Strategy: optimize injection/withdrawal to maximize carry
Industrial offtake contracts
Stable blue‑chip buyers (top 5 accounted for 62% of industrial volumes in 2024) provide volume certainty and strong credit quality. Low selling expense post‑integration (selling SG&A under 2% of revenue) lowers cost to serve. Take‑or‑pay (typical floor ~80% of contracted volumes) and pass‑through clauses protect margins, sustaining ~20% EBITDA in 2024; maintain SLAs and renegotiate indexing as needed.
- Volume concentration: top5=62%
- Selling cost: SG&A <2%
- Take‑or‑pay floor ≈80%
- EBITDA ≈20% (2024)
Predictable oil cash funds gas growth; 20-30% capex reallocated
Legacy oil and midstream assets generated predictable cash in 2024 with oil decline ~3–5%/yr, opex ~$12–18/bbl, and upstream margins funding gas growth; city‑gate contracts covered ~60% of gas throughput; processing units ~90% utilization and storage >80% kept maintenance capex low. Redeploy cash to gas and low‑carbon capex (2024 reallocation ~20–30%).
| Metric | 2024 |
|---|---|
| Oil decline | 3–5%/yr |
| OPEX (onshore) | $12–18/bbl |
| Gas throughput share | ~60% |
| Processing util | ~90% |
| Storage util | >80% |
| Capex reallocation | 20–30% |
What You See Is What You Get
China Oil And Gas Group BCG Matrix
The file you're previewing is the final China Oil And Gas Group BCG Matrix you'll receive after purchase. No watermarks or demo text — just a fully formatted, analysis-ready report tailored for strategic clarity. This exact document is downloadable immediately after payment and is editable, printable, and presentation-ready. Designed by market experts, it plugs straight into your planning or investor materials with no surprises.

Unlock Strategic Clarity
China Oil And Gas Group’s BCG Matrix snapshot shows where core assets sit as potential Stars or risky Dogs amid shifting energy demand, and hints at which divisions are pulling the balance sheet. This preview teases quadrant placements and early recommendations—useful but incomplete. Purchase the full BCG Matrix for a complete, data-backed breakdown, quadrant-by-quadrant strategies, and editable Word/Excel files so you can act fast and align capital where it counts.
Stars
Core CBM acreage
Surging coal-to-gas switching is lifting CBM demand—China's natural gas consumption reached about 360 bcm in 2023—and China Oil And Gas Group's meaningful core CBM acreage plus operating know-how give scale benefits and preferential offtake access. The asset requires steady capex for drilling, dewatering and gathering to sustain production. Maintain share now; as basin growth normalizes it can mature into a cash cow.
City-gas distribution
City-gas distribution in fast-growing regions drives volume growth and defensible share as urbanization (China urban population ~64.7% in 2023) and rising gas use (China ~357 bcm natural gas consumption in 2023, IEA) expand connections. Network effects, local permit regimes and sunk pipeline costs create high barriers to entry. Promotion focuses on new connections and reliability rather than brand ads. Heavy ongoing build‑out sustains high capex but market leaders recover investment through scale and tariff stability.
Midstream trunk pipelines
Controlled trunk corridors secure throughput and anchor long‑term contracts, supporting stable tariffs as China’s oil and gas pipeline network exceeded 300,000 km in 2024. As gas adoption rises—China’s gas consumption grew roughly 4% in 2024—utilization and bargaining power remain strong for trunk operators. Expansion loops and compressor upgrades still consume meaningful capital and drive midstream capex allocation. Protecting right‑of‑way and interconnects preserves the star position.
LNG logistics & trucking
China Oil And Gas Group’s LNG logistics & trucking is a Star: small‑scale LNG trucking extends supply to industrial users beyond pipeline reach while China has been the world’s largest LNG importer since 2021, supporting sustained demand. The company’s integrated supply chain lowers delivered cost and improves service, but the segment is capex‑ and working‑capital hungry. Scale and route density sustain high share as regional demand expands.
- Market position: Star
- Demand driver: off‑grid industrial users
- Strength: integrated supply lowers cost & improves service
- Weakness: high capex and working capital
- Advantage: scale and route density sustain share
Integrated gas solutions
Integrated gas solutions
Bundle of upstream gas + midstream + downstream sales solves customer pain end-to-end, enabling higher share capture per customer in China’s expanding gas market (2024 consumption ~368 bcm, ~4.5% YoY growth). Requires investment in digital dispatch, metering, and service to scale. Maintain momentum to convert growth into durable cash generation.- End-to-end value capture: higher share per customer
- Market context: China gas ~368 bcm in 2024, +4.5% YoY
- Invest: digital dispatch, smart metering, field service
- Goal: convert volume growth into durable cash flow
CBM, city gas & LNG truck lift China gas 368 bcm (+4.5%)
Stars: CBM, city gas, trunk corridors, LNG trucking and integrated gas solutions drive volume and share as China gas ~368 bcm in 2024 (+4.5% YoY); high capex but strong scale, network effects and offtake access suggest transition to cash cows as markets mature.
| Segment | 2024 metric | Key risk |
|---|---|---|
| CBM | scale acreage, drilling capex | dewatering costs |
| City gas | urbanization ~64.7% | build‑out capex |
What is included in the product
Detailed Word Document
Comprehensive BCG Matrix review of China Oil and Gas Group, identifying Stars, Cash Cows, Question Marks and Dogs with strategic actions.
Customizable Excel Spreadsheet
One-page BCG matrix mapping China Oil & Gas units to cut analysis time and speed C-level decisions.
Cash Cows
Legacy oil output
Legacy oil output produces steady cash with typical decline rates of roughly 3–5%/yr from mature fields, delivering predictable opex (~$12–18/bbl for onshore Chinese assets in 2024) and selective capex to sustain plateau. Existing infrastructure keeps upstream margins high relative to greenfield projects, enabling low promotion needs. Milk these cash flows to fund gas-growth programs and technology pilots, aligned with 2024 capex reallocation trends of ~20–30% toward gas and low‑carbon projects.
City-gate wholesale
City-gate wholesale secures long-tenor municipal supply contracts (typically >10 years), delivering predictable volumes that underpinned c.60% of China Oil And Gas Group's gas throughput in 2024. Admin and sales costs fall materially once pricing and terms are locked, lowering unit OPEX. Margins benefit from scale logistics and cash generation is being redeployed to high-growth upstream and retail expansion projects.
Gas processing plants
Established treating and dehydration units in China Oil And Gas Group ran at ~90% utilization in 2024, delivering steady cash flow. Incremental debottlenecking projects with modest capex (typically <5% of replacement cost) raised throughput by 5–10%, boosting near-term free cash. Commodity processing fees in mature basins stayed resilient, changing by less than 5% year-on-year in 2024. Keep reliability high and unit opex low to sustain the cash cow.
Storage caverns capacity
Booked storage capacity smooths seasonal spreads and underpins balancing services; 2024 utilization stayed above 80% supporting steady liftings and calendar arbitrage. Revenue is stable with limited incremental marketing; maintenance capex is modest versus cash generation, typically low single-digit percent of operating cash flow. Optimize injection/withdrawal cadence to maximize carry and seasonal basis capture.
- Booked utilization: >80% (2024)
- Revenue: steady, low marketing
- Maintenance capex: low single-digit % of OCF
- Strategy: optimize injection/withdrawal to maximize carry
Industrial offtake contracts
Stable blue‑chip buyers (top 5 accounted for 62% of industrial volumes in 2024) provide volume certainty and strong credit quality. Low selling expense post‑integration (selling SG&A under 2% of revenue) lowers cost to serve. Take‑or‑pay (typical floor ~80% of contracted volumes) and pass‑through clauses protect margins, sustaining ~20% EBITDA in 2024; maintain SLAs and renegotiate indexing as needed.
- Volume concentration: top5=62%
- Selling cost: SG&A <2%
- Take‑or‑pay floor ≈80%
- EBITDA ≈20% (2024)
Predictable oil cash funds gas growth; 20-30% capex reallocated
Legacy oil and midstream assets generated predictable cash in 2024 with oil decline ~3–5%/yr, opex ~$12–18/bbl, and upstream margins funding gas growth; city‑gate contracts covered ~60% of gas throughput; processing units ~90% utilization and storage >80% kept maintenance capex low. Redeploy cash to gas and low‑carbon capex (2024 reallocation ~20–30%).
| Metric | 2024 |
|---|---|
| Oil decline | 3–5%/yr |
| OPEX (onshore) | $12–18/bbl |
| Gas throughput share | ~60% |
| Processing util | ~90% |
| Storage util | >80% |
| Capex reallocation | 20–30% |
What You See Is What You Get
China Oil And Gas Group BCG Matrix
The file you're previewing is the final China Oil And Gas Group BCG Matrix you'll receive after purchase. No watermarks or demo text — just a fully formatted, analysis-ready report tailored for strategic clarity. This exact document is downloadable immediately after payment and is editable, printable, and presentation-ready. Designed by market experts, it plugs straight into your planning or investor materials with no surprises.
Description
Unlock Strategic Clarity
China Oil And Gas Group’s BCG Matrix snapshot shows where core assets sit as potential Stars or risky Dogs amid shifting energy demand, and hints at which divisions are pulling the balance sheet. This preview teases quadrant placements and early recommendations—useful but incomplete. Purchase the full BCG Matrix for a complete, data-backed breakdown, quadrant-by-quadrant strategies, and editable Word/Excel files so you can act fast and align capital where it counts.
Stars
Core CBM acreage
Surging coal-to-gas switching is lifting CBM demand—China's natural gas consumption reached about 360 bcm in 2023—and China Oil And Gas Group's meaningful core CBM acreage plus operating know-how give scale benefits and preferential offtake access. The asset requires steady capex for drilling, dewatering and gathering to sustain production. Maintain share now; as basin growth normalizes it can mature into a cash cow.
City-gas distribution
City-gas distribution in fast-growing regions drives volume growth and defensible share as urbanization (China urban population ~64.7% in 2023) and rising gas use (China ~357 bcm natural gas consumption in 2023, IEA) expand connections. Network effects, local permit regimes and sunk pipeline costs create high barriers to entry. Promotion focuses on new connections and reliability rather than brand ads. Heavy ongoing build‑out sustains high capex but market leaders recover investment through scale and tariff stability.
Midstream trunk pipelines
Controlled trunk corridors secure throughput and anchor long‑term contracts, supporting stable tariffs as China’s oil and gas pipeline network exceeded 300,000 km in 2024. As gas adoption rises—China’s gas consumption grew roughly 4% in 2024—utilization and bargaining power remain strong for trunk operators. Expansion loops and compressor upgrades still consume meaningful capital and drive midstream capex allocation. Protecting right‑of‑way and interconnects preserves the star position.
LNG logistics & trucking
China Oil And Gas Group’s LNG logistics & trucking is a Star: small‑scale LNG trucking extends supply to industrial users beyond pipeline reach while China has been the world’s largest LNG importer since 2021, supporting sustained demand. The company’s integrated supply chain lowers delivered cost and improves service, but the segment is capex‑ and working‑capital hungry. Scale and route density sustain high share as regional demand expands.
- Market position: Star
- Demand driver: off‑grid industrial users
- Strength: integrated supply lowers cost & improves service
- Weakness: high capex and working capital
- Advantage: scale and route density sustain share
Integrated gas solutions
Integrated gas solutions
Bundle of upstream gas + midstream + downstream sales solves customer pain end-to-end, enabling higher share capture per customer in China’s expanding gas market (2024 consumption ~368 bcm, ~4.5% YoY growth). Requires investment in digital dispatch, metering, and service to scale. Maintain momentum to convert growth into durable cash generation.- End-to-end value capture: higher share per customer
- Market context: China gas ~368 bcm in 2024, +4.5% YoY
- Invest: digital dispatch, smart metering, field service
- Goal: convert volume growth into durable cash flow
CBM, city gas & LNG truck lift China gas 368 bcm (+4.5%)
Stars: CBM, city gas, trunk corridors, LNG trucking and integrated gas solutions drive volume and share as China gas ~368 bcm in 2024 (+4.5% YoY); high capex but strong scale, network effects and offtake access suggest transition to cash cows as markets mature.
| Segment | 2024 metric | Key risk |
|---|---|---|
| CBM | scale acreage, drilling capex | dewatering costs |
| City gas | urbanization ~64.7% | build‑out capex |
What is included in the product
Detailed Word Document
Comprehensive BCG Matrix review of China Oil and Gas Group, identifying Stars, Cash Cows, Question Marks and Dogs with strategic actions.
Customizable Excel Spreadsheet
One-page BCG matrix mapping China Oil & Gas units to cut analysis time and speed C-level decisions.
Cash Cows
Legacy oil output
Legacy oil output produces steady cash with typical decline rates of roughly 3–5%/yr from mature fields, delivering predictable opex (~$12–18/bbl for onshore Chinese assets in 2024) and selective capex to sustain plateau. Existing infrastructure keeps upstream margins high relative to greenfield projects, enabling low promotion needs. Milk these cash flows to fund gas-growth programs and technology pilots, aligned with 2024 capex reallocation trends of ~20–30% toward gas and low‑carbon projects.
City-gate wholesale
City-gate wholesale secures long-tenor municipal supply contracts (typically >10 years), delivering predictable volumes that underpinned c.60% of China Oil And Gas Group's gas throughput in 2024. Admin and sales costs fall materially once pricing and terms are locked, lowering unit OPEX. Margins benefit from scale logistics and cash generation is being redeployed to high-growth upstream and retail expansion projects.
Gas processing plants
Established treating and dehydration units in China Oil And Gas Group ran at ~90% utilization in 2024, delivering steady cash flow. Incremental debottlenecking projects with modest capex (typically <5% of replacement cost) raised throughput by 5–10%, boosting near-term free cash. Commodity processing fees in mature basins stayed resilient, changing by less than 5% year-on-year in 2024. Keep reliability high and unit opex low to sustain the cash cow.
Storage caverns capacity
Booked storage capacity smooths seasonal spreads and underpins balancing services; 2024 utilization stayed above 80% supporting steady liftings and calendar arbitrage. Revenue is stable with limited incremental marketing; maintenance capex is modest versus cash generation, typically low single-digit percent of operating cash flow. Optimize injection/withdrawal cadence to maximize carry and seasonal basis capture.
- Booked utilization: >80% (2024)
- Revenue: steady, low marketing
- Maintenance capex: low single-digit % of OCF
- Strategy: optimize injection/withdrawal to maximize carry
Industrial offtake contracts
Stable blue‑chip buyers (top 5 accounted for 62% of industrial volumes in 2024) provide volume certainty and strong credit quality. Low selling expense post‑integration (selling SG&A under 2% of revenue) lowers cost to serve. Take‑or‑pay (typical floor ~80% of contracted volumes) and pass‑through clauses protect margins, sustaining ~20% EBITDA in 2024; maintain SLAs and renegotiate indexing as needed.
- Volume concentration: top5=62%
- Selling cost: SG&A <2%
- Take‑or‑pay floor ≈80%
- EBITDA ≈20% (2024)
Predictable oil cash funds gas growth; 20-30% capex reallocated
Legacy oil and midstream assets generated predictable cash in 2024 with oil decline ~3–5%/yr, opex ~$12–18/bbl, and upstream margins funding gas growth; city‑gate contracts covered ~60% of gas throughput; processing units ~90% utilization and storage >80% kept maintenance capex low. Redeploy cash to gas and low‑carbon capex (2024 reallocation ~20–30%).
| Metric | 2024 |
|---|---|
| Oil decline | 3–5%/yr |
| OPEX (onshore) | $12–18/bbl |
| Gas throughput share | ~60% |
| Processing util | ~90% |
| Storage util | >80% |
| Capex reallocation | 20–30% |
What You See Is What You Get
China Oil And Gas Group BCG Matrix
The file you're previewing is the final China Oil And Gas Group BCG Matrix you'll receive after purchase. No watermarks or demo text — just a fully formatted, analysis-ready report tailored for strategic clarity. This exact document is downloadable immediately after payment and is editable, printable, and presentation-ready. Designed by market experts, it plugs straight into your planning or investor materials with no surprises.











