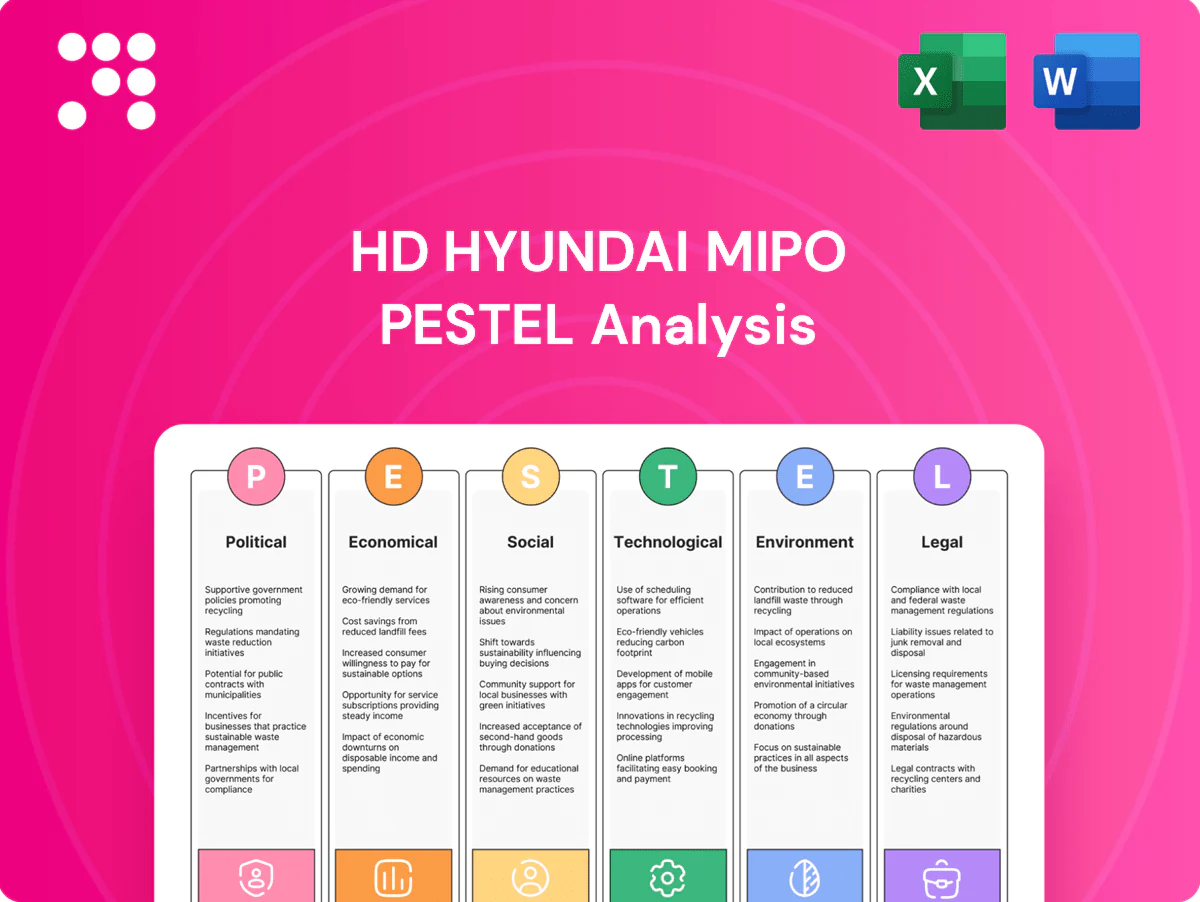
Hd Hyundai Mipo PESTLE Analysis

Your Competitive Advantage Starts with This Report
Discover how political shifts, economic cycles, social trends, technological advances, legal changes, and environmental pressures shape Hd Hyundai Mipo's strategic outlook in our concise PESTLE snapshot; it highlights critical risks and opportunities to inform investment or strategic planning. Purchase the full PESTLE for a detailed, actionable analysis ready for immediate use.
Political factors

Korean industrial policy and subsidies
Korean government support for strategic shipbuilding eases financing through low‑interest loans, tax incentives, and R&D grants, and funds workforce training programs that directly benefit yards like HD Hyundai Mipo. Recent policy shifts reallocating resources toward defense and semiconductors risk reducing yard‑specific support and procurement pipelines. Monitoring allocations to green shipping initiatives and decarbonization subsidies is critical for maintaining competitiveness.
Geopolitical tensions and trade routes
Geopolitical tensions in East Asia and Red Sea disruptions have tightened owner confidence and lengthened ordering cycles, contributing to volatility against a backdrop of global seaborne trade of about 11 billion tonnes (UNCTAD, 2023). Naval risks force rerouting and pushed some war-risk insurance premiums up sharply in 2023–24, altering demand for tankers and container ships. Political stability in key export markets directly affects backlog visibility for Hyundai Mipo, making orderbook predictability more uncertain.

Export controls and sanctions
Export controls and sanctions—intensified by US, EU and South Korea since 2014 and expanded after 2022—limit eligible customers and cargo trades for HD Hyundai Mipo, notably constraining business with Russia, Iran and DPRK-linked entities. Compliance increases due-diligence and documentation burdens, raising transaction times and administrative costs. Diversifying buyer portfolios and end-user screening reduces sanction exposure and revenue concentration risk.

Public procurement and state-owned buyers
State-linked carriers and national oil companies remain key buyers for HD Hyundai Mipo: political procurement cycles and off-take contracts affect order timing and pricing, with major state buyers often negotiating long-term, price-sensitive contracts. IMO targets to reduce shipping GHGs by at least 50% by 2050 and the EU FuelEU Maritime rules push faster uptake of eco-friendly designs, accelerating demand for LNG, battery-hybrid and ammonia-ready vessels.
- State buyers steer timing/pricing
- IMO 2050: ≥50% GHG cut drives eco orders
- EU FuelEU Maritime boosts low-carbon demand
- Tender rules often favor domestic content/tech
International maritime diplomacy (IMO influence)
- IMO influence: EEXI/CII 2023–2025
- Korea market weight: ~40% global shipbuilding
- Opportunity: first-mover orders for compliant designs
- Risk: design/regulatory uncertainty from delays
State aid fuels low-carbon ship demand amid tensions and ~11bn t trade
Korean state support (low‑interest loans, R&D grants) underpins HD Hyundai Mipo but budget shifts to defense/semiconductors may reduce yard‑specific aid. East Asia tensions and Red Sea risks lengthen ordering cycles amid global seaborne trade ~11 billion tonnes (UNCTAD 2023). Sanctions restrict customers while IMO ≥50% GHG cut by 2050 and Korea’s ~40% shipyard share drive demand for low‑carbon designs.
| Metric | Value |
|---|---|
| Global seaborne trade (2023) | ~11 bn tonnes |
| South Korea shipbuilding share | ~40% |
| IMO GHG target | ≥50% by 2050 |
| Notable risk | Sanctions & geopolitical volatility |
What is included in the product
 Detailed Word Document
Explores how Political, Economic, Social, Technological, Environmental, and Legal forces uniquely affect HD Hyundai Mipo Shipyard, with each section backed by current industry data and regional regulatory trends. Designed for executives and investors, it highlights actionable risks and opportunities and includes forward-looking insights to support scenario planning and strategic decision-making.

 Customizable Excel Spreadsheet
A distilled PESTLE summary for Hd Hyundai Mipo that clarifies regulatory, economic and technological risks to expedite decision-making in meetings; easily dropped into presentations, annotated for local context, and shared across teams for quick alignment.
Economic factors

Shipping cycle and freight rate volatility
Earnings volatility in product/chemical tankers and containers directly drives owner capex: 2024 saw MR product tanker TCEs spike above $20,000/day at peaks while SCFI container rates exceeded $1,800/FEU during short rallies, pulling forward newbuild and retrofit demand. High-rate periods in 2023–25 triggered orderbooks and green retrofits; weak spells produced widespread delays and cancellations. Cycle timing remains pivotal for yard utilization and margin capture.
Input costs: steel, equipment, labor
Plate steel priced around $600/t in 2024, marine engines often exceed $1m per unit and specialist systems (LNG, scrubbers) can add 10–15% to build costs, together driving swing in pricing power. Long-lead procurement and hedging reduce cost variability but raise inventory and working capital needs—typical order pipelines add 30–60 days of inventory and can push working capital toward ~20% of contract value. Productivity gains through automation and cadence improvements are vital to protect margins on fixed-price shipbuilding contracts.

FX exposure (KRW vs USD)
Most contracts are USD-denominated (backlog >80%) while shipbuilding costs and labor are KRW-heavy; USD/KRW averaged about 1,320 in 2024, so KRW appreciation compresses USD-linked margins. KRW weakness improves export competitiveness but raises imported steel and equipment costs. Hedging policy and natural USD revenue offsets materially affect earnings stability.

Interest rates and financing availability
Owner access to leasing, export credit and bank debt underpins HMMIPO order intake; Korean export credit facilities (eg KEXIM/Korea Eximbank support) and commercial loans remain key. Higher policy and market rates (BOK policy ~3.5% mid-2025; ship‑finance spreads ~200–350 bps) raise NPV hurdles for newbuilds, favoring repairs/conversions. Yard capex and performance bonding costs climb as borrowing costs rise.
- Leasing/ECAs critical to orders
- Rates ↑ → newbuild NPV ↓, repairs ↑
- Spreads 200–350 bps lift capex/bonding costs
Scrapping and fleet age profile
- Fleet age tag: 11–13y (2024)
- Scrap price tag: USD 450–650/ton (2024)
- Demand tag: replacement up; conversions rise when NB costs high
State aid fuels low-carbon ship demand amid tensions and ~11bn t trade
Earnings swings (MR TCEs >USD20k/day peaks; SCFI >USD1,800/FEU) drive owner capex and retrofit timing. Input costs (plate ~USD600/t; engines >USD1m) and USD/KRW ~1,320 (2024) swing margins; BOK ~3.5% and ship‑finance spreads 200–350bps raise NPV hurdles and capex costs.
| Metric | 2024–25 |
|---|---|
| USD/KRW | ~1,320 |
| Plate steel | ~USD600/t |
| MR TCE peak | >USD20,000/day |
| BOK policy | ~3.5% |
| Spreads | 200–350bps |
| Fleet age | 11–13y |
| Scrap HMS | USD450–650/t |
What You See Is What You Get
Hd Hyundai Mipo PESTLE Analysis
The preview shown here is the exact Hd Hyundai Mipo PESTLE Analysis document you’ll receive after purchase—fully formatted, referenced, and ready to use. No placeholders or teasers; the content, structure, and layout visible are the final file available for instant download. Use it immediately for strategy, reporting, or presentation.

Your Competitive Advantage Starts with This Report
Discover how political shifts, economic cycles, social trends, technological advances, legal changes, and environmental pressures shape Hd Hyundai Mipo's strategic outlook in our concise PESTLE snapshot; it highlights critical risks and opportunities to inform investment or strategic planning. Purchase the full PESTLE for a detailed, actionable analysis ready for immediate use.
Political factors
Korean industrial policy and subsidies
Korean government support for strategic shipbuilding eases financing through low‑interest loans, tax incentives, and R&D grants, and funds workforce training programs that directly benefit yards like HD Hyundai Mipo. Recent policy shifts reallocating resources toward defense and semiconductors risk reducing yard‑specific support and procurement pipelines. Monitoring allocations to green shipping initiatives and decarbonization subsidies is critical for maintaining competitiveness.
Geopolitical tensions and trade routes
Geopolitical tensions in East Asia and Red Sea disruptions have tightened owner confidence and lengthened ordering cycles, contributing to volatility against a backdrop of global seaborne trade of about 11 billion tonnes (UNCTAD, 2023). Naval risks force rerouting and pushed some war-risk insurance premiums up sharply in 2023–24, altering demand for tankers and container ships. Political stability in key export markets directly affects backlog visibility for Hyundai Mipo, making orderbook predictability more uncertain.
Export controls and sanctions
Export controls and sanctions—intensified by US, EU and South Korea since 2014 and expanded after 2022—limit eligible customers and cargo trades for HD Hyundai Mipo, notably constraining business with Russia, Iran and DPRK-linked entities. Compliance increases due-diligence and documentation burdens, raising transaction times and administrative costs. Diversifying buyer portfolios and end-user screening reduces sanction exposure and revenue concentration risk.
Public procurement and state-owned buyers
State-linked carriers and national oil companies remain key buyers for HD Hyundai Mipo: political procurement cycles and off-take contracts affect order timing and pricing, with major state buyers often negotiating long-term, price-sensitive contracts. IMO targets to reduce shipping GHGs by at least 50% by 2050 and the EU FuelEU Maritime rules push faster uptake of eco-friendly designs, accelerating demand for LNG, battery-hybrid and ammonia-ready vessels.
- State buyers steer timing/pricing
- IMO 2050: ≥50% GHG cut drives eco orders
- EU FuelEU Maritime boosts low-carbon demand
- Tender rules often favor domestic content/tech
International maritime diplomacy (IMO influence)
- IMO influence: EEXI/CII 2023–2025
- Korea market weight: ~40% global shipbuilding
- Opportunity: first-mover orders for compliant designs
- Risk: design/regulatory uncertainty from delays
State aid fuels low-carbon ship demand amid tensions and ~11bn t trade
Korean state support (low‑interest loans, R&D grants) underpins HD Hyundai Mipo but budget shifts to defense/semiconductors may reduce yard‑specific aid. East Asia tensions and Red Sea risks lengthen ordering cycles amid global seaborne trade ~11 billion tonnes (UNCTAD 2023). Sanctions restrict customers while IMO ≥50% GHG cut by 2050 and Korea’s ~40% shipyard share drive demand for low‑carbon designs.
| Metric | Value |
|---|---|
| Global seaborne trade (2023) | ~11 bn tonnes |
| South Korea shipbuilding share | ~40% |
| IMO GHG target | ≥50% by 2050 |
| Notable risk | Sanctions & geopolitical volatility |
What is included in the product
Detailed Word Document
Explores how Political, Economic, Social, Technological, Environmental, and Legal forces uniquely affect HD Hyundai Mipo Shipyard, with each section backed by current industry data and regional regulatory trends. Designed for executives and investors, it highlights actionable risks and opportunities and includes forward-looking insights to support scenario planning and strategic decision-making.
Customizable Excel Spreadsheet
A distilled PESTLE summary for Hd Hyundai Mipo that clarifies regulatory, economic and technological risks to expedite decision-making in meetings; easily dropped into presentations, annotated for local context, and shared across teams for quick alignment.
Economic factors
Shipping cycle and freight rate volatility
Earnings volatility in product/chemical tankers and containers directly drives owner capex: 2024 saw MR product tanker TCEs spike above $20,000/day at peaks while SCFI container rates exceeded $1,800/FEU during short rallies, pulling forward newbuild and retrofit demand. High-rate periods in 2023–25 triggered orderbooks and green retrofits; weak spells produced widespread delays and cancellations. Cycle timing remains pivotal for yard utilization and margin capture.
Input costs: steel, equipment, labor
Plate steel priced around $600/t in 2024, marine engines often exceed $1m per unit and specialist systems (LNG, scrubbers) can add 10–15% to build costs, together driving swing in pricing power. Long-lead procurement and hedging reduce cost variability but raise inventory and working capital needs—typical order pipelines add 30–60 days of inventory and can push working capital toward ~20% of contract value. Productivity gains through automation and cadence improvements are vital to protect margins on fixed-price shipbuilding contracts.
FX exposure (KRW vs USD)
Most contracts are USD-denominated (backlog >80%) while shipbuilding costs and labor are KRW-heavy; USD/KRW averaged about 1,320 in 2024, so KRW appreciation compresses USD-linked margins. KRW weakness improves export competitiveness but raises imported steel and equipment costs. Hedging policy and natural USD revenue offsets materially affect earnings stability.
Interest rates and financing availability
Owner access to leasing, export credit and bank debt underpins HMMIPO order intake; Korean export credit facilities (eg KEXIM/Korea Eximbank support) and commercial loans remain key. Higher policy and market rates (BOK policy ~3.5% mid-2025; ship‑finance spreads ~200–350 bps) raise NPV hurdles for newbuilds, favoring repairs/conversions. Yard capex and performance bonding costs climb as borrowing costs rise.
- Leasing/ECAs critical to orders
- Rates ↑ → newbuild NPV ↓, repairs ↑
- Spreads 200–350 bps lift capex/bonding costs
Scrapping and fleet age profile
- Fleet age tag: 11–13y (2024)
- Scrap price tag: USD 450–650/ton (2024)
- Demand tag: replacement up; conversions rise when NB costs high
State aid fuels low-carbon ship demand amid tensions and ~11bn t trade
Earnings swings (MR TCEs >USD20k/day peaks; SCFI >USD1,800/FEU) drive owner capex and retrofit timing. Input costs (plate ~USD600/t; engines >USD1m) and USD/KRW ~1,320 (2024) swing margins; BOK ~3.5% and ship‑finance spreads 200–350bps raise NPV hurdles and capex costs.
| Metric | 2024–25 |
|---|---|
| USD/KRW | ~1,320 |
| Plate steel | ~USD600/t |
| MR TCE peak | >USD20,000/day |
| BOK policy | ~3.5% |
| Spreads | 200–350bps |
| Fleet age | 11–13y |
| Scrap HMS | USD450–650/t |
What You See Is What You Get
Hd Hyundai Mipo PESTLE Analysis
The preview shown here is the exact Hd Hyundai Mipo PESTLE Analysis document you’ll receive after purchase—fully formatted, referenced, and ready to use. No placeholders or teasers; the content, structure, and layout visible are the final file available for instant download. Use it immediately for strategy, reporting, or presentation.
Description
Your Competitive Advantage Starts with This Report
Discover how political shifts, economic cycles, social trends, technological advances, legal changes, and environmental pressures shape Hd Hyundai Mipo's strategic outlook in our concise PESTLE snapshot; it highlights critical risks and opportunities to inform investment or strategic planning. Purchase the full PESTLE for a detailed, actionable analysis ready for immediate use.
Political factors
Korean industrial policy and subsidies
Korean government support for strategic shipbuilding eases financing through low‑interest loans, tax incentives, and R&D grants, and funds workforce training programs that directly benefit yards like HD Hyundai Mipo. Recent policy shifts reallocating resources toward defense and semiconductors risk reducing yard‑specific support and procurement pipelines. Monitoring allocations to green shipping initiatives and decarbonization subsidies is critical for maintaining competitiveness.
Geopolitical tensions and trade routes
Geopolitical tensions in East Asia and Red Sea disruptions have tightened owner confidence and lengthened ordering cycles, contributing to volatility against a backdrop of global seaborne trade of about 11 billion tonnes (UNCTAD, 2023). Naval risks force rerouting and pushed some war-risk insurance premiums up sharply in 2023–24, altering demand for tankers and container ships. Political stability in key export markets directly affects backlog visibility for Hyundai Mipo, making orderbook predictability more uncertain.
Export controls and sanctions
Export controls and sanctions—intensified by US, EU and South Korea since 2014 and expanded after 2022—limit eligible customers and cargo trades for HD Hyundai Mipo, notably constraining business with Russia, Iran and DPRK-linked entities. Compliance increases due-diligence and documentation burdens, raising transaction times and administrative costs. Diversifying buyer portfolios and end-user screening reduces sanction exposure and revenue concentration risk.
Public procurement and state-owned buyers
State-linked carriers and national oil companies remain key buyers for HD Hyundai Mipo: political procurement cycles and off-take contracts affect order timing and pricing, with major state buyers often negotiating long-term, price-sensitive contracts. IMO targets to reduce shipping GHGs by at least 50% by 2050 and the EU FuelEU Maritime rules push faster uptake of eco-friendly designs, accelerating demand for LNG, battery-hybrid and ammonia-ready vessels.
- State buyers steer timing/pricing
- IMO 2050: ≥50% GHG cut drives eco orders
- EU FuelEU Maritime boosts low-carbon demand
- Tender rules often favor domestic content/tech
International maritime diplomacy (IMO influence)
- IMO influence: EEXI/CII 2023–2025
- Korea market weight: ~40% global shipbuilding
- Opportunity: first-mover orders for compliant designs
- Risk: design/regulatory uncertainty from delays
State aid fuels low-carbon ship demand amid tensions and ~11bn t trade
Korean state support (low‑interest loans, R&D grants) underpins HD Hyundai Mipo but budget shifts to defense/semiconductors may reduce yard‑specific aid. East Asia tensions and Red Sea risks lengthen ordering cycles amid global seaborne trade ~11 billion tonnes (UNCTAD 2023). Sanctions restrict customers while IMO ≥50% GHG cut by 2050 and Korea’s ~40% shipyard share drive demand for low‑carbon designs.
| Metric | Value |
|---|---|
| Global seaborne trade (2023) | ~11 bn tonnes |
| South Korea shipbuilding share | ~40% |
| IMO GHG target | ≥50% by 2050 |
| Notable risk | Sanctions & geopolitical volatility |
What is included in the product
Detailed Word Document
Explores how Political, Economic, Social, Technological, Environmental, and Legal forces uniquely affect HD Hyundai Mipo Shipyard, with each section backed by current industry data and regional regulatory trends. Designed for executives and investors, it highlights actionable risks and opportunities and includes forward-looking insights to support scenario planning and strategic decision-making.
Customizable Excel Spreadsheet
A distilled PESTLE summary for Hd Hyundai Mipo that clarifies regulatory, economic and technological risks to expedite decision-making in meetings; easily dropped into presentations, annotated for local context, and shared across teams for quick alignment.
Economic factors
Shipping cycle and freight rate volatility
Earnings volatility in product/chemical tankers and containers directly drives owner capex: 2024 saw MR product tanker TCEs spike above $20,000/day at peaks while SCFI container rates exceeded $1,800/FEU during short rallies, pulling forward newbuild and retrofit demand. High-rate periods in 2023–25 triggered orderbooks and green retrofits; weak spells produced widespread delays and cancellations. Cycle timing remains pivotal for yard utilization and margin capture.
Input costs: steel, equipment, labor
Plate steel priced around $600/t in 2024, marine engines often exceed $1m per unit and specialist systems (LNG, scrubbers) can add 10–15% to build costs, together driving swing in pricing power. Long-lead procurement and hedging reduce cost variability but raise inventory and working capital needs—typical order pipelines add 30–60 days of inventory and can push working capital toward ~20% of contract value. Productivity gains through automation and cadence improvements are vital to protect margins on fixed-price shipbuilding contracts.
FX exposure (KRW vs USD)
Most contracts are USD-denominated (backlog >80%) while shipbuilding costs and labor are KRW-heavy; USD/KRW averaged about 1,320 in 2024, so KRW appreciation compresses USD-linked margins. KRW weakness improves export competitiveness but raises imported steel and equipment costs. Hedging policy and natural USD revenue offsets materially affect earnings stability.
Interest rates and financing availability
Owner access to leasing, export credit and bank debt underpins HMMIPO order intake; Korean export credit facilities (eg KEXIM/Korea Eximbank support) and commercial loans remain key. Higher policy and market rates (BOK policy ~3.5% mid-2025; ship‑finance spreads ~200–350 bps) raise NPV hurdles for newbuilds, favoring repairs/conversions. Yard capex and performance bonding costs climb as borrowing costs rise.
- Leasing/ECAs critical to orders
- Rates ↑ → newbuild NPV ↓, repairs ↑
- Spreads 200–350 bps lift capex/bonding costs
Scrapping and fleet age profile
- Fleet age tag: 11–13y (2024)
- Scrap price tag: USD 450–650/ton (2024)
- Demand tag: replacement up; conversions rise when NB costs high
State aid fuels low-carbon ship demand amid tensions and ~11bn t trade
Earnings swings (MR TCEs >USD20k/day peaks; SCFI >USD1,800/FEU) drive owner capex and retrofit timing. Input costs (plate ~USD600/t; engines >USD1m) and USD/KRW ~1,320 (2024) swing margins; BOK ~3.5% and ship‑finance spreads 200–350bps raise NPV hurdles and capex costs.
| Metric | 2024–25 |
|---|---|
| USD/KRW | ~1,320 |
| Plate steel | ~USD600/t |
| MR TCE peak | >USD20,000/day |
| BOK policy | ~3.5% |
| Spreads | 200–350bps |
| Fleet age | 11–13y |
| Scrap HMS | USD450–650/t |
What You See Is What You Get
Hd Hyundai Mipo PESTLE Analysis
The preview shown here is the exact Hd Hyundai Mipo PESTLE Analysis document you’ll receive after purchase—fully formatted, referenced, and ready to use. No placeholders or teasers; the content, structure, and layout visible are the final file available for instant download. Use it immediately for strategy, reporting, or presentation.











