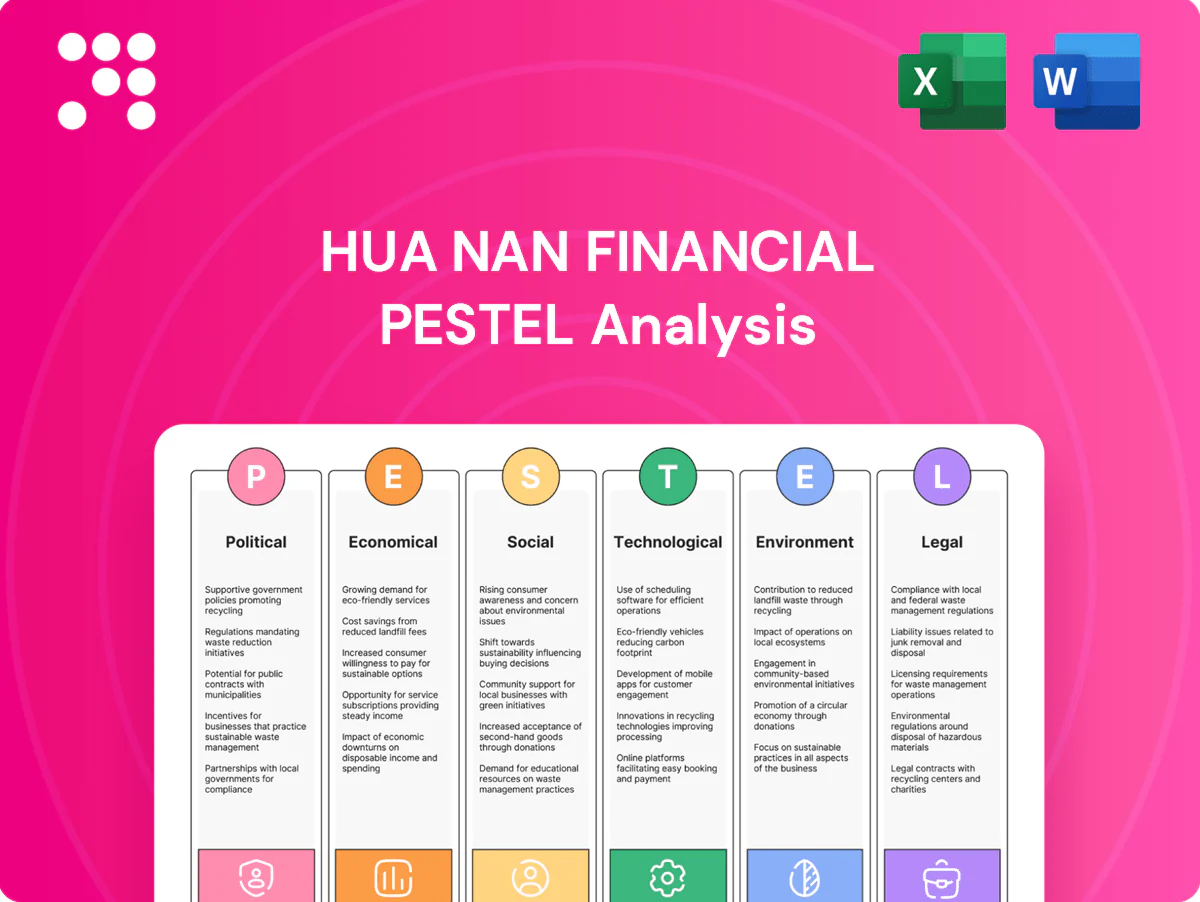
Hua Nan Financial PESTLE Analysis

Your Shortcut to Market Insight Starts Here
Stay ahead with our concise PESTLE snapshot of Hua Nan Financial—highlighting regulatory shifts, macroeconomic pressures, tech disruption, social trends, and environmental risks shaping its trajectory. These targeted insights reveal strategic vulnerabilities and growth levers you can act on now. Purchase the full PESTLE for a deep, ready-to-use briefing that powers smarter investment and strategic decisions.
Political factors

Cross-strait geopolitical risk
Heightened China–Taiwan tensions can sharply weaken investor sentiment and spur capital flight across banking, securities and insurance; Taiwan's pivotal role in semiconductors (TSMC >50% global foundry share in 2024) amplifies systemic exposure. Contingency planning for sanctions, capital controls or temporary market closures is essential, including diversified funding and regional hedges. Rising political risk premiums have translated into wider credit spreads and higher funding costs, compressing margins.
Regulatory oversight intensity
Taiwan’s Financial Supervisory Commission (established 2004) closely supervises banks, brokers and insurers, enforcing rigorous capital, liquidity and conduct standards with banks generally keeping capital ratios above the Basel III 8% minimum. Heightened post-2023 supervision can tighten lending and product approvals, raising compliance costs but bolstering trust, and making cross-entity coordination in financial holdings critical.

Public policy on fintech and digital
Taiwan's FSC has pushed fintech growth via a regulatory sandbox since 2017 and updated e-KYC guidelines in 2021, enabling remote onboarding and faster digital payments adoption. Policy incentives and pilot programs have accelerated product digitization and bank-fintech partnerships, while the approval of three virtual banks in 2019–2020 showed rising competition. New licensing frameworks may further increase entrants, so early alignment with pilots can secure first-mover advantages for Hua Nan.

Industrial and SME policy priorities
Taiwan’s policy prioritises SMEs—which comprise over 97% of firms and employ about 78% of the workforce—alongside strategic industries like semiconductors and green tech, driving strong, policy-backed credit demand for Hua Nan Financial. Targeted lending programs and government guarantees can lower risk weights and lift loan volumes, while political cycles alter subsidy availability and eligibility, affecting originations and provisioning. Aligning Hua Nan’s portfolio with policy sectors tends to improve asset quality and cross-sell opportunities.
- SME share: >97% of firms
- SME employment: ~78%
- Policy support raises targeted-lending volumes
- Political cycles change subsidy criteria and timing
Public health and disaster preparedness
Government disaster-response and epidemic policies (WHO PHEIC ended May 5, 2023) continue to shape Hua Nan Financial branch operations and claims patterns, with regulatory guidance driving contingency activation and claim triage protocols.
Strong interagency coordination preserves cash access, payments and underwriting continuity; political funding for resilience upgrades can lower systemic risk, while execution readiness determines service disruption and reputational exposure.
- Policy trigger: WHO PHEIC end May 5, 2023
- Focus: continuity of cash, payments, underwriting
- Risk mitigant: public funding for resilience
- Key limiter: operational execution readiness
China–Taiwan tensions raise systemic risk as chip foundries hold >50% share
Heightened China–Taiwan tensions and Taiwan's semiconductor centrality (TSMC >50% foundry share in 2024) raise systemic risk and funding costs; FSC supervision (est. 2004) tightens compliance and lending approvals. Fintech sandbox (2017) and three virtual banks (2019–20) boost digital competition; SME focus (>97% firms; ~78% employment) sustains policy-backed lending demand.
| Metric | Value |
|---|---|
| TSMC foundry share (2024) | >50% |
| SME share of firms | >97% |
| SME employment | ~78% |
| FSC established | 2004 |
What is included in the product
 Detailed Word Document
Provides a concise PESTLE assessment of Hua Nan Financial across Political, Economic, Social, Technological, Environmental and Legal dimensions, using current market and regulatory data to identify risks and opportunities. Designed for executives and investors, it offers actionable, forward‑looking insights ready for reports and strategy planning.

 Customizable Excel Spreadsheet
A concise, visually segmented PESTLE summary for Hua Nan Financial that simplifies external risk assessment, is editable for local context or business lines, and is drop-in ready for presentations or quick team alignment.
Economic factors

Interest rate cycle sensitivity
Net interest margins at Hua Nan closely follow CBC policy (CBC benchmark at 1.875% mid‑2025) and global rate paths (US federal funds 5.25–5.50% mid‑2025), making NIM highly cyclical. Repricing gaps between deposits, loans and securities create earnings volatility as short‑term funding resets faster than long‑dated assets. As rates normalize, duration exposure and disciplined hedging will be critical; fee income can partially offset NIM compression.
Taiwan export and tech cycle
Taiwan's economy remains heavily leveraged to semiconductors and global electronics demand, with semiconductors and electronics representing roughly 30% of merchandise exports and TSMC reporting ~US$64bn revenue in 2024. Credit growth and household wealth rose in upcycles—bank credit expanded about 3% in 2024—but contracted during inventory corrections. Securities brokerage volumes (avg daily TWSE turnover ~NT$200bn in 2024) track equity sentiment. Diversified corporate and SME exposure helps Hua Nan Financial mitigate pure tech cyclicality.

Property market dynamics
Real estate lending—about 16% of Hua Nan Financials total loans in 2024—influences credit risk and capital planning as collateral values shift. Macroprudential tightening in Taiwan has cooled mortgage originations and construction lending, trimming growth. Price corrections elevate NPL risk and drove Hua Nan to hold a 0.31% NPL ratio and higher provisions in 2024. Conservative LTV limits and periodic stress tests underpin solvency.

FX and cross-border exposures
Movements in TWD/USD (range ~29–33 in 2024) and USD/CNY (~7.0–7.4 in 2024–H1 2025) materially affect Hua Nan Financials trading income, client demand and hedging costs; offshore subsidiaries and customers add translation and transaction risk across books. Robust treasury risk limits (VaR, stop‑loss and tenor limits) are critical in volatile FX markets, while FX wealth products can diversify fee pools.
- TWD/USD 29–33 (2024)
- USD/CNY 7.0–7.4 (2024–H1 2025)
- Translation/transaction risk: offshore subsidiaries
- Mitigation: VaR, stop‑loss, tenor limits
- Revenue: FX wealth products diversify fees
Labor costs and productivity
Wage inflation in Taiwan (≈3.5% in 2024) pressures Hua Nan Financials cost-to-income ratios across branches and call centers, while automation and straight-through processing (STP) can cut back-office costs by roughly 20–25%. Outsourcing and shared services lift scale efficiency, and incentive realignment has raised cross-selling and retention metrics in peers by ~5–10%.
- Wage inflation ~3.5% (2024)
- Automation/STP cost reduction ~20–25%
- Outsourcing efficiency gain ~10–15%
- Incentive-driven cross-sell uplift ~5–10%
China–Taiwan tensions raise systemic risk as chip foundries hold >50% share
Hua Nan's NIMs remain cyclical, tracking CBC (1.875% mid‑2025) and global rates (US Fed 5.25–5.50% mid‑2025), while fee income and hedging offset volatility. Taiwan exposure to semiconductors (≈30% exports) and 3% bank credit growth in 2024 drives cyclical lending demand. Real‑estate loans 16% of book and NPLs 0.31% (2024) tie asset quality to property trends. FX swings (TWD/USD 29–33; USD/CNY 7.0–7.4) affect trading and hedging costs.
| Metric | Value |
|---|---|
| CBC policy | 1.875% (mid‑2025) |
| US Fed | 5.25–5.50% (mid‑2025) |
| TWD/USD | 29–33 (2024) |
| USD/CNY | 7.0–7.4 (2024–H1 2025) |
| Real‑estate loans | 16% (2024) |
| NPL ratio | 0.31% (2024) |
| Wage inflation | ≈3.5% (2024) |
Same Document Delivered
Hua Nan Financial PESTLE Analysis
This Hua Nan Financial PESTLE analysis preview is the exact document you’ll receive after purchase—fully formatted and ready to use. The layout, content, and structure shown here are exactly what you’ll be able to download immediately after buying. No placeholders, no teasers—this is the real, finished file you’ll own after checkout.

Your Shortcut to Market Insight Starts Here
Stay ahead with our concise PESTLE snapshot of Hua Nan Financial—highlighting regulatory shifts, macroeconomic pressures, tech disruption, social trends, and environmental risks shaping its trajectory. These targeted insights reveal strategic vulnerabilities and growth levers you can act on now. Purchase the full PESTLE for a deep, ready-to-use briefing that powers smarter investment and strategic decisions.
Political factors
Cross-strait geopolitical risk
Heightened China–Taiwan tensions can sharply weaken investor sentiment and spur capital flight across banking, securities and insurance; Taiwan's pivotal role in semiconductors (TSMC >50% global foundry share in 2024) amplifies systemic exposure. Contingency planning for sanctions, capital controls or temporary market closures is essential, including diversified funding and regional hedges. Rising political risk premiums have translated into wider credit spreads and higher funding costs, compressing margins.
Regulatory oversight intensity
Taiwan’s Financial Supervisory Commission (established 2004) closely supervises banks, brokers and insurers, enforcing rigorous capital, liquidity and conduct standards with banks generally keeping capital ratios above the Basel III 8% minimum. Heightened post-2023 supervision can tighten lending and product approvals, raising compliance costs but bolstering trust, and making cross-entity coordination in financial holdings critical.
Public policy on fintech and digital
Taiwan's FSC has pushed fintech growth via a regulatory sandbox since 2017 and updated e-KYC guidelines in 2021, enabling remote onboarding and faster digital payments adoption. Policy incentives and pilot programs have accelerated product digitization and bank-fintech partnerships, while the approval of three virtual banks in 2019–2020 showed rising competition. New licensing frameworks may further increase entrants, so early alignment with pilots can secure first-mover advantages for Hua Nan.
Industrial and SME policy priorities
Taiwan’s policy prioritises SMEs—which comprise over 97% of firms and employ about 78% of the workforce—alongside strategic industries like semiconductors and green tech, driving strong, policy-backed credit demand for Hua Nan Financial. Targeted lending programs and government guarantees can lower risk weights and lift loan volumes, while political cycles alter subsidy availability and eligibility, affecting originations and provisioning. Aligning Hua Nan’s portfolio with policy sectors tends to improve asset quality and cross-sell opportunities.
- SME share: >97% of firms
- SME employment: ~78%
- Policy support raises targeted-lending volumes
- Political cycles change subsidy criteria and timing
Public health and disaster preparedness
Government disaster-response and epidemic policies (WHO PHEIC ended May 5, 2023) continue to shape Hua Nan Financial branch operations and claims patterns, with regulatory guidance driving contingency activation and claim triage protocols.
Strong interagency coordination preserves cash access, payments and underwriting continuity; political funding for resilience upgrades can lower systemic risk, while execution readiness determines service disruption and reputational exposure.
- Policy trigger: WHO PHEIC end May 5, 2023
- Focus: continuity of cash, payments, underwriting
- Risk mitigant: public funding for resilience
- Key limiter: operational execution readiness
China–Taiwan tensions raise systemic risk as chip foundries hold >50% share
Heightened China–Taiwan tensions and Taiwan's semiconductor centrality (TSMC >50% foundry share in 2024) raise systemic risk and funding costs; FSC supervision (est. 2004) tightens compliance and lending approvals. Fintech sandbox (2017) and three virtual banks (2019–20) boost digital competition; SME focus (>97% firms; ~78% employment) sustains policy-backed lending demand.
| Metric | Value |
|---|---|
| TSMC foundry share (2024) | >50% |
| SME share of firms | >97% |
| SME employment | ~78% |
| FSC established | 2004 |
What is included in the product
Detailed Word Document
Provides a concise PESTLE assessment of Hua Nan Financial across Political, Economic, Social, Technological, Environmental and Legal dimensions, using current market and regulatory data to identify risks and opportunities. Designed for executives and investors, it offers actionable, forward‑looking insights ready for reports and strategy planning.
Customizable Excel Spreadsheet
A concise, visually segmented PESTLE summary for Hua Nan Financial that simplifies external risk assessment, is editable for local context or business lines, and is drop-in ready for presentations or quick team alignment.
Economic factors
Interest rate cycle sensitivity
Net interest margins at Hua Nan closely follow CBC policy (CBC benchmark at 1.875% mid‑2025) and global rate paths (US federal funds 5.25–5.50% mid‑2025), making NIM highly cyclical. Repricing gaps between deposits, loans and securities create earnings volatility as short‑term funding resets faster than long‑dated assets. As rates normalize, duration exposure and disciplined hedging will be critical; fee income can partially offset NIM compression.
Taiwan export and tech cycle
Taiwan's economy remains heavily leveraged to semiconductors and global electronics demand, with semiconductors and electronics representing roughly 30% of merchandise exports and TSMC reporting ~US$64bn revenue in 2024. Credit growth and household wealth rose in upcycles—bank credit expanded about 3% in 2024—but contracted during inventory corrections. Securities brokerage volumes (avg daily TWSE turnover ~NT$200bn in 2024) track equity sentiment. Diversified corporate and SME exposure helps Hua Nan Financial mitigate pure tech cyclicality.
Property market dynamics
Real estate lending—about 16% of Hua Nan Financials total loans in 2024—influences credit risk and capital planning as collateral values shift. Macroprudential tightening in Taiwan has cooled mortgage originations and construction lending, trimming growth. Price corrections elevate NPL risk and drove Hua Nan to hold a 0.31% NPL ratio and higher provisions in 2024. Conservative LTV limits and periodic stress tests underpin solvency.
FX and cross-border exposures
Movements in TWD/USD (range ~29–33 in 2024) and USD/CNY (~7.0–7.4 in 2024–H1 2025) materially affect Hua Nan Financials trading income, client demand and hedging costs; offshore subsidiaries and customers add translation and transaction risk across books. Robust treasury risk limits (VaR, stop‑loss and tenor limits) are critical in volatile FX markets, while FX wealth products can diversify fee pools.
- TWD/USD 29–33 (2024)
- USD/CNY 7.0–7.4 (2024–H1 2025)
- Translation/transaction risk: offshore subsidiaries
- Mitigation: VaR, stop‑loss, tenor limits
- Revenue: FX wealth products diversify fees
Labor costs and productivity
Wage inflation in Taiwan (≈3.5% in 2024) pressures Hua Nan Financials cost-to-income ratios across branches and call centers, while automation and straight-through processing (STP) can cut back-office costs by roughly 20–25%. Outsourcing and shared services lift scale efficiency, and incentive realignment has raised cross-selling and retention metrics in peers by ~5–10%.
- Wage inflation ~3.5% (2024)
- Automation/STP cost reduction ~20–25%
- Outsourcing efficiency gain ~10–15%
- Incentive-driven cross-sell uplift ~5–10%
China–Taiwan tensions raise systemic risk as chip foundries hold >50% share
Hua Nan's NIMs remain cyclical, tracking CBC (1.875% mid‑2025) and global rates (US Fed 5.25–5.50% mid‑2025), while fee income and hedging offset volatility. Taiwan exposure to semiconductors (≈30% exports) and 3% bank credit growth in 2024 drives cyclical lending demand. Real‑estate loans 16% of book and NPLs 0.31% (2024) tie asset quality to property trends. FX swings (TWD/USD 29–33; USD/CNY 7.0–7.4) affect trading and hedging costs.
| Metric | Value |
|---|---|
| CBC policy | 1.875% (mid‑2025) |
| US Fed | 5.25–5.50% (mid‑2025) |
| TWD/USD | 29–33 (2024) |
| USD/CNY | 7.0–7.4 (2024–H1 2025) |
| Real‑estate loans | 16% (2024) |
| NPL ratio | 0.31% (2024) |
| Wage inflation | ≈3.5% (2024) |
Same Document Delivered
Hua Nan Financial PESTLE Analysis
This Hua Nan Financial PESTLE analysis preview is the exact document you’ll receive after purchase—fully formatted and ready to use. The layout, content, and structure shown here are exactly what you’ll be able to download immediately after buying. No placeholders, no teasers—this is the real, finished file you’ll own after checkout.
Original: $10.00
-65%$10.00
$3.50Description
Your Shortcut to Market Insight Starts Here
Stay ahead with our concise PESTLE snapshot of Hua Nan Financial—highlighting regulatory shifts, macroeconomic pressures, tech disruption, social trends, and environmental risks shaping its trajectory. These targeted insights reveal strategic vulnerabilities and growth levers you can act on now. Purchase the full PESTLE for a deep, ready-to-use briefing that powers smarter investment and strategic decisions.
Political factors
Cross-strait geopolitical risk
Heightened China–Taiwan tensions can sharply weaken investor sentiment and spur capital flight across banking, securities and insurance; Taiwan's pivotal role in semiconductors (TSMC >50% global foundry share in 2024) amplifies systemic exposure. Contingency planning for sanctions, capital controls or temporary market closures is essential, including diversified funding and regional hedges. Rising political risk premiums have translated into wider credit spreads and higher funding costs, compressing margins.
Regulatory oversight intensity
Taiwan’s Financial Supervisory Commission (established 2004) closely supervises banks, brokers and insurers, enforcing rigorous capital, liquidity and conduct standards with banks generally keeping capital ratios above the Basel III 8% minimum. Heightened post-2023 supervision can tighten lending and product approvals, raising compliance costs but bolstering trust, and making cross-entity coordination in financial holdings critical.
Public policy on fintech and digital
Taiwan's FSC has pushed fintech growth via a regulatory sandbox since 2017 and updated e-KYC guidelines in 2021, enabling remote onboarding and faster digital payments adoption. Policy incentives and pilot programs have accelerated product digitization and bank-fintech partnerships, while the approval of three virtual banks in 2019–2020 showed rising competition. New licensing frameworks may further increase entrants, so early alignment with pilots can secure first-mover advantages for Hua Nan.
Industrial and SME policy priorities
Taiwan’s policy prioritises SMEs—which comprise over 97% of firms and employ about 78% of the workforce—alongside strategic industries like semiconductors and green tech, driving strong, policy-backed credit demand for Hua Nan Financial. Targeted lending programs and government guarantees can lower risk weights and lift loan volumes, while political cycles alter subsidy availability and eligibility, affecting originations and provisioning. Aligning Hua Nan’s portfolio with policy sectors tends to improve asset quality and cross-sell opportunities.
- SME share: >97% of firms
- SME employment: ~78%
- Policy support raises targeted-lending volumes
- Political cycles change subsidy criteria and timing
Public health and disaster preparedness
Government disaster-response and epidemic policies (WHO PHEIC ended May 5, 2023) continue to shape Hua Nan Financial branch operations and claims patterns, with regulatory guidance driving contingency activation and claim triage protocols.
Strong interagency coordination preserves cash access, payments and underwriting continuity; political funding for resilience upgrades can lower systemic risk, while execution readiness determines service disruption and reputational exposure.
- Policy trigger: WHO PHEIC end May 5, 2023
- Focus: continuity of cash, payments, underwriting
- Risk mitigant: public funding for resilience
- Key limiter: operational execution readiness
China–Taiwan tensions raise systemic risk as chip foundries hold >50% share
Heightened China–Taiwan tensions and Taiwan's semiconductor centrality (TSMC >50% foundry share in 2024) raise systemic risk and funding costs; FSC supervision (est. 2004) tightens compliance and lending approvals. Fintech sandbox (2017) and three virtual banks (2019–20) boost digital competition; SME focus (>97% firms; ~78% employment) sustains policy-backed lending demand.
| Metric | Value |
|---|---|
| TSMC foundry share (2024) | >50% |
| SME share of firms | >97% |
| SME employment | ~78% |
| FSC established | 2004 |
What is included in the product
Detailed Word Document
Provides a concise PESTLE assessment of Hua Nan Financial across Political, Economic, Social, Technological, Environmental and Legal dimensions, using current market and regulatory data to identify risks and opportunities. Designed for executives and investors, it offers actionable, forward‑looking insights ready for reports and strategy planning.
Customizable Excel Spreadsheet
A concise, visually segmented PESTLE summary for Hua Nan Financial that simplifies external risk assessment, is editable for local context or business lines, and is drop-in ready for presentations or quick team alignment.
Economic factors
Interest rate cycle sensitivity
Net interest margins at Hua Nan closely follow CBC policy (CBC benchmark at 1.875% mid‑2025) and global rate paths (US federal funds 5.25–5.50% mid‑2025), making NIM highly cyclical. Repricing gaps between deposits, loans and securities create earnings volatility as short‑term funding resets faster than long‑dated assets. As rates normalize, duration exposure and disciplined hedging will be critical; fee income can partially offset NIM compression.
Taiwan export and tech cycle
Taiwan's economy remains heavily leveraged to semiconductors and global electronics demand, with semiconductors and electronics representing roughly 30% of merchandise exports and TSMC reporting ~US$64bn revenue in 2024. Credit growth and household wealth rose in upcycles—bank credit expanded about 3% in 2024—but contracted during inventory corrections. Securities brokerage volumes (avg daily TWSE turnover ~NT$200bn in 2024) track equity sentiment. Diversified corporate and SME exposure helps Hua Nan Financial mitigate pure tech cyclicality.
Property market dynamics
Real estate lending—about 16% of Hua Nan Financials total loans in 2024—influences credit risk and capital planning as collateral values shift. Macroprudential tightening in Taiwan has cooled mortgage originations and construction lending, trimming growth. Price corrections elevate NPL risk and drove Hua Nan to hold a 0.31% NPL ratio and higher provisions in 2024. Conservative LTV limits and periodic stress tests underpin solvency.
FX and cross-border exposures
Movements in TWD/USD (range ~29–33 in 2024) and USD/CNY (~7.0–7.4 in 2024–H1 2025) materially affect Hua Nan Financials trading income, client demand and hedging costs; offshore subsidiaries and customers add translation and transaction risk across books. Robust treasury risk limits (VaR, stop‑loss and tenor limits) are critical in volatile FX markets, while FX wealth products can diversify fee pools.
- TWD/USD 29–33 (2024)
- USD/CNY 7.0–7.4 (2024–H1 2025)
- Translation/transaction risk: offshore subsidiaries
- Mitigation: VaR, stop‑loss, tenor limits
- Revenue: FX wealth products diversify fees
Labor costs and productivity
Wage inflation in Taiwan (≈3.5% in 2024) pressures Hua Nan Financials cost-to-income ratios across branches and call centers, while automation and straight-through processing (STP) can cut back-office costs by roughly 20–25%. Outsourcing and shared services lift scale efficiency, and incentive realignment has raised cross-selling and retention metrics in peers by ~5–10%.
- Wage inflation ~3.5% (2024)
- Automation/STP cost reduction ~20–25%
- Outsourcing efficiency gain ~10–15%
- Incentive-driven cross-sell uplift ~5–10%
China–Taiwan tensions raise systemic risk as chip foundries hold >50% share
Hua Nan's NIMs remain cyclical, tracking CBC (1.875% mid‑2025) and global rates (US Fed 5.25–5.50% mid‑2025), while fee income and hedging offset volatility. Taiwan exposure to semiconductors (≈30% exports) and 3% bank credit growth in 2024 drives cyclical lending demand. Real‑estate loans 16% of book and NPLs 0.31% (2024) tie asset quality to property trends. FX swings (TWD/USD 29–33; USD/CNY 7.0–7.4) affect trading and hedging costs.
| Metric | Value |
|---|---|
| CBC policy | 1.875% (mid‑2025) |
| US Fed | 5.25–5.50% (mid‑2025) |
| TWD/USD | 29–33 (2024) |
| USD/CNY | 7.0–7.4 (2024–H1 2025) |
| Real‑estate loans | 16% (2024) |
| NPL ratio | 0.31% (2024) |
| Wage inflation | ≈3.5% (2024) |
Same Document Delivered
Hua Nan Financial PESTLE Analysis
This Hua Nan Financial PESTLE analysis preview is the exact document you’ll receive after purchase—fully formatted and ready to use. The layout, content, and structure shown here are exactly what you’ll be able to download immediately after buying. No placeholders, no teasers—this is the real, finished file you’ll own after checkout.











