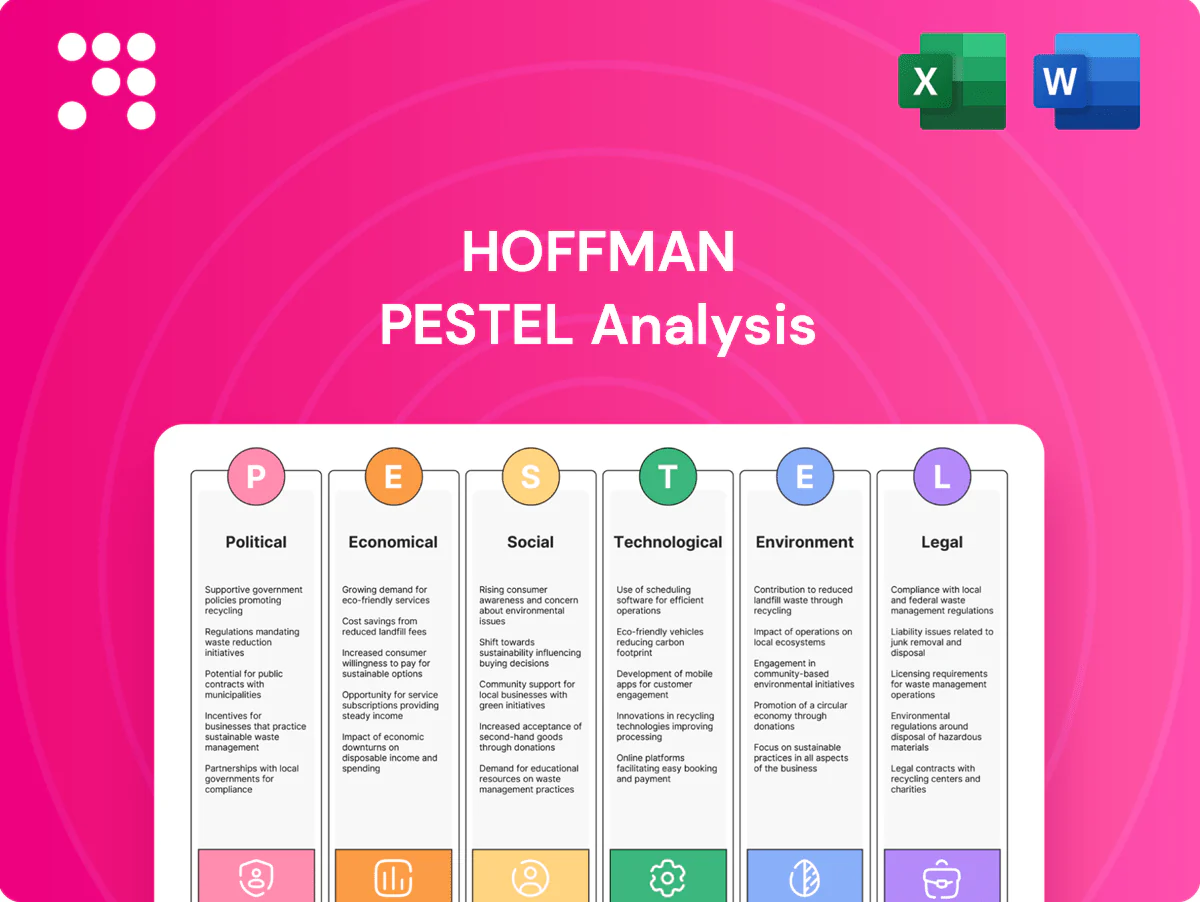
Hoffman PESTLE Analysis

Make Smarter Strategic Decisions with a Complete PESTEL View
Gain a competitive edge with our PESTLE Analysis of Hoffman. It reveals political, economic, social, technological, legal, and environmental forces shaping strategy and risk, with clear implications for investors and planners. Purchase the full report for complete, editable intelligence ready for immediate use.
Political factors

Public funding cycles
Government budgets for healthcare (US national health expenditures reached about $4.5 trillion in 2023) and infrastructure (the Bipartisan Infrastructure Law commits roughly $550 billion new investment through 2026) drive project pipelines, while shifts in federal and state appropriations can accelerate or delay starts. Monitoring municipal bond issuance (over $400 billion annually recently) and capital plans helps forecast backlog, and advocacy/relationships give early visibility into opportunities.
Permitting and approvals
Local zoning, environmental review and building approvals set timelines that often add 3–18 months to project schedules, raising carrying costs (commonly 2–5% of project value per year) and schedule risk; a 2024 industry survey reported 60% of planners see lengthening permit times. Political leadership changes can tighten or relax standards, while predictable approvals and proactive agency coordination materially shorten timelines and reduce holding costs.

Procurement policies
Public sector rules favoring competitive bidding and best-value source selection under FAR directly compress margins by shifting awards from low-bid to value-based criteria, affecting pricing strategy. Statutory small business contracting goals (23% federal target) and diversity mandates force Hoffman into specific teaming and subcontracting models. Broader eligibility for design-build has raised its share of public construction to roughly half of projects by value, expanding addressable markets. Clear, auditable compliance programs measurably improve award competitiveness.

Labor and immigration stance
Prevailing wage rules such as the Davis-Bacon Act raise labor costs on federal contracts and, together with union policies, shape availability and scheduling; US union membership was 10.1% in 2023 (BLS). Immigration enforcement tightens the pipeline for skilled trades, exacerbating an estimated craft-worker shortfall of about 430,000 in 2023 (AGC). Apprenticeship incentives and targeted workforce development reduce bottlenecks and soften policy volatility.
- Prevailing wage: Davis-Bacon impact on federal project costs
- Union rate: 10.1% (2023, BLS)
- Supply gap: ~430,000 craft-worker shortfall (AGC 2023)
- Mitigation: apprenticeships & workforce development
Trade and industrial policy
Tariffs (Section 301 rates ~7.5–25%) and Buy America rules materially raise component costs and constrain sourcing; CHIPS ($52B) and the Inflation Reduction Act ($369B) are driving large semiconductor and clean-energy plants—TSMC ~$40B and Samsung ~$17B in US projects—while rapid policy shifts can whipsaw procurement plans, so flexible vendor networks preserve schedule certainty.
- Tariffs: Section 301 ~7.5–25%
- Incentives: CHIPS $52B, IRA $369B
- Fab investments: TSMC ~$40B, Samsung ~$17B
- Mitigation: diversify vendors to protect schedules
Federal funding, bond flows and tariffs reshape US infrastructure pipelines and labor costs
Federal/state budgets (US health $4.5T 2023; infra $550B through 2026) drive pipelines; bond issuance (~$400B/yr) and procurement rules shift timing and margins. Permitting adds 3–18 months and 2–5% annual carrying cost; Davis‑Bacon, union rates (10.1% 2023) and a ~430k craft shortfall raise labor risk. Tariffs (Section 301 7.5–25%) and Buy America plus CHIPS $52B/IRA $369B reshape sourcing and project mix.
| Tag | Value |
|---|---|
| Health Spend 2023 | $4.5T |
| Infra Law | $550B thru 2026 |
| Bond Issuance | ~$400B/yr |
| Union rate | 10.1% (2023) |
| Craft gap | ~430k (2023) |
| Tariffs | 7.5–25% |
| Incentives | CHIPS $52B; IRA $369B |
What is included in the product
 Detailed Word Document
Explores how external macro-environmental factors uniquely affect the Hoffman across Political, Economic, Social, Technological, Environmental, and Legal dimensions, with each category expanded into detailed, business-specific sub-points and examples. Backed by current data and forward-looking insights, it’s designed to help executives, consultants, and entrepreneurs identify threats, opportunities, and actionable strategies for planning and funding.

 Customizable Excel Spreadsheet
A clean, summarized and visually segmented Hoffman PESTLE that’s editable and shareable, enabling quick interpretation, note-taking by region or business line, and seamless drop-into presentations for fast alignment across teams.
Economic factors

Interest rate environment
Higher rates — with the fed funds target near 5.25–5.50% and 10-year Treasury around 4.2% in mid-2025 — raise owner financing costs and can defer private starts. Public projects often proceed but face rebids and price pressure. Rate stability improves forecasting for GMP and CMAR contracts. Active hedging and value engineering help protect award win rates.
Material cost volatility
Steel, concrete and electrical gear saw price swings of up to 15% in 2024, materially stressing Hoffman project budgets. Escalation clauses and indexed bids moved a portion of that volatility to owners, commonly sharing 50–70% of raw-material risk on large contracts. Early buyout and bulk purchasing lowered variance and locked prices, often trimming cost exposure by double digits. Transparent cost tracking during 2024–25 maintained client trust on complex builds.

Sector capital spend
Sector capital spend for Hoffman is driven by healthcare, higher education and tech capex cycles—data centers and life sciences labs demand specialized MEP and cleanroom capabilities and account for concentrated project value; MarketsandMarkets projects the global data center market to reach 259.7 billion USD by 2027. Diversification across these sectors reduces revenue volatility, and targeted preconstruction services capture early design influence to secure higher-margin scope.

Labor market tightness
Skilled trades scarcity is tightening margins and subcontractor leverage, while national unemployment stayed near 3.7% (BLS, June 2025), keeping upward pressure on wages. Productivity tools and prefabrication partially offset headcount gaps; long-term subcontractor partnerships lock capacity and safety/training investments cut rework and downtime.
- Wage inflation & subcontractor leverage
- Prefabrication/productivity offset
- Long-term subcontractor capacity
- Safety/training reduce rework
Supply chain resilience
Lead times for switchgear (20–30 weeks), HVAC (16–24 weeks) and specialty glass (24–40 weeks) remained extended in 2024; 62% of contractors adopted dual sourcing and regional suppliers to cut disruption risk. Adding 10–15% schedule buffers and modularization de-risk critical paths, while digital tracking cut delivery delays by ~15% in 2024 surveys.
- Lead times: switchgear 20–30w, HVAC 16–24w, glass 24–40w
- 62% dual sourcing
- 10–15% schedule buffers
- Digital tracking ≈15% fewer delays
Federal funding, bond flows and tariffs reshape US infrastructure pipelines and labor costs
Higher rates (fed funds 5.25–5.50%, 10y ≈4.2% mid‑2025) raise financing and push private starts to delay; public work faces rebids. Material price swings up to 15% in 2024 stressed budgets; escalation clauses shifted 50–70% raw‑material risk. Unemployment ~3.7% (June 2025) keeps wage pressure; prefabrication and hedging cut volatility.
| Metric | Value |
|---|---|
| Fed funds | 5.25–5.50% |
| 10y Treasury | ≈4.2% |
| Material swings 2024 | ≤15% |
| Unemployment | 3.7% (Jun 2025) |
| Dual sourcing | 62% |
What You See Is What You Get
Hoffman PESTLE Analysis
The Hoffman PESTLE Analysis preview shown here is the exact document you’ll receive after purchase—fully formatted and ready to use. The layout, content, and structure visible are identical to the downloadable file you’ll get immediately after payment. No placeholders or teasers; this is the real, final version ready for implementation.

Make Smarter Strategic Decisions with a Complete PESTEL View
Gain a competitive edge with our PESTLE Analysis of Hoffman. It reveals political, economic, social, technological, legal, and environmental forces shaping strategy and risk, with clear implications for investors and planners. Purchase the full report for complete, editable intelligence ready for immediate use.
Political factors
Public funding cycles
Government budgets for healthcare (US national health expenditures reached about $4.5 trillion in 2023) and infrastructure (the Bipartisan Infrastructure Law commits roughly $550 billion new investment through 2026) drive project pipelines, while shifts in federal and state appropriations can accelerate or delay starts. Monitoring municipal bond issuance (over $400 billion annually recently) and capital plans helps forecast backlog, and advocacy/relationships give early visibility into opportunities.
Permitting and approvals
Local zoning, environmental review and building approvals set timelines that often add 3–18 months to project schedules, raising carrying costs (commonly 2–5% of project value per year) and schedule risk; a 2024 industry survey reported 60% of planners see lengthening permit times. Political leadership changes can tighten or relax standards, while predictable approvals and proactive agency coordination materially shorten timelines and reduce holding costs.
Procurement policies
Public sector rules favoring competitive bidding and best-value source selection under FAR directly compress margins by shifting awards from low-bid to value-based criteria, affecting pricing strategy. Statutory small business contracting goals (23% federal target) and diversity mandates force Hoffman into specific teaming and subcontracting models. Broader eligibility for design-build has raised its share of public construction to roughly half of projects by value, expanding addressable markets. Clear, auditable compliance programs measurably improve award competitiveness.
Labor and immigration stance
Prevailing wage rules such as the Davis-Bacon Act raise labor costs on federal contracts and, together with union policies, shape availability and scheduling; US union membership was 10.1% in 2023 (BLS). Immigration enforcement tightens the pipeline for skilled trades, exacerbating an estimated craft-worker shortfall of about 430,000 in 2023 (AGC). Apprenticeship incentives and targeted workforce development reduce bottlenecks and soften policy volatility.
- Prevailing wage: Davis-Bacon impact on federal project costs
- Union rate: 10.1% (2023, BLS)
- Supply gap: ~430,000 craft-worker shortfall (AGC 2023)
- Mitigation: apprenticeships & workforce development
Trade and industrial policy
Tariffs (Section 301 rates ~7.5–25%) and Buy America rules materially raise component costs and constrain sourcing; CHIPS ($52B) and the Inflation Reduction Act ($369B) are driving large semiconductor and clean-energy plants—TSMC ~$40B and Samsung ~$17B in US projects—while rapid policy shifts can whipsaw procurement plans, so flexible vendor networks preserve schedule certainty.
- Tariffs: Section 301 ~7.5–25%
- Incentives: CHIPS $52B, IRA $369B
- Fab investments: TSMC ~$40B, Samsung ~$17B
- Mitigation: diversify vendors to protect schedules
Federal funding, bond flows and tariffs reshape US infrastructure pipelines and labor costs
Federal/state budgets (US health $4.5T 2023; infra $550B through 2026) drive pipelines; bond issuance (~$400B/yr) and procurement rules shift timing and margins. Permitting adds 3–18 months and 2–5% annual carrying cost; Davis‑Bacon, union rates (10.1% 2023) and a ~430k craft shortfall raise labor risk. Tariffs (Section 301 7.5–25%) and Buy America plus CHIPS $52B/IRA $369B reshape sourcing and project mix.
| Tag | Value |
|---|---|
| Health Spend 2023 | $4.5T |
| Infra Law | $550B thru 2026 |
| Bond Issuance | ~$400B/yr |
| Union rate | 10.1% (2023) |
| Craft gap | ~430k (2023) |
| Tariffs | 7.5–25% |
| Incentives | CHIPS $52B; IRA $369B |
What is included in the product
Detailed Word Document
Explores how external macro-environmental factors uniquely affect the Hoffman across Political, Economic, Social, Technological, Environmental, and Legal dimensions, with each category expanded into detailed, business-specific sub-points and examples. Backed by current data and forward-looking insights, it’s designed to help executives, consultants, and entrepreneurs identify threats, opportunities, and actionable strategies for planning and funding.
Customizable Excel Spreadsheet
A clean, summarized and visually segmented Hoffman PESTLE that’s editable and shareable, enabling quick interpretation, note-taking by region or business line, and seamless drop-into presentations for fast alignment across teams.
Economic factors
Interest rate environment
Higher rates — with the fed funds target near 5.25–5.50% and 10-year Treasury around 4.2% in mid-2025 — raise owner financing costs and can defer private starts. Public projects often proceed but face rebids and price pressure. Rate stability improves forecasting for GMP and CMAR contracts. Active hedging and value engineering help protect award win rates.
Material cost volatility
Steel, concrete and electrical gear saw price swings of up to 15% in 2024, materially stressing Hoffman project budgets. Escalation clauses and indexed bids moved a portion of that volatility to owners, commonly sharing 50–70% of raw-material risk on large contracts. Early buyout and bulk purchasing lowered variance and locked prices, often trimming cost exposure by double digits. Transparent cost tracking during 2024–25 maintained client trust on complex builds.
Sector capital spend
Sector capital spend for Hoffman is driven by healthcare, higher education and tech capex cycles—data centers and life sciences labs demand specialized MEP and cleanroom capabilities and account for concentrated project value; MarketsandMarkets projects the global data center market to reach 259.7 billion USD by 2027. Diversification across these sectors reduces revenue volatility, and targeted preconstruction services capture early design influence to secure higher-margin scope.
Labor market tightness
Skilled trades scarcity is tightening margins and subcontractor leverage, while national unemployment stayed near 3.7% (BLS, June 2025), keeping upward pressure on wages. Productivity tools and prefabrication partially offset headcount gaps; long-term subcontractor partnerships lock capacity and safety/training investments cut rework and downtime.
- Wage inflation & subcontractor leverage
- Prefabrication/productivity offset
- Long-term subcontractor capacity
- Safety/training reduce rework
Supply chain resilience
Lead times for switchgear (20–30 weeks), HVAC (16–24 weeks) and specialty glass (24–40 weeks) remained extended in 2024; 62% of contractors adopted dual sourcing and regional suppliers to cut disruption risk. Adding 10–15% schedule buffers and modularization de-risk critical paths, while digital tracking cut delivery delays by ~15% in 2024 surveys.
- Lead times: switchgear 20–30w, HVAC 16–24w, glass 24–40w
- 62% dual sourcing
- 10–15% schedule buffers
- Digital tracking ≈15% fewer delays
Federal funding, bond flows and tariffs reshape US infrastructure pipelines and labor costs
Higher rates (fed funds 5.25–5.50%, 10y ≈4.2% mid‑2025) raise financing and push private starts to delay; public work faces rebids. Material price swings up to 15% in 2024 stressed budgets; escalation clauses shifted 50–70% raw‑material risk. Unemployment ~3.7% (June 2025) keeps wage pressure; prefabrication and hedging cut volatility.
| Metric | Value |
|---|---|
| Fed funds | 5.25–5.50% |
| 10y Treasury | ≈4.2% |
| Material swings 2024 | ≤15% |
| Unemployment | 3.7% (Jun 2025) |
| Dual sourcing | 62% |
What You See Is What You Get
Hoffman PESTLE Analysis
The Hoffman PESTLE Analysis preview shown here is the exact document you’ll receive after purchase—fully formatted and ready to use. The layout, content, and structure visible are identical to the downloadable file you’ll get immediately after payment. No placeholders or teasers; this is the real, final version ready for implementation.
Original: $10.00
-65%$10.00
$3.50Description
Make Smarter Strategic Decisions with a Complete PESTEL View
Gain a competitive edge with our PESTLE Analysis of Hoffman. It reveals political, economic, social, technological, legal, and environmental forces shaping strategy and risk, with clear implications for investors and planners. Purchase the full report for complete, editable intelligence ready for immediate use.
Political factors
Public funding cycles
Government budgets for healthcare (US national health expenditures reached about $4.5 trillion in 2023) and infrastructure (the Bipartisan Infrastructure Law commits roughly $550 billion new investment through 2026) drive project pipelines, while shifts in federal and state appropriations can accelerate or delay starts. Monitoring municipal bond issuance (over $400 billion annually recently) and capital plans helps forecast backlog, and advocacy/relationships give early visibility into opportunities.
Permitting and approvals
Local zoning, environmental review and building approvals set timelines that often add 3–18 months to project schedules, raising carrying costs (commonly 2–5% of project value per year) and schedule risk; a 2024 industry survey reported 60% of planners see lengthening permit times. Political leadership changes can tighten or relax standards, while predictable approvals and proactive agency coordination materially shorten timelines and reduce holding costs.
Procurement policies
Public sector rules favoring competitive bidding and best-value source selection under FAR directly compress margins by shifting awards from low-bid to value-based criteria, affecting pricing strategy. Statutory small business contracting goals (23% federal target) and diversity mandates force Hoffman into specific teaming and subcontracting models. Broader eligibility for design-build has raised its share of public construction to roughly half of projects by value, expanding addressable markets. Clear, auditable compliance programs measurably improve award competitiveness.
Labor and immigration stance
Prevailing wage rules such as the Davis-Bacon Act raise labor costs on federal contracts and, together with union policies, shape availability and scheduling; US union membership was 10.1% in 2023 (BLS). Immigration enforcement tightens the pipeline for skilled trades, exacerbating an estimated craft-worker shortfall of about 430,000 in 2023 (AGC). Apprenticeship incentives and targeted workforce development reduce bottlenecks and soften policy volatility.
- Prevailing wage: Davis-Bacon impact on federal project costs
- Union rate: 10.1% (2023, BLS)
- Supply gap: ~430,000 craft-worker shortfall (AGC 2023)
- Mitigation: apprenticeships & workforce development
Trade and industrial policy
Tariffs (Section 301 rates ~7.5–25%) and Buy America rules materially raise component costs and constrain sourcing; CHIPS ($52B) and the Inflation Reduction Act ($369B) are driving large semiconductor and clean-energy plants—TSMC ~$40B and Samsung ~$17B in US projects—while rapid policy shifts can whipsaw procurement plans, so flexible vendor networks preserve schedule certainty.
- Tariffs: Section 301 ~7.5–25%
- Incentives: CHIPS $52B, IRA $369B
- Fab investments: TSMC ~$40B, Samsung ~$17B
- Mitigation: diversify vendors to protect schedules
Federal funding, bond flows and tariffs reshape US infrastructure pipelines and labor costs
Federal/state budgets (US health $4.5T 2023; infra $550B through 2026) drive pipelines; bond issuance (~$400B/yr) and procurement rules shift timing and margins. Permitting adds 3–18 months and 2–5% annual carrying cost; Davis‑Bacon, union rates (10.1% 2023) and a ~430k craft shortfall raise labor risk. Tariffs (Section 301 7.5–25%) and Buy America plus CHIPS $52B/IRA $369B reshape sourcing and project mix.
| Tag | Value |
|---|---|
| Health Spend 2023 | $4.5T |
| Infra Law | $550B thru 2026 |
| Bond Issuance | ~$400B/yr |
| Union rate | 10.1% (2023) |
| Craft gap | ~430k (2023) |
| Tariffs | 7.5–25% |
| Incentives | CHIPS $52B; IRA $369B |
What is included in the product
Detailed Word Document
Explores how external macro-environmental factors uniquely affect the Hoffman across Political, Economic, Social, Technological, Environmental, and Legal dimensions, with each category expanded into detailed, business-specific sub-points and examples. Backed by current data and forward-looking insights, it’s designed to help executives, consultants, and entrepreneurs identify threats, opportunities, and actionable strategies for planning and funding.
Customizable Excel Spreadsheet
A clean, summarized and visually segmented Hoffman PESTLE that’s editable and shareable, enabling quick interpretation, note-taking by region or business line, and seamless drop-into presentations for fast alignment across teams.
Economic factors
Interest rate environment
Higher rates — with the fed funds target near 5.25–5.50% and 10-year Treasury around 4.2% in mid-2025 — raise owner financing costs and can defer private starts. Public projects often proceed but face rebids and price pressure. Rate stability improves forecasting for GMP and CMAR contracts. Active hedging and value engineering help protect award win rates.
Material cost volatility
Steel, concrete and electrical gear saw price swings of up to 15% in 2024, materially stressing Hoffman project budgets. Escalation clauses and indexed bids moved a portion of that volatility to owners, commonly sharing 50–70% of raw-material risk on large contracts. Early buyout and bulk purchasing lowered variance and locked prices, often trimming cost exposure by double digits. Transparent cost tracking during 2024–25 maintained client trust on complex builds.
Sector capital spend
Sector capital spend for Hoffman is driven by healthcare, higher education and tech capex cycles—data centers and life sciences labs demand specialized MEP and cleanroom capabilities and account for concentrated project value; MarketsandMarkets projects the global data center market to reach 259.7 billion USD by 2027. Diversification across these sectors reduces revenue volatility, and targeted preconstruction services capture early design influence to secure higher-margin scope.
Labor market tightness
Skilled trades scarcity is tightening margins and subcontractor leverage, while national unemployment stayed near 3.7% (BLS, June 2025), keeping upward pressure on wages. Productivity tools and prefabrication partially offset headcount gaps; long-term subcontractor partnerships lock capacity and safety/training investments cut rework and downtime.
- Wage inflation & subcontractor leverage
- Prefabrication/productivity offset
- Long-term subcontractor capacity
- Safety/training reduce rework
Supply chain resilience
Lead times for switchgear (20–30 weeks), HVAC (16–24 weeks) and specialty glass (24–40 weeks) remained extended in 2024; 62% of contractors adopted dual sourcing and regional suppliers to cut disruption risk. Adding 10–15% schedule buffers and modularization de-risk critical paths, while digital tracking cut delivery delays by ~15% in 2024 surveys.
- Lead times: switchgear 20–30w, HVAC 16–24w, glass 24–40w
- 62% dual sourcing
- 10–15% schedule buffers
- Digital tracking ≈15% fewer delays
Federal funding, bond flows and tariffs reshape US infrastructure pipelines and labor costs
Higher rates (fed funds 5.25–5.50%, 10y ≈4.2% mid‑2025) raise financing and push private starts to delay; public work faces rebids. Material price swings up to 15% in 2024 stressed budgets; escalation clauses shifted 50–70% raw‑material risk. Unemployment ~3.7% (June 2025) keeps wage pressure; prefabrication and hedging cut volatility.
| Metric | Value |
|---|---|
| Fed funds | 5.25–5.50% |
| 10y Treasury | ≈4.2% |
| Material swings 2024 | ≤15% |
| Unemployment | 3.7% (Jun 2025) |
| Dual sourcing | 62% |
What You See Is What You Get
Hoffman PESTLE Analysis
The Hoffman PESTLE Analysis preview shown here is the exact document you’ll receive after purchase—fully formatted and ready to use. The layout, content, and structure visible are identical to the downloadable file you’ll get immediately after payment. No placeholders or teasers; this is the real, final version ready for implementation.











