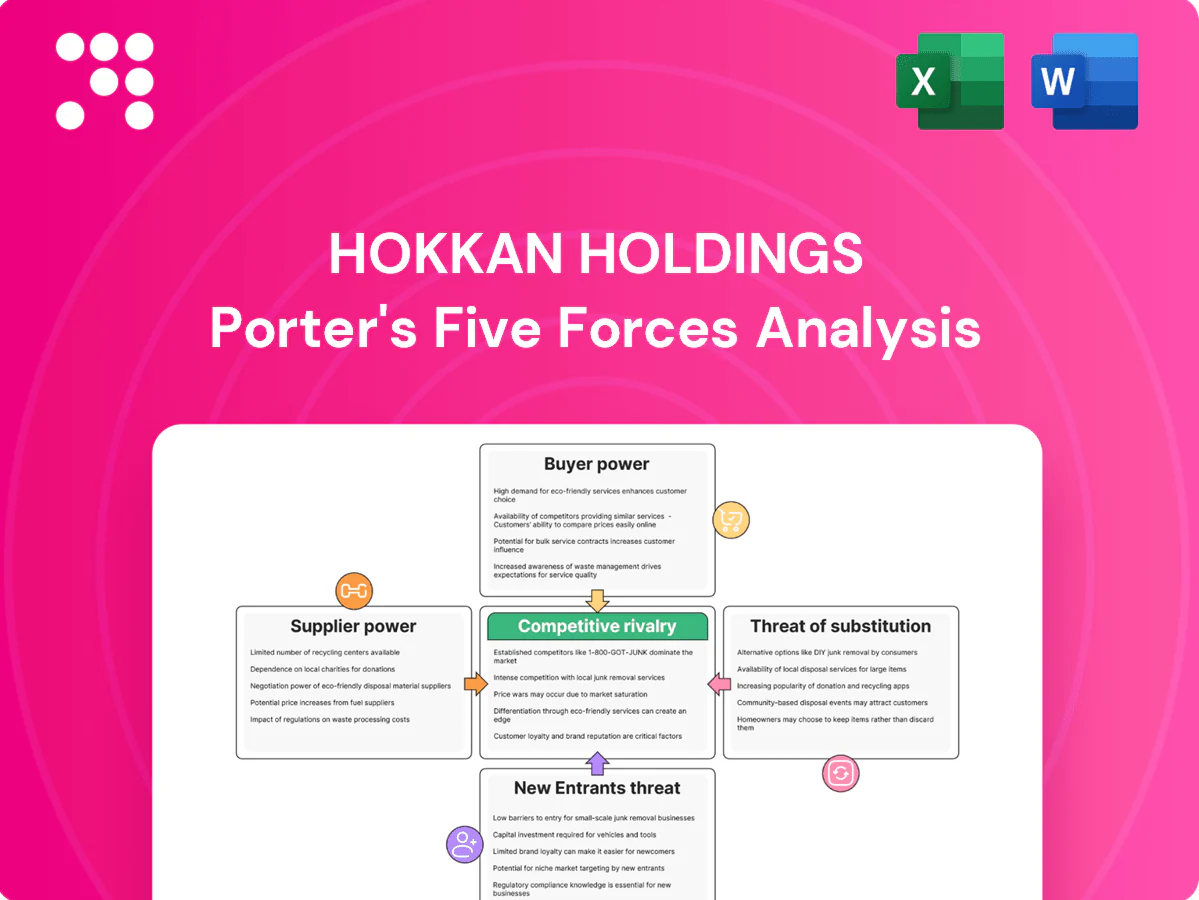
Hokkan Holdings Porter's Five Forces Analysis

Don't Miss the Bigger Picture
Hokkan Holdings faces moderate supplier leverage, evolving buyer expectations, and growing substitute threats as technology reshapes its sector. Competitive rivalry is intensifying with new agile entrants and margin pressure. Regulatory shifts could tilt barriers to entry and long-term profitability. This brief snapshot only scratches the surface—unlock the full Porter's Five Forces Analysis to explore Hokkan Holdings’s competitive dynamics and strategic implications in detail.
Suppliers Bargaining Power

Concentration in metal and resin inputs
Aluminum sheet, steel tinplate and PET resin are sourced from a concentrated set of global/regional producers — China accounted for ≈60% of primary aluminum and ≈56% of crude steel output in 2024, while the top PET producers held ≈45% of global PET capacity (2024). This concentration raises upstream pricing power during tight commodity cycles, with price spikes of 20–30% seen in recent stress periods. Long-term contracts and hedging reduce volatility but rarely eliminate supplier pass-through. Supplier consolidation or smelter curtailments can rapidly increase costs and extend lead times.
Energy and logistics dependency
Can-making and filling are energy- and transport-intensive, exposing Hokkan to utilities, fuel and freight providers; EU wholesale power averaged ~€100/MWh in 2024 and Asia JKM LNG averaged ~12 USD/MMBtu, squeezing margins if costs cannot be passed through. Global spot container rates (FBX) averaged ~1,200 USD/FEU in 2024 and US diesel ~3.8 USD/gal, while port congestion and trucking constraints force higher inventories. Multi-sourcing and nearshoring reduce exposure but require capital investment and 6–18 month planning horizons.

Specialty coatings and closures
Internal can linings, inks and closures come from specialized vendors with proprietary formulations, often governed by FDA 21 CFR food-contact rules that raise testing and documentation burdens. Qualification cycles frequently span 6–18 months, boosting switching costs and supplier leverage when materials become spec-locked to product needs. Suppliers can extract premiums via uniqueness and certification. Joint development can rebalance pricing power but increases technical dependency.

Quality and regulatory compliance
Food-grade certifications such as SQF, BRC and FSSC 22000 and traceability standards give compliant suppliers measurable leverage in 2024; deviation risks recalls and brand damage that materially raise the cost and time of supplier substitution. Audits and dual-qualification programs mitigate single-supplier risk but are time-consuming and costly, reinforcing incumbent suppliers’ influence over pricing and contract terms.
- Certifications: SQF, BRC, FSSC 22000
- Risk: recalls → higher substitution cost
- Mitigation: audits/dual-qualification slow and costly
Commodity price pass-through dynamics
- Index-linked pass-through: cushions margins but delays affect cash flow
- Demand weakness: increases surcharge pushback
- Procurement/scrap recovery: key levers to protect profitability
Upstream pricing power from China concentration, energy/logistics costs, and certification frictions
Supplier concentration (China: ≈60% primary aluminum, ≈56% crude steel; top PET ≈45% capacity) and energy/logistics costs (EU power ≈€100/MWh; JKM ≈$12/MMBtu; FBX ≈$1,200/FEU; US diesel ≈$3.8/gal) give upstreams pricing power. Spec materials and certifications (SQF/BRC/FSSC) raise switching costs and supplier leverage. Index-linked pass-through helps but lags; procurement and scrap recovery are key offsets.
| Item | 2024 |
|---|---|
| Concentration / Costs | Al/Steel/PET 60%/56%/45%; EU power €100/MWh; JKM $12 |
What is included in the product
 Detailed Word Document
Uncovers key drivers of competition, buyer and supplier power, entry barriers, substitutes and rivalry specific to Hokkan Holdings, highlighting disruptive threats, market leverage and strategic safeguards to protect margins and market share.

 Customizable Excel Spreadsheet
A concise one-sheet Porter’s Five Forces for Hokkan Holdings that pinpoints strategic pain points and competitive pressures at a glance; customizable pressure levels and an instant radar visualization simplify decision-making for executives and investors.
Customers Bargaining Power

Large beverage brand concentration
Large global and national beverage brands buy huge volumes and negotiate aggressively, issuing regular RFPs for price, service and innovation support. Their scale enables multi-sourcing across canners and co-packers, increasing competitive pressure on margins. Key accounts commonly represent more than 10% of a co-packer's or canner's volume, so losing one can slash plant utilization and revenue materially.
Switching ease across formats and vendors
Buyers freely shift volumes across can, PET, glass and carton to meet campaign goals, with approved vendor lists fostering price and lead‑time competition; technical qualifications add switching time but, for major brands (who hold >50% of volumes), do not bar supplier changes. Private‑label penetration, ~18% in 2024, often tests multiple suppliers to optimize cost and speed.

Demand cyclicality and promotional swings
Seasonality and promotional swings drive volatile orders that buyers pushed upstream in 2024, forcing requests for flexible capacity and VMI that heighten Hokkan’s working capital requirements. In downturns buyers demanded price concessions and extended payment terms, compressing margins and cash flow. Hokkan must realign production planning and buffer capacity to retain share and stabilize service levels.

Specification and sustainability requirements
Brands enforce detailed specs on coatings, recyclability and lightweighting; meeting ESG targets such as recycled content and lower carbon intensity is now table stakes and raises production cost and complexity. Buyers push back on premiums, shifting negotiating power to suppliers that can present verifiable ESG data. Over 90% of large US firms publish sustainability reports (2023–24), boosting demand for auditable metrics.
- Specs: coatings, recyclability, lightweighting
- ESG: recycled content/carbon intensity = table stakes
- Cost: compliance raises complexity and cost
- Edge: suppliers with verifiable ESG data negotiate better
Co-packing service expectations
Filling customers demand turnkey co-packing with rapid line changeovers and strict QA; service failures often trigger penalties and threaten contract renewals. Buyers benchmark co-packers on OEE (target >85% in 2024), spoilage (<0.5%) and OTIF (>98%), and integrated packaging-plus-filling offerings reduce buyer power by increasing stickiness and cutting churn ~20–30%.
- OEE target: >85% (2024)
- Spoilage: <0.5%
- OTIF: >98%
- Churn reduction from integrated offerings: ~20–30%
Top-account concentration, ESG specs and private-labels compress margins; integration cuts churn
Large national/global brands drive aggressive RFPs and multi-sourcing, with top accounts often >50% of volumes and single accounts >10%, creating high margin pressure (2024).
Buyers shift across can/PET/glass, private-label ~18% (2024), and enforce ESG/specs that raise supplier costs but favor verifiable data.
Key KPIs: OEE >85%, OTIF >98%, spoilage <0.5%; integrated offerings cut churn ~20–30%.
| Metric | 2024 |
|---|---|
| Private‑label share | ~18% |
| Top accounts share | >50% |
| Single account risk | >10% vol |
| OEE | >85% |
| OTIF | >98% |
Preview Before You Purchase
Hokkan Holdings Porter's Five Forces Analysis
This preview is the exact Porter’s Five Forces analysis for Hokkan Holdings you’ll receive immediately after purchase—no placeholders or samples. The file is fully formatted, professionally written, and ready for download and use, containing supplier, buyer, rivalry, threat of entry, and substitute assessments plus actionable implications. What you see here is the deliverable you will own once payment is completed.

Don't Miss the Bigger Picture
Hokkan Holdings faces moderate supplier leverage, evolving buyer expectations, and growing substitute threats as technology reshapes its sector. Competitive rivalry is intensifying with new agile entrants and margin pressure. Regulatory shifts could tilt barriers to entry and long-term profitability. This brief snapshot only scratches the surface—unlock the full Porter's Five Forces Analysis to explore Hokkan Holdings’s competitive dynamics and strategic implications in detail.
Suppliers Bargaining Power
Concentration in metal and resin inputs
Aluminum sheet, steel tinplate and PET resin are sourced from a concentrated set of global/regional producers — China accounted for ≈60% of primary aluminum and ≈56% of crude steel output in 2024, while the top PET producers held ≈45% of global PET capacity (2024). This concentration raises upstream pricing power during tight commodity cycles, with price spikes of 20–30% seen in recent stress periods. Long-term contracts and hedging reduce volatility but rarely eliminate supplier pass-through. Supplier consolidation or smelter curtailments can rapidly increase costs and extend lead times.
Energy and logistics dependency
Can-making and filling are energy- and transport-intensive, exposing Hokkan to utilities, fuel and freight providers; EU wholesale power averaged ~€100/MWh in 2024 and Asia JKM LNG averaged ~12 USD/MMBtu, squeezing margins if costs cannot be passed through. Global spot container rates (FBX) averaged ~1,200 USD/FEU in 2024 and US diesel ~3.8 USD/gal, while port congestion and trucking constraints force higher inventories. Multi-sourcing and nearshoring reduce exposure but require capital investment and 6–18 month planning horizons.
Specialty coatings and closures
Internal can linings, inks and closures come from specialized vendors with proprietary formulations, often governed by FDA 21 CFR food-contact rules that raise testing and documentation burdens. Qualification cycles frequently span 6–18 months, boosting switching costs and supplier leverage when materials become spec-locked to product needs. Suppliers can extract premiums via uniqueness and certification. Joint development can rebalance pricing power but increases technical dependency.
Quality and regulatory compliance
Food-grade certifications such as SQF, BRC and FSSC 22000 and traceability standards give compliant suppliers measurable leverage in 2024; deviation risks recalls and brand damage that materially raise the cost and time of supplier substitution. Audits and dual-qualification programs mitigate single-supplier risk but are time-consuming and costly, reinforcing incumbent suppliers’ influence over pricing and contract terms.
- Certifications: SQF, BRC, FSSC 22000
- Risk: recalls → higher substitution cost
- Mitigation: audits/dual-qualification slow and costly
Commodity price pass-through dynamics
- Index-linked pass-through: cushions margins but delays affect cash flow
- Demand weakness: increases surcharge pushback
- Procurement/scrap recovery: key levers to protect profitability
Upstream pricing power from China concentration, energy/logistics costs, and certification frictions
Supplier concentration (China: ≈60% primary aluminum, ≈56% crude steel; top PET ≈45% capacity) and energy/logistics costs (EU power ≈€100/MWh; JKM ≈$12/MMBtu; FBX ≈$1,200/FEU; US diesel ≈$3.8/gal) give upstreams pricing power. Spec materials and certifications (SQF/BRC/FSSC) raise switching costs and supplier leverage. Index-linked pass-through helps but lags; procurement and scrap recovery are key offsets.
| Item | 2024 |
|---|---|
| Concentration / Costs | Al/Steel/PET 60%/56%/45%; EU power €100/MWh; JKM $12 |
What is included in the product
Detailed Word Document
Uncovers key drivers of competition, buyer and supplier power, entry barriers, substitutes and rivalry specific to Hokkan Holdings, highlighting disruptive threats, market leverage and strategic safeguards to protect margins and market share.
Customizable Excel Spreadsheet
A concise one-sheet Porter’s Five Forces for Hokkan Holdings that pinpoints strategic pain points and competitive pressures at a glance; customizable pressure levels and an instant radar visualization simplify decision-making for executives and investors.
Customers Bargaining Power
Large beverage brand concentration
Large global and national beverage brands buy huge volumes and negotiate aggressively, issuing regular RFPs for price, service and innovation support. Their scale enables multi-sourcing across canners and co-packers, increasing competitive pressure on margins. Key accounts commonly represent more than 10% of a co-packer's or canner's volume, so losing one can slash plant utilization and revenue materially.
Switching ease across formats and vendors
Buyers freely shift volumes across can, PET, glass and carton to meet campaign goals, with approved vendor lists fostering price and lead‑time competition; technical qualifications add switching time but, for major brands (who hold >50% of volumes), do not bar supplier changes. Private‑label penetration, ~18% in 2024, often tests multiple suppliers to optimize cost and speed.
Demand cyclicality and promotional swings
Seasonality and promotional swings drive volatile orders that buyers pushed upstream in 2024, forcing requests for flexible capacity and VMI that heighten Hokkan’s working capital requirements. In downturns buyers demanded price concessions and extended payment terms, compressing margins and cash flow. Hokkan must realign production planning and buffer capacity to retain share and stabilize service levels.
Specification and sustainability requirements
Brands enforce detailed specs on coatings, recyclability and lightweighting; meeting ESG targets such as recycled content and lower carbon intensity is now table stakes and raises production cost and complexity. Buyers push back on premiums, shifting negotiating power to suppliers that can present verifiable ESG data. Over 90% of large US firms publish sustainability reports (2023–24), boosting demand for auditable metrics.
- Specs: coatings, recyclability, lightweighting
- ESG: recycled content/carbon intensity = table stakes
- Cost: compliance raises complexity and cost
- Edge: suppliers with verifiable ESG data negotiate better
Co-packing service expectations
Filling customers demand turnkey co-packing with rapid line changeovers and strict QA; service failures often trigger penalties and threaten contract renewals. Buyers benchmark co-packers on OEE (target >85% in 2024), spoilage (<0.5%) and OTIF (>98%), and integrated packaging-plus-filling offerings reduce buyer power by increasing stickiness and cutting churn ~20–30%.
- OEE target: >85% (2024)
- Spoilage: <0.5%
- OTIF: >98%
- Churn reduction from integrated offerings: ~20–30%
Top-account concentration, ESG specs and private-labels compress margins; integration cuts churn
Large national/global brands drive aggressive RFPs and multi-sourcing, with top accounts often >50% of volumes and single accounts >10%, creating high margin pressure (2024).
Buyers shift across can/PET/glass, private-label ~18% (2024), and enforce ESG/specs that raise supplier costs but favor verifiable data.
Key KPIs: OEE >85%, OTIF >98%, spoilage <0.5%; integrated offerings cut churn ~20–30%.
| Metric | 2024 |
|---|---|
| Private‑label share | ~18% |
| Top accounts share | >50% |
| Single account risk | >10% vol |
| OEE | >85% |
| OTIF | >98% |
Preview Before You Purchase
Hokkan Holdings Porter's Five Forces Analysis
This preview is the exact Porter’s Five Forces analysis for Hokkan Holdings you’ll receive immediately after purchase—no placeholders or samples. The file is fully formatted, professionally written, and ready for download and use, containing supplier, buyer, rivalry, threat of entry, and substitute assessments plus actionable implications. What you see here is the deliverable you will own once payment is completed.
Description
Don't Miss the Bigger Picture
Hokkan Holdings faces moderate supplier leverage, evolving buyer expectations, and growing substitute threats as technology reshapes its sector. Competitive rivalry is intensifying with new agile entrants and margin pressure. Regulatory shifts could tilt barriers to entry and long-term profitability. This brief snapshot only scratches the surface—unlock the full Porter's Five Forces Analysis to explore Hokkan Holdings’s competitive dynamics and strategic implications in detail.
Suppliers Bargaining Power
Concentration in metal and resin inputs
Aluminum sheet, steel tinplate and PET resin are sourced from a concentrated set of global/regional producers — China accounted for ≈60% of primary aluminum and ≈56% of crude steel output in 2024, while the top PET producers held ≈45% of global PET capacity (2024). This concentration raises upstream pricing power during tight commodity cycles, with price spikes of 20–30% seen in recent stress periods. Long-term contracts and hedging reduce volatility but rarely eliminate supplier pass-through. Supplier consolidation or smelter curtailments can rapidly increase costs and extend lead times.
Energy and logistics dependency
Can-making and filling are energy- and transport-intensive, exposing Hokkan to utilities, fuel and freight providers; EU wholesale power averaged ~€100/MWh in 2024 and Asia JKM LNG averaged ~12 USD/MMBtu, squeezing margins if costs cannot be passed through. Global spot container rates (FBX) averaged ~1,200 USD/FEU in 2024 and US diesel ~3.8 USD/gal, while port congestion and trucking constraints force higher inventories. Multi-sourcing and nearshoring reduce exposure but require capital investment and 6–18 month planning horizons.
Specialty coatings and closures
Internal can linings, inks and closures come from specialized vendors with proprietary formulations, often governed by FDA 21 CFR food-contact rules that raise testing and documentation burdens. Qualification cycles frequently span 6–18 months, boosting switching costs and supplier leverage when materials become spec-locked to product needs. Suppliers can extract premiums via uniqueness and certification. Joint development can rebalance pricing power but increases technical dependency.
Quality and regulatory compliance
Food-grade certifications such as SQF, BRC and FSSC 22000 and traceability standards give compliant suppliers measurable leverage in 2024; deviation risks recalls and brand damage that materially raise the cost and time of supplier substitution. Audits and dual-qualification programs mitigate single-supplier risk but are time-consuming and costly, reinforcing incumbent suppliers’ influence over pricing and contract terms.
- Certifications: SQF, BRC, FSSC 22000
- Risk: recalls → higher substitution cost
- Mitigation: audits/dual-qualification slow and costly
Commodity price pass-through dynamics
- Index-linked pass-through: cushions margins but delays affect cash flow
- Demand weakness: increases surcharge pushback
- Procurement/scrap recovery: key levers to protect profitability
Upstream pricing power from China concentration, energy/logistics costs, and certification frictions
Supplier concentration (China: ≈60% primary aluminum, ≈56% crude steel; top PET ≈45% capacity) and energy/logistics costs (EU power ≈€100/MWh; JKM ≈$12/MMBtu; FBX ≈$1,200/FEU; US diesel ≈$3.8/gal) give upstreams pricing power. Spec materials and certifications (SQF/BRC/FSSC) raise switching costs and supplier leverage. Index-linked pass-through helps but lags; procurement and scrap recovery are key offsets.
| Item | 2024 |
|---|---|
| Concentration / Costs | Al/Steel/PET 60%/56%/45%; EU power €100/MWh; JKM $12 |
What is included in the product
Detailed Word Document
Uncovers key drivers of competition, buyer and supplier power, entry barriers, substitutes and rivalry specific to Hokkan Holdings, highlighting disruptive threats, market leverage and strategic safeguards to protect margins and market share.
Customizable Excel Spreadsheet
A concise one-sheet Porter’s Five Forces for Hokkan Holdings that pinpoints strategic pain points and competitive pressures at a glance; customizable pressure levels and an instant radar visualization simplify decision-making for executives and investors.
Customers Bargaining Power
Large beverage brand concentration
Large global and national beverage brands buy huge volumes and negotiate aggressively, issuing regular RFPs for price, service and innovation support. Their scale enables multi-sourcing across canners and co-packers, increasing competitive pressure on margins. Key accounts commonly represent more than 10% of a co-packer's or canner's volume, so losing one can slash plant utilization and revenue materially.
Switching ease across formats and vendors
Buyers freely shift volumes across can, PET, glass and carton to meet campaign goals, with approved vendor lists fostering price and lead‑time competition; technical qualifications add switching time but, for major brands (who hold >50% of volumes), do not bar supplier changes. Private‑label penetration, ~18% in 2024, often tests multiple suppliers to optimize cost and speed.
Demand cyclicality and promotional swings
Seasonality and promotional swings drive volatile orders that buyers pushed upstream in 2024, forcing requests for flexible capacity and VMI that heighten Hokkan’s working capital requirements. In downturns buyers demanded price concessions and extended payment terms, compressing margins and cash flow. Hokkan must realign production planning and buffer capacity to retain share and stabilize service levels.
Specification and sustainability requirements
Brands enforce detailed specs on coatings, recyclability and lightweighting; meeting ESG targets such as recycled content and lower carbon intensity is now table stakes and raises production cost and complexity. Buyers push back on premiums, shifting negotiating power to suppliers that can present verifiable ESG data. Over 90% of large US firms publish sustainability reports (2023–24), boosting demand for auditable metrics.
- Specs: coatings, recyclability, lightweighting
- ESG: recycled content/carbon intensity = table stakes
- Cost: compliance raises complexity and cost
- Edge: suppliers with verifiable ESG data negotiate better
Co-packing service expectations
Filling customers demand turnkey co-packing with rapid line changeovers and strict QA; service failures often trigger penalties and threaten contract renewals. Buyers benchmark co-packers on OEE (target >85% in 2024), spoilage (<0.5%) and OTIF (>98%), and integrated packaging-plus-filling offerings reduce buyer power by increasing stickiness and cutting churn ~20–30%.
- OEE target: >85% (2024)
- Spoilage: <0.5%
- OTIF: >98%
- Churn reduction from integrated offerings: ~20–30%
Top-account concentration, ESG specs and private-labels compress margins; integration cuts churn
Large national/global brands drive aggressive RFPs and multi-sourcing, with top accounts often >50% of volumes and single accounts >10%, creating high margin pressure (2024).
Buyers shift across can/PET/glass, private-label ~18% (2024), and enforce ESG/specs that raise supplier costs but favor verifiable data.
Key KPIs: OEE >85%, OTIF >98%, spoilage <0.5%; integrated offerings cut churn ~20–30%.
| Metric | 2024 |
|---|---|
| Private‑label share | ~18% |
| Top accounts share | >50% |
| Single account risk | >10% vol |
| OEE | >85% |
| OTIF | >98% |
Preview Before You Purchase
Hokkan Holdings Porter's Five Forces Analysis
This preview is the exact Porter’s Five Forces analysis for Hokkan Holdings you’ll receive immediately after purchase—no placeholders or samples. The file is fully formatted, professionally written, and ready for download and use, containing supplier, buyer, rivalry, threat of entry, and substitute assessments plus actionable implications. What you see here is the deliverable you will own once payment is completed.











