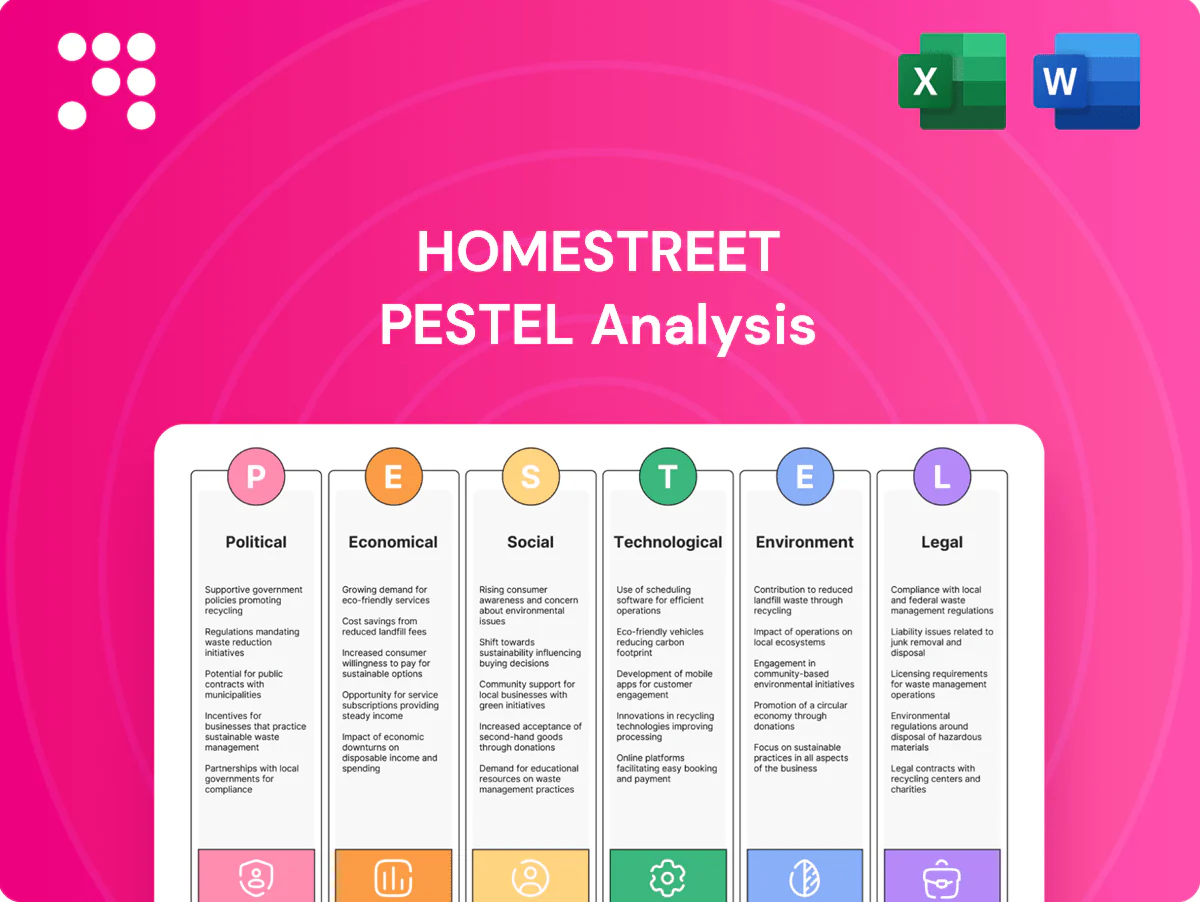
HomeStreet PESTLE Analysis

Make Smarter Strategic Decisions with a Complete PESTEL View
Gain a strategic edge with our PESTLE Analysis of HomeStreet. In concise, expert-led sections we map the political, economic, social, technological, legal and environmental forces shaping the bank’s outlook. Ideal for investors and strategists, it’s ready-to-use and editable. Purchase the full report for actionable, sourced insights you can apply today.
Political factors

Bank regulatory priorities
Changes in U.S. banking oversight raise capital, liquidity and stress-testing expectations for regional banks (assets under $100B), tightening requirements that can raise compliance costs. Shifts in FDIC, OCC and Fed agendas since 2023 have increased supervisory intensity and focus on interest-rate, liquidity and credit concentrations. Post-crisis prudential tightening can constrain balance-sheet growth while improving safety; HomeStreet (≈$5.5B assets) must anticipate these regulator priorities.
Housing and mortgage policy
Federal housing initiatives and GSE pricing moves materially shape HomeStreet mortgage demand and origination margins; GSEs account for roughly 70% of single‑family mortgage credit while FHA/VA represent about 10–12% of originations. Down‑payment assistance and affordability programs have driven localized volume gains in Western markets, whereas tighter underwriting or fee changes can compress spreads by multiple basis points and reduce secondary‑market liquidity, complicating pipeline hedging.

State-level banking climates
State policies drive HomeStreet costs: Washington relies on a business & occupation tax rather than corporate income tax, California faces a housing shortfall of roughly 3.5 million units (2024 estimates) raising mortgage demand, while Oregon and Hawaii use targeted grants and tax credits to spur small-business and housing projects that lift loan pipelines.
Municipal stances on branch access and heightened CRA scrutiny push branch strategy toward underserved areas, and fragmented state consumer-protection rules require tailored compliance programs and active lobbying to manage fee, disclosure and operational variances.

Public infrastructure spending
Infrastructure and climate-resilience funding from the 2021 Infrastructure Investment and Jobs Act (total $1.2 trillion; $550 billion new) is expanding commercial lending into construction, municipal contractors and supply chains while lifting deposits and payments activity; permitting and execution timing drive cyclical deal flow. HomeStreet can time and align lending pipelines to regional projects and resilience grant awards.
- 110B roads/bridges, 55B water, 65B broadband/power: targeted sectors
- Higher deposits/payments from project payrolls and contractors
- Permitting politics => cyclical origination timing
Geopolitical and disaster preparedness
Federal disaster declarations drive FEMA and SBA flows critical after West Coast wildfires and Hawaii storms; Lāhainā 2023 losses exceeded $5B, highlighting impacts on HomeStreet’s loan forbearance and local credit performance. Government aid and forbearance programs support community recovery, while sanctions and higher funding costs (Fed funds ~5.25–5.50%) raise compliance and funding burdens; preparedness boosts franchise reputation and stakeholder trust.
- FEMA/SBA relief: stabilizes loans
- 2023 Lāhainā losses >$5B: credit stress
- Fed funds ~5.25–5.50%: higher funding costs
- Sanctions: increased compliance burden
- Preparedness: enhances reputation
Tighter oversight and GSE dominance tighten margins; CA housing gap, IIJA reshape loan flows
Heightened federal oversight since 2023 increases capital, liquidity and stress‑testing burdens for regional banks; HomeStreet (≈$5.5B assets) faces higher compliance costs and slower balance‑sheet growth. GSE pricing and federal housing programs (GSEs ~70% market) materially sway mortgage margins and origination volumes. State taxes, CA housing gap (~3.5M units, 2024) and IIJA project timing ($1.2T; $550B new) shape loan pipelines and deposit flows.
| Metric | Value |
|---|---|
| HomeStreet assets | $5.5B |
| Fed funds | ~5.25–5.50% |
| GSE share single‑family | ~70% |
| CA housing gap (2024) | ~3.5M units |
| IIJA total / new | $1.2T / $550B |
What is included in the product
 Detailed Word Document
Explores how macro-environmental factors uniquely affect HomeStreet across Political, Economic, Social, Technological, Environmental, and Legal dimensions, with data-driven trends and region-specific examples. Designed to help executives and investors identify risks, opportunities, and actionable strategies.

 Customizable Excel Spreadsheet
A concise, visually segmented PESTLE summary for HomeStreet that highlights external risks, regulatory drivers, and market opportunities—easily dropped into presentations or shared across teams to accelerate strategic alignment and decision-making.
Economic factors

Interest-rate and margin dynamics
HomeStreet's net interest margin hinges on Federal Reserve policy (federal funds ~5.25–5.50% in 2024–mid‑2025), the yield‑curve slope (2s‑10s remained inverted by roughly 40–60 bps in 2024), and deposit beta behavior. Prolonged higher rates raise funding costs while boosting asset yields with implementation lags. Rapid rate cuts would likely compress margins but ease credit stress. Active balance‑sheet hedging and dynamic product pricing are therefore critical.
Regional housing cycles
Regional housing cycles in the Western U.S. and Hawaii—where affordability is strained and for-sale inventory remains tight—directly drive mortgage and HELOC volumes as buyers chase limited supply; 30-year mortgage rates near 7% in 2024–25 have damped turnover. Price volatility has widened collateral value swings, raising credit-loss expectations for lenders. Elevated construction activity in Western metros expands C&I and CRE lending pipelines. Local employment in tech, tourism and services (U.S. unemployment ~3.7% mid-2025) transmits to borrower capacity and default risk.

Credit quality in CRE
Office vacancy (roughly 17–19% nationally in 2024–H1 2025) and repricing of cap rates (up ~150–200 bps since 2021) pressure valuations, forcing HomeStreet to raise provisions and reserve capital; retail and multifamily performance (multifamily rent growth ~3–5%) partly offset losses. Rising insurance and operating costs (up ~20–35% in many coastal markets) compress DSCRs by an estimated 10–20%. Proactive workouts and portfolio diversification have reduced charge-offs and limited capital drawdowns.

Deposit competition and liquidity
Money market funds and large banks intensify pricing pressure on deposits, with US money market fund assets about $5.4 trillion (Dec 2024, ICI), pushing up retail rate offers. Granular retail and small-business balances boost stability but raise funding costs in high-rate regimes; liquidity buffers and contingent funding lines must be sized to plausible stress scenarios. Relationship-based cross-sell reduces churn and IRR sensitivity.
- Deposit competition: MMFs ~$5.4T (Dec 2024)
- Cost trade-off: granular balances = stability but higher funding cost
- Liquidity: buffers + backstops sized to stress
- Retention: cross-sell lowers churn
Inflation and wage dynamics
Sustained service-sector inflation (U.S. core services CPI ~4.6% in 2024, BLS) lifts HomeStreet’s noninterest expenses as vendor prices rise, pressuring margins while customers’ constrained real incomes compress loan demand and can increase delinquencies. Rising tech and compliance vendor costs further strain operating costs; targeted efficiency programs and higher fee income partially offset margin pressure.
- Service inflation ~4.6% (2024)
- Higher vendor tech/compliance costs
- Real incomes drive loan growth/delinquency
- Efficiency programs + fee income mitigate margins
Tighter oversight and GSE dominance tighten margins; CA housing gap, IIJA reshape loan flows
Federal funds ~5.25–5.50% (mid‑2025) and 30y mortgage ~7% tighten margins; yield‑curve inversion (2s‑10s ≈ -40–60bps) and deposit beta drive NIM volatility. Regional housing tightness in West/Hawaii and unemployment ~3.7% (mid‑2025) shape mortgage/HELOC flows. Core services CPI ~4.6% (2024) and MMF assets $5.4T (Dec‑2024) raise funding and expense pressure.
| Metric | Value |
|---|---|
| Fed funds | 5.25–5.50% |
| 30y mortgage | ~7% |
| MMF assets | $5.4T (Dec‑2024) |
| Unemployment | ~3.7% (mid‑2025) |
| Core services CPI | 4.6% (2024) |
What You See Is What You Get
HomeStreet PESTLE Analysis
The preview shown here is the exact HomeStreet PESTLE Analysis you’ll receive after purchase — fully formatted, professionally structured, and ready to use. The content and structure visible in this screenshot are identical to the downloadable file delivered upon payment. No placeholders, no teasers; this is the final document you’ll own after checkout. What you see is what you’ll be working with.

Make Smarter Strategic Decisions with a Complete PESTEL View
Gain a strategic edge with our PESTLE Analysis of HomeStreet. In concise, expert-led sections we map the political, economic, social, technological, legal and environmental forces shaping the bank’s outlook. Ideal for investors and strategists, it’s ready-to-use and editable. Purchase the full report for actionable, sourced insights you can apply today.
Political factors
Bank regulatory priorities
Changes in U.S. banking oversight raise capital, liquidity and stress-testing expectations for regional banks (assets under $100B), tightening requirements that can raise compliance costs. Shifts in FDIC, OCC and Fed agendas since 2023 have increased supervisory intensity and focus on interest-rate, liquidity and credit concentrations. Post-crisis prudential tightening can constrain balance-sheet growth while improving safety; HomeStreet (≈$5.5B assets) must anticipate these regulator priorities.
Housing and mortgage policy
Federal housing initiatives and GSE pricing moves materially shape HomeStreet mortgage demand and origination margins; GSEs account for roughly 70% of single‑family mortgage credit while FHA/VA represent about 10–12% of originations. Down‑payment assistance and affordability programs have driven localized volume gains in Western markets, whereas tighter underwriting or fee changes can compress spreads by multiple basis points and reduce secondary‑market liquidity, complicating pipeline hedging.
State-level banking climates
State policies drive HomeStreet costs: Washington relies on a business & occupation tax rather than corporate income tax, California faces a housing shortfall of roughly 3.5 million units (2024 estimates) raising mortgage demand, while Oregon and Hawaii use targeted grants and tax credits to spur small-business and housing projects that lift loan pipelines.
Municipal stances on branch access and heightened CRA scrutiny push branch strategy toward underserved areas, and fragmented state consumer-protection rules require tailored compliance programs and active lobbying to manage fee, disclosure and operational variances.
Public infrastructure spending
Infrastructure and climate-resilience funding from the 2021 Infrastructure Investment and Jobs Act (total $1.2 trillion; $550 billion new) is expanding commercial lending into construction, municipal contractors and supply chains while lifting deposits and payments activity; permitting and execution timing drive cyclical deal flow. HomeStreet can time and align lending pipelines to regional projects and resilience grant awards.
- 110B roads/bridges, 55B water, 65B broadband/power: targeted sectors
- Higher deposits/payments from project payrolls and contractors
- Permitting politics => cyclical origination timing
Geopolitical and disaster preparedness
Federal disaster declarations drive FEMA and SBA flows critical after West Coast wildfires and Hawaii storms; Lāhainā 2023 losses exceeded $5B, highlighting impacts on HomeStreet’s loan forbearance and local credit performance. Government aid and forbearance programs support community recovery, while sanctions and higher funding costs (Fed funds ~5.25–5.50%) raise compliance and funding burdens; preparedness boosts franchise reputation and stakeholder trust.
- FEMA/SBA relief: stabilizes loans
- 2023 Lāhainā losses >$5B: credit stress
- Fed funds ~5.25–5.50%: higher funding costs
- Sanctions: increased compliance burden
- Preparedness: enhances reputation
Tighter oversight and GSE dominance tighten margins; CA housing gap, IIJA reshape loan flows
Heightened federal oversight since 2023 increases capital, liquidity and stress‑testing burdens for regional banks; HomeStreet (≈$5.5B assets) faces higher compliance costs and slower balance‑sheet growth. GSE pricing and federal housing programs (GSEs ~70% market) materially sway mortgage margins and origination volumes. State taxes, CA housing gap (~3.5M units, 2024) and IIJA project timing ($1.2T; $550B new) shape loan pipelines and deposit flows.
| Metric | Value |
|---|---|
| HomeStreet assets | $5.5B |
| Fed funds | ~5.25–5.50% |
| GSE share single‑family | ~70% |
| CA housing gap (2024) | ~3.5M units |
| IIJA total / new | $1.2T / $550B |
What is included in the product
Detailed Word Document
Explores how macro-environmental factors uniquely affect HomeStreet across Political, Economic, Social, Technological, Environmental, and Legal dimensions, with data-driven trends and region-specific examples. Designed to help executives and investors identify risks, opportunities, and actionable strategies.
Customizable Excel Spreadsheet
A concise, visually segmented PESTLE summary for HomeStreet that highlights external risks, regulatory drivers, and market opportunities—easily dropped into presentations or shared across teams to accelerate strategic alignment and decision-making.
Economic factors
Interest-rate and margin dynamics
HomeStreet's net interest margin hinges on Federal Reserve policy (federal funds ~5.25–5.50% in 2024–mid‑2025), the yield‑curve slope (2s‑10s remained inverted by roughly 40–60 bps in 2024), and deposit beta behavior. Prolonged higher rates raise funding costs while boosting asset yields with implementation lags. Rapid rate cuts would likely compress margins but ease credit stress. Active balance‑sheet hedging and dynamic product pricing are therefore critical.
Regional housing cycles
Regional housing cycles in the Western U.S. and Hawaii—where affordability is strained and for-sale inventory remains tight—directly drive mortgage and HELOC volumes as buyers chase limited supply; 30-year mortgage rates near 7% in 2024–25 have damped turnover. Price volatility has widened collateral value swings, raising credit-loss expectations for lenders. Elevated construction activity in Western metros expands C&I and CRE lending pipelines. Local employment in tech, tourism and services (U.S. unemployment ~3.7% mid-2025) transmits to borrower capacity and default risk.
Credit quality in CRE
Office vacancy (roughly 17–19% nationally in 2024–H1 2025) and repricing of cap rates (up ~150–200 bps since 2021) pressure valuations, forcing HomeStreet to raise provisions and reserve capital; retail and multifamily performance (multifamily rent growth ~3–5%) partly offset losses. Rising insurance and operating costs (up ~20–35% in many coastal markets) compress DSCRs by an estimated 10–20%. Proactive workouts and portfolio diversification have reduced charge-offs and limited capital drawdowns.
Deposit competition and liquidity
Money market funds and large banks intensify pricing pressure on deposits, with US money market fund assets about $5.4 trillion (Dec 2024, ICI), pushing up retail rate offers. Granular retail and small-business balances boost stability but raise funding costs in high-rate regimes; liquidity buffers and contingent funding lines must be sized to plausible stress scenarios. Relationship-based cross-sell reduces churn and IRR sensitivity.
- Deposit competition: MMFs ~$5.4T (Dec 2024)
- Cost trade-off: granular balances = stability but higher funding cost
- Liquidity: buffers + backstops sized to stress
- Retention: cross-sell lowers churn
Inflation and wage dynamics
Sustained service-sector inflation (U.S. core services CPI ~4.6% in 2024, BLS) lifts HomeStreet’s noninterest expenses as vendor prices rise, pressuring margins while customers’ constrained real incomes compress loan demand and can increase delinquencies. Rising tech and compliance vendor costs further strain operating costs; targeted efficiency programs and higher fee income partially offset margin pressure.
- Service inflation ~4.6% (2024)
- Higher vendor tech/compliance costs
- Real incomes drive loan growth/delinquency
- Efficiency programs + fee income mitigate margins
Tighter oversight and GSE dominance tighten margins; CA housing gap, IIJA reshape loan flows
Federal funds ~5.25–5.50% (mid‑2025) and 30y mortgage ~7% tighten margins; yield‑curve inversion (2s‑10s ≈ -40–60bps) and deposit beta drive NIM volatility. Regional housing tightness in West/Hawaii and unemployment ~3.7% (mid‑2025) shape mortgage/HELOC flows. Core services CPI ~4.6% (2024) and MMF assets $5.4T (Dec‑2024) raise funding and expense pressure.
| Metric | Value |
|---|---|
| Fed funds | 5.25–5.50% |
| 30y mortgage | ~7% |
| MMF assets | $5.4T (Dec‑2024) |
| Unemployment | ~3.7% (mid‑2025) |
| Core services CPI | 4.6% (2024) |
What You See Is What You Get
HomeStreet PESTLE Analysis
The preview shown here is the exact HomeStreet PESTLE Analysis you’ll receive after purchase — fully formatted, professionally structured, and ready to use. The content and structure visible in this screenshot are identical to the downloadable file delivered upon payment. No placeholders, no teasers; this is the final document you’ll own after checkout. What you see is what you’ll be working with.
Description
Make Smarter Strategic Decisions with a Complete PESTEL View
Gain a strategic edge with our PESTLE Analysis of HomeStreet. In concise, expert-led sections we map the political, economic, social, technological, legal and environmental forces shaping the bank’s outlook. Ideal for investors and strategists, it’s ready-to-use and editable. Purchase the full report for actionable, sourced insights you can apply today.
Political factors
Bank regulatory priorities
Changes in U.S. banking oversight raise capital, liquidity and stress-testing expectations for regional banks (assets under $100B), tightening requirements that can raise compliance costs. Shifts in FDIC, OCC and Fed agendas since 2023 have increased supervisory intensity and focus on interest-rate, liquidity and credit concentrations. Post-crisis prudential tightening can constrain balance-sheet growth while improving safety; HomeStreet (≈$5.5B assets) must anticipate these regulator priorities.
Housing and mortgage policy
Federal housing initiatives and GSE pricing moves materially shape HomeStreet mortgage demand and origination margins; GSEs account for roughly 70% of single‑family mortgage credit while FHA/VA represent about 10–12% of originations. Down‑payment assistance and affordability programs have driven localized volume gains in Western markets, whereas tighter underwriting or fee changes can compress spreads by multiple basis points and reduce secondary‑market liquidity, complicating pipeline hedging.
State-level banking climates
State policies drive HomeStreet costs: Washington relies on a business & occupation tax rather than corporate income tax, California faces a housing shortfall of roughly 3.5 million units (2024 estimates) raising mortgage demand, while Oregon and Hawaii use targeted grants and tax credits to spur small-business and housing projects that lift loan pipelines.
Municipal stances on branch access and heightened CRA scrutiny push branch strategy toward underserved areas, and fragmented state consumer-protection rules require tailored compliance programs and active lobbying to manage fee, disclosure and operational variances.
Public infrastructure spending
Infrastructure and climate-resilience funding from the 2021 Infrastructure Investment and Jobs Act (total $1.2 trillion; $550 billion new) is expanding commercial lending into construction, municipal contractors and supply chains while lifting deposits and payments activity; permitting and execution timing drive cyclical deal flow. HomeStreet can time and align lending pipelines to regional projects and resilience grant awards.
- 110B roads/bridges, 55B water, 65B broadband/power: targeted sectors
- Higher deposits/payments from project payrolls and contractors
- Permitting politics => cyclical origination timing
Geopolitical and disaster preparedness
Federal disaster declarations drive FEMA and SBA flows critical after West Coast wildfires and Hawaii storms; Lāhainā 2023 losses exceeded $5B, highlighting impacts on HomeStreet’s loan forbearance and local credit performance. Government aid and forbearance programs support community recovery, while sanctions and higher funding costs (Fed funds ~5.25–5.50%) raise compliance and funding burdens; preparedness boosts franchise reputation and stakeholder trust.
- FEMA/SBA relief: stabilizes loans
- 2023 Lāhainā losses >$5B: credit stress
- Fed funds ~5.25–5.50%: higher funding costs
- Sanctions: increased compliance burden
- Preparedness: enhances reputation
Tighter oversight and GSE dominance tighten margins; CA housing gap, IIJA reshape loan flows
Heightened federal oversight since 2023 increases capital, liquidity and stress‑testing burdens for regional banks; HomeStreet (≈$5.5B assets) faces higher compliance costs and slower balance‑sheet growth. GSE pricing and federal housing programs (GSEs ~70% market) materially sway mortgage margins and origination volumes. State taxes, CA housing gap (~3.5M units, 2024) and IIJA project timing ($1.2T; $550B new) shape loan pipelines and deposit flows.
| Metric | Value |
|---|---|
| HomeStreet assets | $5.5B |
| Fed funds | ~5.25–5.50% |
| GSE share single‑family | ~70% |
| CA housing gap (2024) | ~3.5M units |
| IIJA total / new | $1.2T / $550B |
What is included in the product
Detailed Word Document
Explores how macro-environmental factors uniquely affect HomeStreet across Political, Economic, Social, Technological, Environmental, and Legal dimensions, with data-driven trends and region-specific examples. Designed to help executives and investors identify risks, opportunities, and actionable strategies.
Customizable Excel Spreadsheet
A concise, visually segmented PESTLE summary for HomeStreet that highlights external risks, regulatory drivers, and market opportunities—easily dropped into presentations or shared across teams to accelerate strategic alignment and decision-making.
Economic factors
Interest-rate and margin dynamics
HomeStreet's net interest margin hinges on Federal Reserve policy (federal funds ~5.25–5.50% in 2024–mid‑2025), the yield‑curve slope (2s‑10s remained inverted by roughly 40–60 bps in 2024), and deposit beta behavior. Prolonged higher rates raise funding costs while boosting asset yields with implementation lags. Rapid rate cuts would likely compress margins but ease credit stress. Active balance‑sheet hedging and dynamic product pricing are therefore critical.
Regional housing cycles
Regional housing cycles in the Western U.S. and Hawaii—where affordability is strained and for-sale inventory remains tight—directly drive mortgage and HELOC volumes as buyers chase limited supply; 30-year mortgage rates near 7% in 2024–25 have damped turnover. Price volatility has widened collateral value swings, raising credit-loss expectations for lenders. Elevated construction activity in Western metros expands C&I and CRE lending pipelines. Local employment in tech, tourism and services (U.S. unemployment ~3.7% mid-2025) transmits to borrower capacity and default risk.
Credit quality in CRE
Office vacancy (roughly 17–19% nationally in 2024–H1 2025) and repricing of cap rates (up ~150–200 bps since 2021) pressure valuations, forcing HomeStreet to raise provisions and reserve capital; retail and multifamily performance (multifamily rent growth ~3–5%) partly offset losses. Rising insurance and operating costs (up ~20–35% in many coastal markets) compress DSCRs by an estimated 10–20%. Proactive workouts and portfolio diversification have reduced charge-offs and limited capital drawdowns.
Deposit competition and liquidity
Money market funds and large banks intensify pricing pressure on deposits, with US money market fund assets about $5.4 trillion (Dec 2024, ICI), pushing up retail rate offers. Granular retail and small-business balances boost stability but raise funding costs in high-rate regimes; liquidity buffers and contingent funding lines must be sized to plausible stress scenarios. Relationship-based cross-sell reduces churn and IRR sensitivity.
- Deposit competition: MMFs ~$5.4T (Dec 2024)
- Cost trade-off: granular balances = stability but higher funding cost
- Liquidity: buffers + backstops sized to stress
- Retention: cross-sell lowers churn
Inflation and wage dynamics
Sustained service-sector inflation (U.S. core services CPI ~4.6% in 2024, BLS) lifts HomeStreet’s noninterest expenses as vendor prices rise, pressuring margins while customers’ constrained real incomes compress loan demand and can increase delinquencies. Rising tech and compliance vendor costs further strain operating costs; targeted efficiency programs and higher fee income partially offset margin pressure.
- Service inflation ~4.6% (2024)
- Higher vendor tech/compliance costs
- Real incomes drive loan growth/delinquency
- Efficiency programs + fee income mitigate margins
Tighter oversight and GSE dominance tighten margins; CA housing gap, IIJA reshape loan flows
Federal funds ~5.25–5.50% (mid‑2025) and 30y mortgage ~7% tighten margins; yield‑curve inversion (2s‑10s ≈ -40–60bps) and deposit beta drive NIM volatility. Regional housing tightness in West/Hawaii and unemployment ~3.7% (mid‑2025) shape mortgage/HELOC flows. Core services CPI ~4.6% (2024) and MMF assets $5.4T (Dec‑2024) raise funding and expense pressure.
| Metric | Value |
|---|---|
| Fed funds | 5.25–5.50% |
| 30y mortgage | ~7% |
| MMF assets | $5.4T (Dec‑2024) |
| Unemployment | ~3.7% (mid‑2025) |
| Core services CPI | 4.6% (2024) |
What You See Is What You Get
HomeStreet PESTLE Analysis
The preview shown here is the exact HomeStreet PESTLE Analysis you’ll receive after purchase — fully formatted, professionally structured, and ready to use. The content and structure visible in this screenshot are identical to the downloadable file delivered upon payment. No placeholders, no teasers; this is the final document you’ll own after checkout. What you see is what you’ll be working with.











