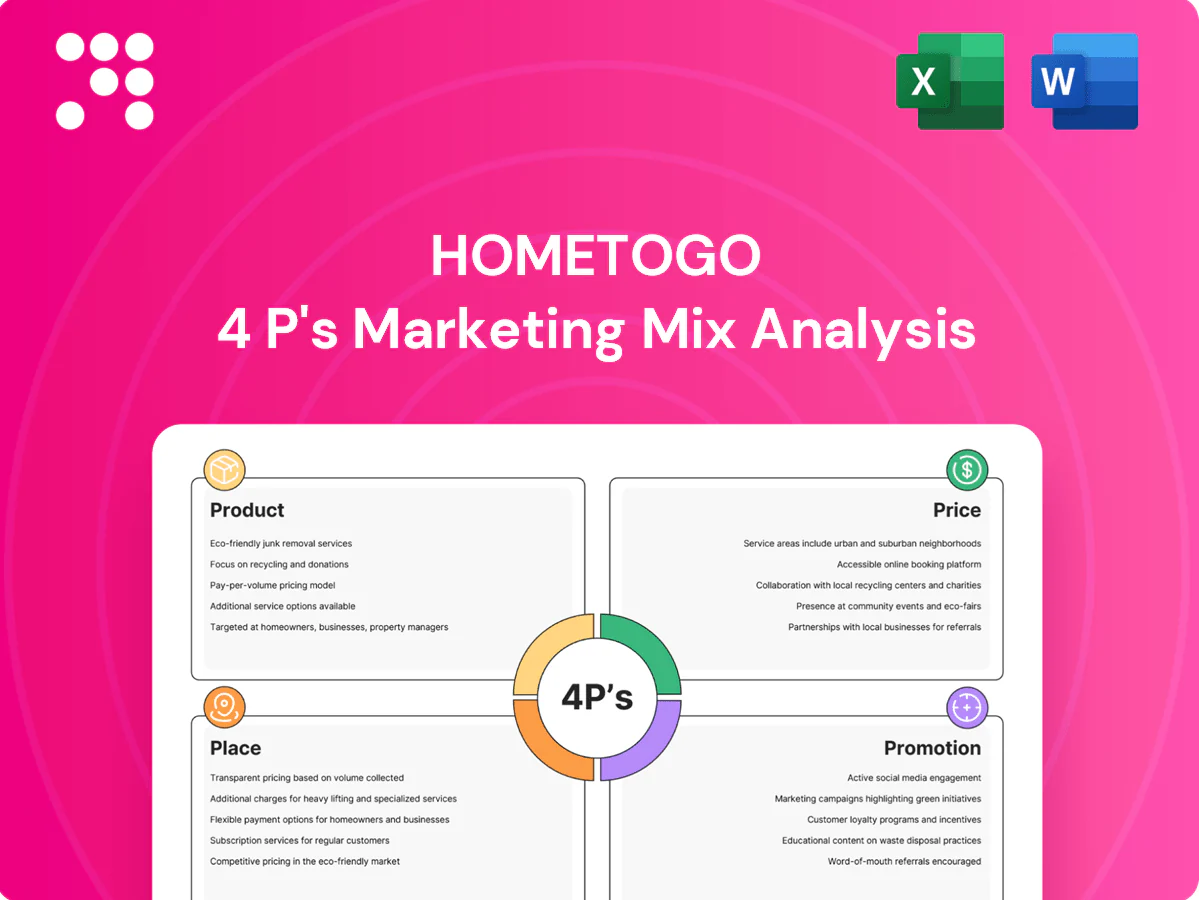
HomeToGo Marketing Mix

Your Shortcut to a Strategic 4Ps Breakdown
Discover how HomeToGo’s product offerings, pricing tiers, distribution channels, and promotional tactics combine to capture market share and maximize bookings; this preview highlights key moves but the full 4P’s Marketing Mix Analysis reveals the strategic detail. Perfect for consultants, students, and managers, the complete, editable report saves research time and provides ready-to-use slides. Unlock the full analysis now to apply proven tactics and benchmark performance.
Product

Aggregated vacation rental meta-search
HomeToGo centralizes over 20 million listings from 700+ providers into one searchable catalogue as of 2024, letting users discover, compare and book diverse accommodations in one place. This aggregation reduces search friction and widens choice, boosting conversion by simplifying cross-platform comparison. Market reach and provider breadth position the platform as a neutral marketplace focused on transparency and breadth.
Powerful compare-and-book experience
Tools surface key variables—total price, amenities, cancellation, location—so users compare options across HomeToGo's portfolio; as of 2024 HomeToGo aggregates over 20 million listings. Side-by-side comparisons and structured listing data accelerate decision-making and reduce time-to-book. Streamlined checkout routes users to the correct partner booking path, improving conversion while preserving partner relationships.

Advanced filters, maps, and reviews
Granular filters let users narrow 18 million+ HomeToGo listings (2024) by budget, property type and features, aligning inventory to traveler intent and reducing search time. Interactive maps visualize availability, proximity and neighborhood context to support route and stay planning. Review summaries and trust signals condense sentiment and reduce uncertainty, boosting booking confidence and reported conversion uplifts in platform tests.

Cross-platform UX: web and mobile apps
Responsive web and native apps let users search and book on-the-go, with mobile accounting for about 66% of travel bookings in 2024 (Statista); saved searches, favorites and alerts sync across devices to reduce friction. Fast load times and intuitive UI cut drop-off (Google: >50% abandon if mobile load >3s) and this consistency drives repeat use and higher lifetime value.
- Mobile-first: 66% travel bookings (2024)
- Device sync: saved searches, alerts, favorites
- Performance: >50% abandon if load >3s (Google)
- Outcome: higher repeat rates and LTV
Partner tools and integrations
Connectivity with PMS and channel managers keeps availability and pricing current through real-time syncing, while APIs and dashboards surface feed quality, performance insights, and payout tracking to partners. Flexible routing supports both on-site booking and redirect flows, strengthening supply depth and improving data accuracy across listings.
- Real-time PMS sync
- API-driven feed quality
- Performance dashboards
- Payout tracking
- On-site or redirect routing
20M+ listings centralized; fast mobile search with ≈66% bookings, real-time sync
HomeToGo aggregates 20 million+ listings (2024), centralizing discovery, comparison and booking to reduce search friction and boost conversion. Granular filters, maps and review summaries speed decisions; responsive web/apps (mobile ≈66% of bookings, 2024) and fast performance cut drop-off. Real-time PMS/API sync and flexible routing maintain accurate pricing/availability and partner payout transparency.
| Metric | Value | Source |
|---|---|---|
| Listings | 20M+ | HomeToGo 2024 |
| Mobile share | ≈66% | Statista 2024 |
| Mobile load abandon | > 50% if >3s |
What is included in the product
 Detailed Word Document
Delivers a concise, company-specific deep dive into HomeToGo’s Product, Price, Place, and Promotion strategies—grounded in real practices and competitive context—ideal for managers, consultants, and marketers seeking a structured, editable analysis with examples, positioning, and strategic implications for benchmarking, case studies, or strategy audits.

 Customizable Excel Spreadsheet
Condenses HomeToGo’s 4P marketing analysis into a high-level, at-a-glance one-pager that relieves briefing and alignment pain points; customizable and plug-and-play for meetings, decks, cross-brand comparisons, and for helping non-marketing stakeholders quickly grasp strategic direction.
Place

Global reach via website and apps
Primary distribution for HomeToGo runs through its website and mobile apps, aggregating over 18 million vacation rental listings and reaching customers in 200+ countries; this digital-first channel drives scale and conversion. International coverage ensures broad demand access while localized language, currency, and content—available across markets—improve relevance and booking rates. These features maximize accessibility for travelers worldwide and support global revenue growth.
SEO and performance media footprint
Structured inventory pages capture high-intent organic traffic—organic search delivers roughly 53% of website visits industry-wide—feeding low-cost, high-conversion demand. Paid search and metasearch (Google ~80% search market share) extend reach at scale and secure incremental bookings beyond organic. Retargeting recovers browsers and can lift conversion rates by up to 70%, balancing efficiency with volume growth.

Affiliate and referral partnerships
Travel publishers and bloggers drive incremental traffic to HomeToGo via tracked links, with affiliate conversion rates typically 1–3% and cost-per-acquisition often lower than paid search. White-label and co-branded experiences expand distribution into publisher audiences and OTA ecosystems, increasing reach without direct-brand spend. Revenue shares, commonly 5–20% in vacation-rental partnerships, align incentives and scale performance. This diversifies acquisition beyond direct channels, reducing reliance on paid search and organic alone.

Supply-side connectivity with OTAs and PMs
Supply-side connectivity with major OTAs and property managers (Booking.com, Vrbo, Airbnb and leading PMs) drives HomeToGo's inventory breadth, aggregating over 18 million listings across 50+ countries. Real-time sync keeps rates and calendars accurate, reducing double-booking risk and enabling dynamic pricing alignment. Flexible distribution agreements support varied geographies and niches, ensuring consistent availability where demand exists.
- Integrations: Booking.com, Vrbo, Airbnb, leading PMs
- Inventory: 18M+ listings
- Reach: 50+ countries
- Benefits: real-time rates/calendars, flexible distribution
Multilingual support and service
- help centers and 24/7 support
- 75% prefer native-language service
- proactive communication reduces disruptions
- reliability drives repeat bookings
Digital-first rental aggregator: 18M+ listings in 200+ countries
HomeToGo's place strategy is digital-first via website/apps aggregating 18M+ listings and serving 200+ countries, maximizing global accessibility and conversion. Organic search (~53% of traffic) plus paid/metasearch (Google ~80% search share) and affiliates (1–3% conv.) balance cost and volume. Supply integrations with OTAs/PMs and 24/7 multilingual support (75% prefer native language) secure availability and repeat bookings.
| Metric | Value |
|---|---|
| Listings | 18M+ |
| Reach | 200+ countries |
| Organic traffic | ~53% |
| Google share | ~80% |
| Affiliate conv. | 1–3% |
| Rev share | 5–20% |
| Native-language pref. | 75% |
Full Version Awaits
HomeToGo 4P's Marketing Mix Analysis
The HomeToGo 4P's Marketing Mix Analysis you see here is the actual, final document you’ll receive instantly after purchase—no mockups or samples. It’s fully editable and ready to use, containing the same complete content available for download at checkout.

Your Shortcut to a Strategic 4Ps Breakdown
Discover how HomeToGo’s product offerings, pricing tiers, distribution channels, and promotional tactics combine to capture market share and maximize bookings; this preview highlights key moves but the full 4P’s Marketing Mix Analysis reveals the strategic detail. Perfect for consultants, students, and managers, the complete, editable report saves research time and provides ready-to-use slides. Unlock the full analysis now to apply proven tactics and benchmark performance.
Product
Aggregated vacation rental meta-search
HomeToGo centralizes over 20 million listings from 700+ providers into one searchable catalogue as of 2024, letting users discover, compare and book diverse accommodations in one place. This aggregation reduces search friction and widens choice, boosting conversion by simplifying cross-platform comparison. Market reach and provider breadth position the platform as a neutral marketplace focused on transparency and breadth.
Powerful compare-and-book experience
Tools surface key variables—total price, amenities, cancellation, location—so users compare options across HomeToGo's portfolio; as of 2024 HomeToGo aggregates over 20 million listings. Side-by-side comparisons and structured listing data accelerate decision-making and reduce time-to-book. Streamlined checkout routes users to the correct partner booking path, improving conversion while preserving partner relationships.
Advanced filters, maps, and reviews
Granular filters let users narrow 18 million+ HomeToGo listings (2024) by budget, property type and features, aligning inventory to traveler intent and reducing search time. Interactive maps visualize availability, proximity and neighborhood context to support route and stay planning. Review summaries and trust signals condense sentiment and reduce uncertainty, boosting booking confidence and reported conversion uplifts in platform tests.
Cross-platform UX: web and mobile apps
Responsive web and native apps let users search and book on-the-go, with mobile accounting for about 66% of travel bookings in 2024 (Statista); saved searches, favorites and alerts sync across devices to reduce friction. Fast load times and intuitive UI cut drop-off (Google: >50% abandon if mobile load >3s) and this consistency drives repeat use and higher lifetime value.
- Mobile-first: 66% travel bookings (2024)
- Device sync: saved searches, alerts, favorites
- Performance: >50% abandon if load >3s (Google)
- Outcome: higher repeat rates and LTV
Partner tools and integrations
Connectivity with PMS and channel managers keeps availability and pricing current through real-time syncing, while APIs and dashboards surface feed quality, performance insights, and payout tracking to partners. Flexible routing supports both on-site booking and redirect flows, strengthening supply depth and improving data accuracy across listings.
- Real-time PMS sync
- API-driven feed quality
- Performance dashboards
- Payout tracking
- On-site or redirect routing
20M+ listings centralized; fast mobile search with ≈66% bookings, real-time sync
HomeToGo aggregates 20 million+ listings (2024), centralizing discovery, comparison and booking to reduce search friction and boost conversion. Granular filters, maps and review summaries speed decisions; responsive web/apps (mobile ≈66% of bookings, 2024) and fast performance cut drop-off. Real-time PMS/API sync and flexible routing maintain accurate pricing/availability and partner payout transparency.
| Metric | Value | Source |
|---|---|---|
| Listings | 20M+ | HomeToGo 2024 |
| Mobile share | ≈66% | Statista 2024 |
| Mobile load abandon | > 50% if >3s |
What is included in the product
Detailed Word Document
Delivers a concise, company-specific deep dive into HomeToGo’s Product, Price, Place, and Promotion strategies—grounded in real practices and competitive context—ideal for managers, consultants, and marketers seeking a structured, editable analysis with examples, positioning, and strategic implications for benchmarking, case studies, or strategy audits.
Customizable Excel Spreadsheet
Condenses HomeToGo’s 4P marketing analysis into a high-level, at-a-glance one-pager that relieves briefing and alignment pain points; customizable and plug-and-play for meetings, decks, cross-brand comparisons, and for helping non-marketing stakeholders quickly grasp strategic direction.
Place
Global reach via website and apps
Primary distribution for HomeToGo runs through its website and mobile apps, aggregating over 18 million vacation rental listings and reaching customers in 200+ countries; this digital-first channel drives scale and conversion. International coverage ensures broad demand access while localized language, currency, and content—available across markets—improve relevance and booking rates. These features maximize accessibility for travelers worldwide and support global revenue growth.
SEO and performance media footprint
Structured inventory pages capture high-intent organic traffic—organic search delivers roughly 53% of website visits industry-wide—feeding low-cost, high-conversion demand. Paid search and metasearch (Google ~80% search market share) extend reach at scale and secure incremental bookings beyond organic. Retargeting recovers browsers and can lift conversion rates by up to 70%, balancing efficiency with volume growth.
Affiliate and referral partnerships
Travel publishers and bloggers drive incremental traffic to HomeToGo via tracked links, with affiliate conversion rates typically 1–3% and cost-per-acquisition often lower than paid search. White-label and co-branded experiences expand distribution into publisher audiences and OTA ecosystems, increasing reach without direct-brand spend. Revenue shares, commonly 5–20% in vacation-rental partnerships, align incentives and scale performance. This diversifies acquisition beyond direct channels, reducing reliance on paid search and organic alone.
Supply-side connectivity with OTAs and PMs
Supply-side connectivity with major OTAs and property managers (Booking.com, Vrbo, Airbnb and leading PMs) drives HomeToGo's inventory breadth, aggregating over 18 million listings across 50+ countries. Real-time sync keeps rates and calendars accurate, reducing double-booking risk and enabling dynamic pricing alignment. Flexible distribution agreements support varied geographies and niches, ensuring consistent availability where demand exists.
- Integrations: Booking.com, Vrbo, Airbnb, leading PMs
- Inventory: 18M+ listings
- Reach: 50+ countries
- Benefits: real-time rates/calendars, flexible distribution
Multilingual support and service
- help centers and 24/7 support
- 75% prefer native-language service
- proactive communication reduces disruptions
- reliability drives repeat bookings
Digital-first rental aggregator: 18M+ listings in 200+ countries
HomeToGo's place strategy is digital-first via website/apps aggregating 18M+ listings and serving 200+ countries, maximizing global accessibility and conversion. Organic search (~53% of traffic) plus paid/metasearch (Google ~80% search share) and affiliates (1–3% conv.) balance cost and volume. Supply integrations with OTAs/PMs and 24/7 multilingual support (75% prefer native language) secure availability and repeat bookings.
| Metric | Value |
|---|---|
| Listings | 18M+ |
| Reach | 200+ countries |
| Organic traffic | ~53% |
| Google share | ~80% |
| Affiliate conv. | 1–3% |
| Rev share | 5–20% |
| Native-language pref. | 75% |
Full Version Awaits
HomeToGo 4P's Marketing Mix Analysis
The HomeToGo 4P's Marketing Mix Analysis you see here is the actual, final document you’ll receive instantly after purchase—no mockups or samples. It’s fully editable and ready to use, containing the same complete content available for download at checkout.
Description
Your Shortcut to a Strategic 4Ps Breakdown
Discover how HomeToGo’s product offerings, pricing tiers, distribution channels, and promotional tactics combine to capture market share and maximize bookings; this preview highlights key moves but the full 4P’s Marketing Mix Analysis reveals the strategic detail. Perfect for consultants, students, and managers, the complete, editable report saves research time and provides ready-to-use slides. Unlock the full analysis now to apply proven tactics and benchmark performance.
Product
Aggregated vacation rental meta-search
HomeToGo centralizes over 20 million listings from 700+ providers into one searchable catalogue as of 2024, letting users discover, compare and book diverse accommodations in one place. This aggregation reduces search friction and widens choice, boosting conversion by simplifying cross-platform comparison. Market reach and provider breadth position the platform as a neutral marketplace focused on transparency and breadth.
Powerful compare-and-book experience
Tools surface key variables—total price, amenities, cancellation, location—so users compare options across HomeToGo's portfolio; as of 2024 HomeToGo aggregates over 20 million listings. Side-by-side comparisons and structured listing data accelerate decision-making and reduce time-to-book. Streamlined checkout routes users to the correct partner booking path, improving conversion while preserving partner relationships.
Advanced filters, maps, and reviews
Granular filters let users narrow 18 million+ HomeToGo listings (2024) by budget, property type and features, aligning inventory to traveler intent and reducing search time. Interactive maps visualize availability, proximity and neighborhood context to support route and stay planning. Review summaries and trust signals condense sentiment and reduce uncertainty, boosting booking confidence and reported conversion uplifts in platform tests.
Cross-platform UX: web and mobile apps
Responsive web and native apps let users search and book on-the-go, with mobile accounting for about 66% of travel bookings in 2024 (Statista); saved searches, favorites and alerts sync across devices to reduce friction. Fast load times and intuitive UI cut drop-off (Google: >50% abandon if mobile load >3s) and this consistency drives repeat use and higher lifetime value.
- Mobile-first: 66% travel bookings (2024)
- Device sync: saved searches, alerts, favorites
- Performance: >50% abandon if load >3s (Google)
- Outcome: higher repeat rates and LTV
Partner tools and integrations
Connectivity with PMS and channel managers keeps availability and pricing current through real-time syncing, while APIs and dashboards surface feed quality, performance insights, and payout tracking to partners. Flexible routing supports both on-site booking and redirect flows, strengthening supply depth and improving data accuracy across listings.
- Real-time PMS sync
- API-driven feed quality
- Performance dashboards
- Payout tracking
- On-site or redirect routing
20M+ listings centralized; fast mobile search with ≈66% bookings, real-time sync
HomeToGo aggregates 20 million+ listings (2024), centralizing discovery, comparison and booking to reduce search friction and boost conversion. Granular filters, maps and review summaries speed decisions; responsive web/apps (mobile ≈66% of bookings, 2024) and fast performance cut drop-off. Real-time PMS/API sync and flexible routing maintain accurate pricing/availability and partner payout transparency.
| Metric | Value | Source |
|---|---|---|
| Listings | 20M+ | HomeToGo 2024 |
| Mobile share | ≈66% | Statista 2024 |
| Mobile load abandon | > 50% if >3s |
What is included in the product
Detailed Word Document
Delivers a concise, company-specific deep dive into HomeToGo’s Product, Price, Place, and Promotion strategies—grounded in real practices and competitive context—ideal for managers, consultants, and marketers seeking a structured, editable analysis with examples, positioning, and strategic implications for benchmarking, case studies, or strategy audits.
Customizable Excel Spreadsheet
Condenses HomeToGo’s 4P marketing analysis into a high-level, at-a-glance one-pager that relieves briefing and alignment pain points; customizable and plug-and-play for meetings, decks, cross-brand comparisons, and for helping non-marketing stakeholders quickly grasp strategic direction.
Place
Global reach via website and apps
Primary distribution for HomeToGo runs through its website and mobile apps, aggregating over 18 million vacation rental listings and reaching customers in 200+ countries; this digital-first channel drives scale and conversion. International coverage ensures broad demand access while localized language, currency, and content—available across markets—improve relevance and booking rates. These features maximize accessibility for travelers worldwide and support global revenue growth.
SEO and performance media footprint
Structured inventory pages capture high-intent organic traffic—organic search delivers roughly 53% of website visits industry-wide—feeding low-cost, high-conversion demand. Paid search and metasearch (Google ~80% search market share) extend reach at scale and secure incremental bookings beyond organic. Retargeting recovers browsers and can lift conversion rates by up to 70%, balancing efficiency with volume growth.
Affiliate and referral partnerships
Travel publishers and bloggers drive incremental traffic to HomeToGo via tracked links, with affiliate conversion rates typically 1–3% and cost-per-acquisition often lower than paid search. White-label and co-branded experiences expand distribution into publisher audiences and OTA ecosystems, increasing reach without direct-brand spend. Revenue shares, commonly 5–20% in vacation-rental partnerships, align incentives and scale performance. This diversifies acquisition beyond direct channels, reducing reliance on paid search and organic alone.
Supply-side connectivity with OTAs and PMs
Supply-side connectivity with major OTAs and property managers (Booking.com, Vrbo, Airbnb and leading PMs) drives HomeToGo's inventory breadth, aggregating over 18 million listings across 50+ countries. Real-time sync keeps rates and calendars accurate, reducing double-booking risk and enabling dynamic pricing alignment. Flexible distribution agreements support varied geographies and niches, ensuring consistent availability where demand exists.
- Integrations: Booking.com, Vrbo, Airbnb, leading PMs
- Inventory: 18M+ listings
- Reach: 50+ countries
- Benefits: real-time rates/calendars, flexible distribution
Multilingual support and service
- help centers and 24/7 support
- 75% prefer native-language service
- proactive communication reduces disruptions
- reliability drives repeat bookings
Digital-first rental aggregator: 18M+ listings in 200+ countries
HomeToGo's place strategy is digital-first via website/apps aggregating 18M+ listings and serving 200+ countries, maximizing global accessibility and conversion. Organic search (~53% of traffic) plus paid/metasearch (Google ~80% search share) and affiliates (1–3% conv.) balance cost and volume. Supply integrations with OTAs/PMs and 24/7 multilingual support (75% prefer native language) secure availability and repeat bookings.
| Metric | Value |
|---|---|
| Listings | 18M+ |
| Reach | 200+ countries |
| Organic traffic | ~53% |
| Google share | ~80% |
| Affiliate conv. | 1–3% |
| Rev share | 5–20% |
| Native-language pref. | 75% |
Full Version Awaits
HomeToGo 4P's Marketing Mix Analysis
The HomeToGo 4P's Marketing Mix Analysis you see here is the actual, final document you’ll receive instantly after purchase—no mockups or samples. It’s fully editable and ready to use, containing the same complete content available for download at checkout.











