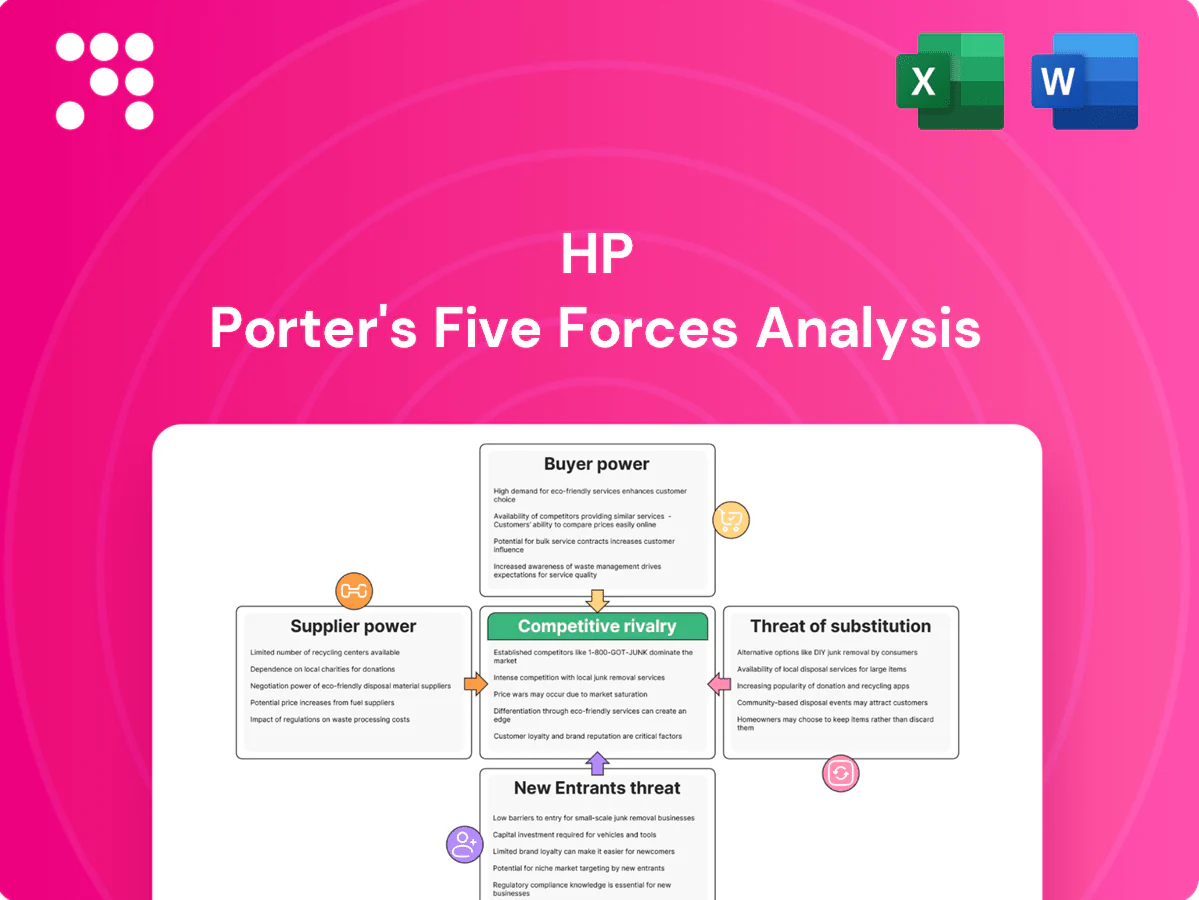
HP Porter's Five Forces Analysis

A Must-Have Tool for Decision-Makers
HP’s Porter's Five Forces snapshot highlights competitive intensity across supplier leverage, buyer power, substitutes, new entrants, and rivalry—revealing pressures on margins and growth. This brief teases strategic risks and opportunities; unlock the full Porter's Five Forces Analysis to access detailed force ratings, visuals, and actionable recommendations tailored to HP.
Suppliers Bargaining Power

Concentrated CPU/GPU suppliers
HP depends on a few dominant chip vendors—Intel (~66% x86 client CPU share in 2024), AMD (~34%) and NVIDIA (~82% of discrete GPUs in 2024)—concentrating supplier bargaining power. Limited high-performance alternatives create price and allocation pressure that can squeeze HP’s margins and delay launches; HP Inc. reported ~63.1B USD revenue in FY2024, so disruptions have material impact. HP mitigates risk via multi-sourcing where feasible and tighter demand forecasting.
ODM/EMS dependency
Contract manufacturers and ODMs such as Foxconn, Quanta and Compal control cost, capacity and lead times for HP; industry peak-line utilization often exceeds 85-90%, compressing available capacity and raising supplier leverage. HPs scale and procurement spend enable price negotiation, but peak-cycle line-time scarcity shifts bargaining power to suppliers. Tight oversight on quality control and IP protection raises transaction costs. A diversified manufacturing footprint reduces single-supplier concentration risk.

Specialty print consumables
Proprietary inks, toners and 3D materials use specialized chemistries that limit qualified suppliers, raising supplier bargaining power. Fewer vendors can extract better terms, particularly for advanced formulations; HP held roughly 40% of global page volume in 2024, strengthening its negotiating leverage. HP offsets risk via in-house R&D and long-term supply agreements, and vertical integration in supplies stabilizes availability and margins.

Logistics and component shortages
Global freight volatility and shortages of panels, memory and substrates cyclically raise supplier bargaining power; freight spikes and allocation limits compress margins even as volumes recover. HP’s scale and hedging secure capacity and mitigate disruption but cannot fully offset cost pass-throughs. Regionalization of manufacturing and sourcing is being accelerated to improve resilience.
- Higher supplier leverage during allocation
- Freight spikes squeeze profitability
- HP hedging secures capacity, not full cost relief
- Regionalization improves resilience
Standards and switching costs
Industry standards reduce lock-in for many PC components, tempering supplier power, but platform dependencies in firmware, drivers and thermal design create switching frictions that raise requalification time and engineering cost. Design requalification can add months and six-figure engineering spends per platform; Intel held roughly 70% CPU share versus AMD 30% in 2024 (Mercury Research). HP balances cost-downs with platform stability to manage this risk.
- Standards lower lock-in
- Platform deps increase switching frictions
- Requalification = months + significant engineering cost
- 2024 CPU share: Intel ~70% / AMD ~30%
Concentration (CPU~70% GPU~82%) pressures margins on $63.1B FY24 rev
Suppliers (Intel ~70% CPU, NVIDIA ~82% discrete GPU share in 2024) exert strong pricing and allocation pressure, risking HPs margins on $63.1B FY2024 revenue. Contract manufacturers (Foxconn/Quanta) hold capacity leverage during >85% utilization cycles; specialized inks/toners limit alternatives but HP vertical integration and hedging mitigate exposure.
| Supplier | 2024 metric | Impact |
|---|---|---|
| CPUs | Intel ~70% share | High pricing/lock-in |
| GPUs | NVIDIA ~82% | Allocation risk |
| Contract Mfg | Utilization >85% | Capacity leverage |
| Supplies | HP ~40% page volume | Negotiation strength |
What is included in the product
 Detailed Word Document
Tailored Porter's Five Forces analysis of HP that uncovers competition drivers, supplier and buyer power, threat of substitutes and new entrants, and identifies disruptive forces and market dynamics affecting pricing, profitability and market share; delivered in an editable format for investor materials, strategy decks, or academic use.

 Customizable Excel Spreadsheet
A compact, customizable HP Porter’s Five Forces sheet that visualizes competitive pressure instantly with spider charts, lets you swap scenarios or data, and produces clean, copy-ready slides for faster strategic decisions.
Customers Bargaining Power

Enterprise RFP leverage
Large enterprises and public sector buyers bundle volume, services and SLAs in competitive RFPs, forcing HP to quote across PCs, printers and MPS with steep concessions; enterprise RFPs commonly lock 3–5 year terms. Multi-year contracts intensify discounting—often in the low‑teens to ~20% range—while improving revenue visibility and renewal pipelines. HP Inc. reported roughly $58.8 billion revenue in FY2024, and major reference wins materially influence broader market perception and subsequent deal flow.
Price-sensitive consumers
Price-sensitive consumers compare aggressively across brands and channels with transparent pricing, pressuring mainstream PC and printer margins; HP Personal Systems revenue in FY2024 was about $28.4 billion while Printing remained significant, highlighting volume-driven competition. Promotions and specs drive buying decisions, compressing ASPs as IDC reported global PC shipments declined ~8% in 2024. Loyalty is fragile absent clear differentiation, so HP leans on bundles and extended warranties to defend ASPs.

Low switching costs
Low switching costs prevail as Windows holds about 75% of desktop OS share (2024) and cloud sync means data portability is near-universal with over 90% of enterprises using cloud services (2024), so consumers move between PC brands easily. Printer swaps are simple too, though HP’s ~40% global printer share (2024) and cartridge ecosystems create mild lock-in. Buyers leverage this to extract better pricing and service terms. HP responds with ecosystem features, managed print services, subscription supplies and trade-in programs to retain customers.

Channel influence
Distributors, retailers and e-commerce platforms shape HP assortment, pricing and visibility; in 2024 e-commerce accounted for roughly 25% of global retail sales, increasing channel leverage. Large channels routinely demand MDF, rebates and extended payment terms, while marketplace ratings (about 87% of shoppers consult reviews) amplify buyer power. HP invests in channel programs and co-op funds to secure shelf space and promotions.
- Distributors/retailers: assortment & pricing control
- MDF/rebates: negotiated promotional spend
- Reviews: ~87% influence purchase decisions
- HP action: channel programs, co-op funds, shelf/promotions
Outcome-based service expectations
Outcome-based MPS and DaaS buyers demand uptime guarantees (often 99%+ SLAs) and embedded analytics; performance-based pricing transfers operational risk to HP, strengthening buyer leverage while HP reported roughly $63.5B revenue in FY2024, making service margins strategic to protect.
Strong service delivery creates contractual stickiness and upsell paths; conversely missed SLAs trigger penalties or churn in a managed print market estimated near $56B in 2024.
- Uptime guarantees: 99%+
- Risk shift: performance pricing increases buyer leverage
- Stickiness: drives renewals and upsell
- Penalties/churn: poor performance reduces lifetime value
Buyers extract deep discounts; FY2024 revenue $58.8B
Buyers exert strong leverage: enterprise RFPs force multi‑year discounts (low‑teens–~20%) while consumers compress ASPs; HP Inc. FY2024 revenue ~$58.8B, Personal Systems ~$28.4B. Low switching costs with ~40% printer share give mild lock‑in; e‑commerce ~25%, reviews influence ~87%, managed print market ~$56B.
| Metric | 2024 |
|---|---|
| HP revenue | $58.8B |
| Personal Systems | $28.4B |
| Printer share | ~40% |
| PC shipments | −8% |
| E‑commerce | ~25% |
Full Version Awaits
HP Porter's Five Forces Analysis
This preview shows the exact HP Porter's Five Forces Analysis you'll receive after purchase—fully complete, professionally formatted, and ready to use. There are no samples or placeholders; the content, tables, and conclusions here are identical to the downloadable file. Purchase grants instant access to this same document for immediate application.

A Must-Have Tool for Decision-Makers
HP’s Porter's Five Forces snapshot highlights competitive intensity across supplier leverage, buyer power, substitutes, new entrants, and rivalry—revealing pressures on margins and growth. This brief teases strategic risks and opportunities; unlock the full Porter's Five Forces Analysis to access detailed force ratings, visuals, and actionable recommendations tailored to HP.
Suppliers Bargaining Power
Concentrated CPU/GPU suppliers
HP depends on a few dominant chip vendors—Intel (~66% x86 client CPU share in 2024), AMD (~34%) and NVIDIA (~82% of discrete GPUs in 2024)—concentrating supplier bargaining power. Limited high-performance alternatives create price and allocation pressure that can squeeze HP’s margins and delay launches; HP Inc. reported ~63.1B USD revenue in FY2024, so disruptions have material impact. HP mitigates risk via multi-sourcing where feasible and tighter demand forecasting.
ODM/EMS dependency
Contract manufacturers and ODMs such as Foxconn, Quanta and Compal control cost, capacity and lead times for HP; industry peak-line utilization often exceeds 85-90%, compressing available capacity and raising supplier leverage. HPs scale and procurement spend enable price negotiation, but peak-cycle line-time scarcity shifts bargaining power to suppliers. Tight oversight on quality control and IP protection raises transaction costs. A diversified manufacturing footprint reduces single-supplier concentration risk.
Specialty print consumables
Proprietary inks, toners and 3D materials use specialized chemistries that limit qualified suppliers, raising supplier bargaining power. Fewer vendors can extract better terms, particularly for advanced formulations; HP held roughly 40% of global page volume in 2024, strengthening its negotiating leverage. HP offsets risk via in-house R&D and long-term supply agreements, and vertical integration in supplies stabilizes availability and margins.
Logistics and component shortages
Global freight volatility and shortages of panels, memory and substrates cyclically raise supplier bargaining power; freight spikes and allocation limits compress margins even as volumes recover. HP’s scale and hedging secure capacity and mitigate disruption but cannot fully offset cost pass-throughs. Regionalization of manufacturing and sourcing is being accelerated to improve resilience.
- Higher supplier leverage during allocation
- Freight spikes squeeze profitability
- HP hedging secures capacity, not full cost relief
- Regionalization improves resilience
Standards and switching costs
Industry standards reduce lock-in for many PC components, tempering supplier power, but platform dependencies in firmware, drivers and thermal design create switching frictions that raise requalification time and engineering cost. Design requalification can add months and six-figure engineering spends per platform; Intel held roughly 70% CPU share versus AMD 30% in 2024 (Mercury Research). HP balances cost-downs with platform stability to manage this risk.
- Standards lower lock-in
- Platform deps increase switching frictions
- Requalification = months + significant engineering cost
- 2024 CPU share: Intel ~70% / AMD ~30%
Concentration (CPU~70% GPU~82%) pressures margins on $63.1B FY24 rev
Suppliers (Intel ~70% CPU, NVIDIA ~82% discrete GPU share in 2024) exert strong pricing and allocation pressure, risking HPs margins on $63.1B FY2024 revenue. Contract manufacturers (Foxconn/Quanta) hold capacity leverage during >85% utilization cycles; specialized inks/toners limit alternatives but HP vertical integration and hedging mitigate exposure.
| Supplier | 2024 metric | Impact |
|---|---|---|
| CPUs | Intel ~70% share | High pricing/lock-in |
| GPUs | NVIDIA ~82% | Allocation risk |
| Contract Mfg | Utilization >85% | Capacity leverage |
| Supplies | HP ~40% page volume | Negotiation strength |
What is included in the product
Detailed Word Document
Tailored Porter's Five Forces analysis of HP that uncovers competition drivers, supplier and buyer power, threat of substitutes and new entrants, and identifies disruptive forces and market dynamics affecting pricing, profitability and market share; delivered in an editable format for investor materials, strategy decks, or academic use.
Customizable Excel Spreadsheet
A compact, customizable HP Porter’s Five Forces sheet that visualizes competitive pressure instantly with spider charts, lets you swap scenarios or data, and produces clean, copy-ready slides for faster strategic decisions.
Customers Bargaining Power
Enterprise RFP leverage
Large enterprises and public sector buyers bundle volume, services and SLAs in competitive RFPs, forcing HP to quote across PCs, printers and MPS with steep concessions; enterprise RFPs commonly lock 3–5 year terms. Multi-year contracts intensify discounting—often in the low‑teens to ~20% range—while improving revenue visibility and renewal pipelines. HP Inc. reported roughly $58.8 billion revenue in FY2024, and major reference wins materially influence broader market perception and subsequent deal flow.
Price-sensitive consumers
Price-sensitive consumers compare aggressively across brands and channels with transparent pricing, pressuring mainstream PC and printer margins; HP Personal Systems revenue in FY2024 was about $28.4 billion while Printing remained significant, highlighting volume-driven competition. Promotions and specs drive buying decisions, compressing ASPs as IDC reported global PC shipments declined ~8% in 2024. Loyalty is fragile absent clear differentiation, so HP leans on bundles and extended warranties to defend ASPs.
Low switching costs
Low switching costs prevail as Windows holds about 75% of desktop OS share (2024) and cloud sync means data portability is near-universal with over 90% of enterprises using cloud services (2024), so consumers move between PC brands easily. Printer swaps are simple too, though HP’s ~40% global printer share (2024) and cartridge ecosystems create mild lock-in. Buyers leverage this to extract better pricing and service terms. HP responds with ecosystem features, managed print services, subscription supplies and trade-in programs to retain customers.
Channel influence
Distributors, retailers and e-commerce platforms shape HP assortment, pricing and visibility; in 2024 e-commerce accounted for roughly 25% of global retail sales, increasing channel leverage. Large channels routinely demand MDF, rebates and extended payment terms, while marketplace ratings (about 87% of shoppers consult reviews) amplify buyer power. HP invests in channel programs and co-op funds to secure shelf space and promotions.
- Distributors/retailers: assortment & pricing control
- MDF/rebates: negotiated promotional spend
- Reviews: ~87% influence purchase decisions
- HP action: channel programs, co-op funds, shelf/promotions
Outcome-based service expectations
Outcome-based MPS and DaaS buyers demand uptime guarantees (often 99%+ SLAs) and embedded analytics; performance-based pricing transfers operational risk to HP, strengthening buyer leverage while HP reported roughly $63.5B revenue in FY2024, making service margins strategic to protect.
Strong service delivery creates contractual stickiness and upsell paths; conversely missed SLAs trigger penalties or churn in a managed print market estimated near $56B in 2024.
- Uptime guarantees: 99%+
- Risk shift: performance pricing increases buyer leverage
- Stickiness: drives renewals and upsell
- Penalties/churn: poor performance reduces lifetime value
Buyers extract deep discounts; FY2024 revenue $58.8B
Buyers exert strong leverage: enterprise RFPs force multi‑year discounts (low‑teens–~20%) while consumers compress ASPs; HP Inc. FY2024 revenue ~$58.8B, Personal Systems ~$28.4B. Low switching costs with ~40% printer share give mild lock‑in; e‑commerce ~25%, reviews influence ~87%, managed print market ~$56B.
| Metric | 2024 |
|---|---|
| HP revenue | $58.8B |
| Personal Systems | $28.4B |
| Printer share | ~40% |
| PC shipments | −8% |
| E‑commerce | ~25% |
Full Version Awaits
HP Porter's Five Forces Analysis
This preview shows the exact HP Porter's Five Forces Analysis you'll receive after purchase—fully complete, professionally formatted, and ready to use. There are no samples or placeholders; the content, tables, and conclusions here are identical to the downloadable file. Purchase grants instant access to this same document for immediate application.
Original: $10.00
-65%$10.00
$3.50Description
A Must-Have Tool for Decision-Makers
HP’s Porter's Five Forces snapshot highlights competitive intensity across supplier leverage, buyer power, substitutes, new entrants, and rivalry—revealing pressures on margins and growth. This brief teases strategic risks and opportunities; unlock the full Porter's Five Forces Analysis to access detailed force ratings, visuals, and actionable recommendations tailored to HP.
Suppliers Bargaining Power
Concentrated CPU/GPU suppliers
HP depends on a few dominant chip vendors—Intel (~66% x86 client CPU share in 2024), AMD (~34%) and NVIDIA (~82% of discrete GPUs in 2024)—concentrating supplier bargaining power. Limited high-performance alternatives create price and allocation pressure that can squeeze HP’s margins and delay launches; HP Inc. reported ~63.1B USD revenue in FY2024, so disruptions have material impact. HP mitigates risk via multi-sourcing where feasible and tighter demand forecasting.
ODM/EMS dependency
Contract manufacturers and ODMs such as Foxconn, Quanta and Compal control cost, capacity and lead times for HP; industry peak-line utilization often exceeds 85-90%, compressing available capacity and raising supplier leverage. HPs scale and procurement spend enable price negotiation, but peak-cycle line-time scarcity shifts bargaining power to suppliers. Tight oversight on quality control and IP protection raises transaction costs. A diversified manufacturing footprint reduces single-supplier concentration risk.
Specialty print consumables
Proprietary inks, toners and 3D materials use specialized chemistries that limit qualified suppliers, raising supplier bargaining power. Fewer vendors can extract better terms, particularly for advanced formulations; HP held roughly 40% of global page volume in 2024, strengthening its negotiating leverage. HP offsets risk via in-house R&D and long-term supply agreements, and vertical integration in supplies stabilizes availability and margins.
Logistics and component shortages
Global freight volatility and shortages of panels, memory and substrates cyclically raise supplier bargaining power; freight spikes and allocation limits compress margins even as volumes recover. HP’s scale and hedging secure capacity and mitigate disruption but cannot fully offset cost pass-throughs. Regionalization of manufacturing and sourcing is being accelerated to improve resilience.
- Higher supplier leverage during allocation
- Freight spikes squeeze profitability
- HP hedging secures capacity, not full cost relief
- Regionalization improves resilience
Standards and switching costs
Industry standards reduce lock-in for many PC components, tempering supplier power, but platform dependencies in firmware, drivers and thermal design create switching frictions that raise requalification time and engineering cost. Design requalification can add months and six-figure engineering spends per platform; Intel held roughly 70% CPU share versus AMD 30% in 2024 (Mercury Research). HP balances cost-downs with platform stability to manage this risk.
- Standards lower lock-in
- Platform deps increase switching frictions
- Requalification = months + significant engineering cost
- 2024 CPU share: Intel ~70% / AMD ~30%
Concentration (CPU~70% GPU~82%) pressures margins on $63.1B FY24 rev
Suppliers (Intel ~70% CPU, NVIDIA ~82% discrete GPU share in 2024) exert strong pricing and allocation pressure, risking HPs margins on $63.1B FY2024 revenue. Contract manufacturers (Foxconn/Quanta) hold capacity leverage during >85% utilization cycles; specialized inks/toners limit alternatives but HP vertical integration and hedging mitigate exposure.
| Supplier | 2024 metric | Impact |
|---|---|---|
| CPUs | Intel ~70% share | High pricing/lock-in |
| GPUs | NVIDIA ~82% | Allocation risk |
| Contract Mfg | Utilization >85% | Capacity leverage |
| Supplies | HP ~40% page volume | Negotiation strength |
What is included in the product
Detailed Word Document
Tailored Porter's Five Forces analysis of HP that uncovers competition drivers, supplier and buyer power, threat of substitutes and new entrants, and identifies disruptive forces and market dynamics affecting pricing, profitability and market share; delivered in an editable format for investor materials, strategy decks, or academic use.
Customizable Excel Spreadsheet
A compact, customizable HP Porter’s Five Forces sheet that visualizes competitive pressure instantly with spider charts, lets you swap scenarios or data, and produces clean, copy-ready slides for faster strategic decisions.
Customers Bargaining Power
Enterprise RFP leverage
Large enterprises and public sector buyers bundle volume, services and SLAs in competitive RFPs, forcing HP to quote across PCs, printers and MPS with steep concessions; enterprise RFPs commonly lock 3–5 year terms. Multi-year contracts intensify discounting—often in the low‑teens to ~20% range—while improving revenue visibility and renewal pipelines. HP Inc. reported roughly $58.8 billion revenue in FY2024, and major reference wins materially influence broader market perception and subsequent deal flow.
Price-sensitive consumers
Price-sensitive consumers compare aggressively across brands and channels with transparent pricing, pressuring mainstream PC and printer margins; HP Personal Systems revenue in FY2024 was about $28.4 billion while Printing remained significant, highlighting volume-driven competition. Promotions and specs drive buying decisions, compressing ASPs as IDC reported global PC shipments declined ~8% in 2024. Loyalty is fragile absent clear differentiation, so HP leans on bundles and extended warranties to defend ASPs.
Low switching costs
Low switching costs prevail as Windows holds about 75% of desktop OS share (2024) and cloud sync means data portability is near-universal with over 90% of enterprises using cloud services (2024), so consumers move between PC brands easily. Printer swaps are simple too, though HP’s ~40% global printer share (2024) and cartridge ecosystems create mild lock-in. Buyers leverage this to extract better pricing and service terms. HP responds with ecosystem features, managed print services, subscription supplies and trade-in programs to retain customers.
Channel influence
Distributors, retailers and e-commerce platforms shape HP assortment, pricing and visibility; in 2024 e-commerce accounted for roughly 25% of global retail sales, increasing channel leverage. Large channels routinely demand MDF, rebates and extended payment terms, while marketplace ratings (about 87% of shoppers consult reviews) amplify buyer power. HP invests in channel programs and co-op funds to secure shelf space and promotions.
- Distributors/retailers: assortment & pricing control
- MDF/rebates: negotiated promotional spend
- Reviews: ~87% influence purchase decisions
- HP action: channel programs, co-op funds, shelf/promotions
Outcome-based service expectations
Outcome-based MPS and DaaS buyers demand uptime guarantees (often 99%+ SLAs) and embedded analytics; performance-based pricing transfers operational risk to HP, strengthening buyer leverage while HP reported roughly $63.5B revenue in FY2024, making service margins strategic to protect.
Strong service delivery creates contractual stickiness and upsell paths; conversely missed SLAs trigger penalties or churn in a managed print market estimated near $56B in 2024.
- Uptime guarantees: 99%+
- Risk shift: performance pricing increases buyer leverage
- Stickiness: drives renewals and upsell
- Penalties/churn: poor performance reduces lifetime value
Buyers extract deep discounts; FY2024 revenue $58.8B
Buyers exert strong leverage: enterprise RFPs force multi‑year discounts (low‑teens–~20%) while consumers compress ASPs; HP Inc. FY2024 revenue ~$58.8B, Personal Systems ~$28.4B. Low switching costs with ~40% printer share give mild lock‑in; e‑commerce ~25%, reviews influence ~87%, managed print market ~$56B.
| Metric | 2024 |
|---|---|
| HP revenue | $58.8B |
| Personal Systems | $28.4B |
| Printer share | ~40% |
| PC shipments | −8% |
| E‑commerce | ~25% |
Full Version Awaits
HP Porter's Five Forces Analysis
This preview shows the exact HP Porter's Five Forces Analysis you'll receive after purchase—fully complete, professionally formatted, and ready to use. There are no samples or placeholders; the content, tables, and conclusions here are identical to the downloadable file. Purchase grants instant access to this same document for immediate application.











