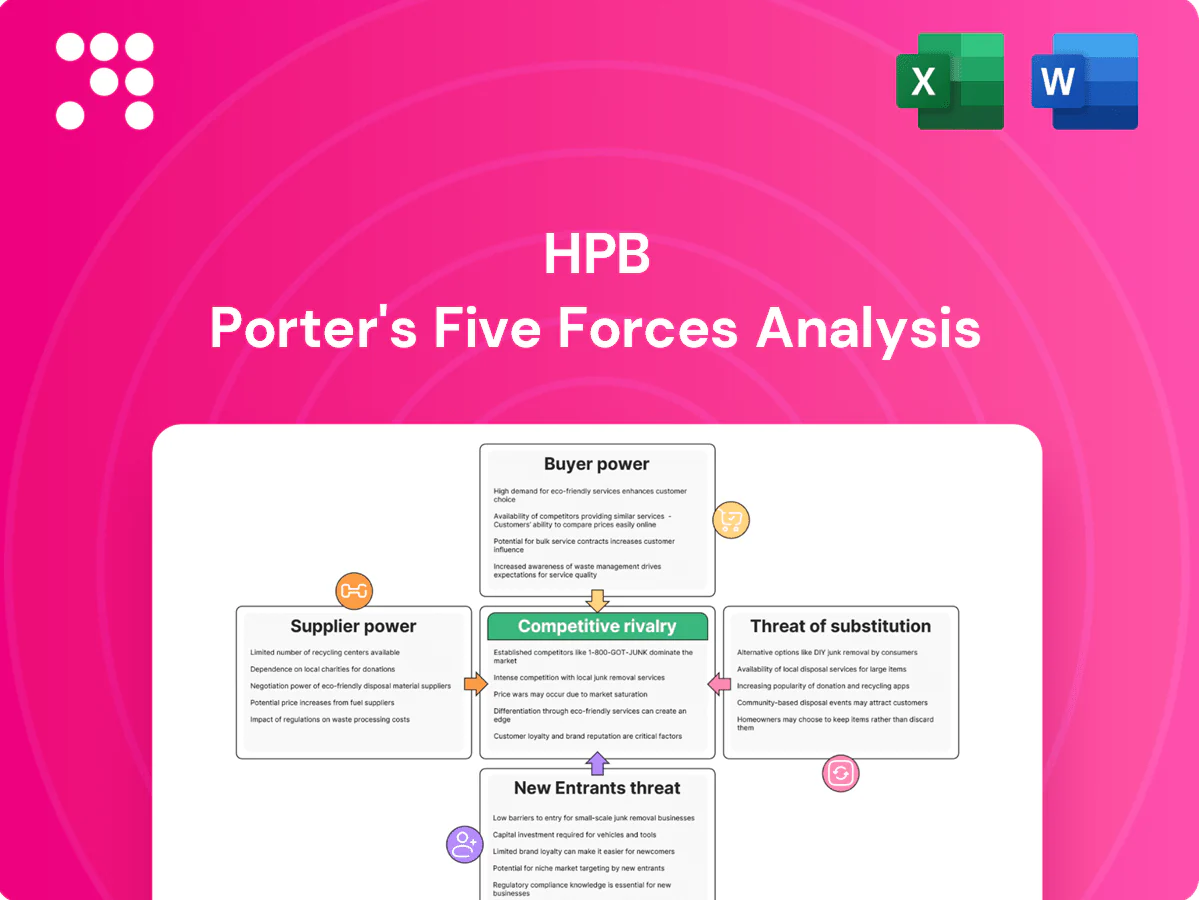
HPB Porter's Five Forces Analysis

Don't Miss the Bigger Picture
HPB's Porter's Five Forces snapshot highlights evolving buyer power, supplier dynamics, competitive rivalry, substitute threats, and barriers for new entrants that shape its strategic position. These forces reveal where HPB can defend margins or pursue growth. The full report quantifies force intensity and strategic implications. Unlock the complete analysis to inform smarter investment and strategy decisions.
Suppliers Bargaining Power

Concentrated core IT vendors
HPB relies on a small set of core banking and payments vendors—Temenos, FIS, Oracle, Finastra and SAP—whose dominance in 2024 sustains high switching costs and vendor power. Implementations typically run 18–36 months with complex integrations that lock architectures and constrain customization. That dynamic pressures pricing and contract terms. Multi-vendor strategies mitigate single-vendor risk but raise coordination and operational costs.
Wholesale and central bank funding
Access to interbank, covered bond and ECB liquidity (ECB deposit rate 4.00% as of June 2024) directly sets the pricing power of funding suppliers, with TLTRO terms and availability shaping bank funding mixes. In tight markets spreads widen and covenants toughen, increasing supplier leverage. Since Croatia adopted the euro on 1 January 2023, eurozone conditions transmit rapidly to Croatian funding costs. Strong deposit bases in Croatia blunt but do not eliminate this exposure.

Card schemes and payment rails
Visa/Mastercard and SEPA infrastructures set fee structures and compliance requirements; Visa and Mastercard account for roughly 80% of global card volume in 2024, and SEPA spans 36 participants with SEPA Instant limits up to €100,000.

Talent and compliance expertise
Scarce specialist risk, AML and digital talent has increased employee bargaining power; compliance headcount demand rose about 20% in 2024, pushing average compliance salary growth into the high single digits and lifting retention incentives and total operating costs.
- Specialist scarcity
- Regulatory demand ↑
- Wage pressure
- Outsourcing adds oversight
Data, cloud, and cybersecurity providers
Cloud and security vendors supply critical, hard‑to‑substitute capabilities, with AWS ~32%, Azure ~23% and Google ~10% of the 2024 cloud market and the global cybersecurity market about 220bn in 2024. Certifications, data residency and resilience requirements narrow supplier choices and enable pricing uplifts and mandatory upgrades. Contracts must trade off cost, latency and regulatory fit.
- Critical market concentration
- Regulatory constraints
- Pricing leverage
High supplier power - 18-36m core locks, 4.00% ECB rate, dominant card/cloud players
Supplier power is high: core banking vendors (Temenos, FIS, Oracle, Finastra, SAP) create 18–36 month lock‑ins; ECB deposit rate 4.00% (Jun 2024) and Croatia euro adoption (1 Jan 2023) transmit funding pressure. Visa/Mastercard ~80% share and SEPA rules fix fees; AWS 32%, Azure 23%, Google 10% (cloud 2024). Compliance headcount +20% (2024); cybersecurity market ~220bn (2024).
| Supplier | Metric | 2024 |
|---|---|---|
| Core banking | Implementation | 18–36 months |
| ECB | Deposit rate | 4.00% |
| Cards | Market share | Visa/Mastercard ~80% |
| Cloud | Market share | AWS 32%/Azure 23%/GCP 10% |
| Compliance | Headcount | +20% |
| Cybersecurity | Market size | ~220bn |
What is included in the product
 Detailed Word Document
Uncovers key drivers of competition, customer influence, and market entry risks tailored to HPB's specific competitive landscape. Evaluates supplier and buyer power, threat of substitutes and entrants, and strategic levers that protect and threaten HPB's market share.

 Customizable Excel Spreadsheet
Interactive Porter's Five Forces template that pinpoints dominant competitive pressures and recommends strategic levers—so teams can quickly relieve threats, prioritize actions, and protect margins.
Customers Bargaining Power

Rate‑sensitive retail depositors
Eurozone rate cycles, with the ECB deposit facility at about 4.00% in 2024, have made retail depositors highly price aware, raising sensitivity to offered rates. Comparison tools and mobile apps increase transparency and churn risk, shortening hold times. HPB must calibrate deposit betas to defend NIM without triggering outflows. Loyalty programs and bundled services can partially soften price sensitivity.
Corporate clients with negotiating clout
Larger corporates and public entities run competitive RFPs for lending, cash management and fees, and in 2024 these processes intensified as corporates sought better pricing and covenant terms. Relationship depth and transaction volume give them discount leverage and flexibility on covenants, while syndication options in 2024 amplified their bargaining power by spreading funding across banks. HPB must deliver tailored, volume-sensitive solutions to preserve share and pricing.

Lower switching costs via open banking
Since PSD2 (2018) and rollouts of account‑switching services, lower friction for multi‑banking has accelerated; Open Banking API calls exceeded 1 billion in 2024, enabling aggregators to benchmark offers instantly. That transparency compresses fee spreads and shortens response cycles, shifting differentiation toward UX, speed, and advisory quality.

SME and consumer credit optionality
SME and consumer credit optionality is rising as leasing, factoring and fintech lenders offer credible alternatives; fintechs routinely cut approval times from days to minutes and use promotional APRs (often 0–3% introductory) to win customers, increasing buyer leverage and forcing HPB to match turnaround time as much as price. Risk‑based pricing and pre‑approved offers help retain creditworthy clients by reducing churn.
- Lease/factoring penetration: credible alternative
- Instant approvals: turnaround now minutes vs days
- Promotional APRs: 0–3% intro boosts switching
- Retention: risk-based pricing + pre‑approvals
Digital service expectations
Customers now expect seamless omnichannel journeys, 24/7 support and low fees; 2024 surveys show roughly 72% prioritize digital convenience when choosing services. Poor app performance or downtime can drive churn of up to 30% in the first month after incidents, while social proof and reviews (trusted by ~70% of users in 2024) amplify user bargaining power. Continuous UX improvements are required to defend NPS and reduce acquisition cost.
- Omnichannel demand: 72% (2024)
- Churn after downtime: up to 30%
- Trust in reviews: ~70% (2024)
- Action: continuous UX/NPS focus
ECB ~4% forces tighter deposit betas as open banking and promos drive churn risk
Eurozone deposit sensitivity rose with the ECB rate ~4.00% in 2024, forcing tighter deposit betas to defend NIM. Open Banking API calls >1bn (2024) and fintech promos (0–3% APR) raised switching and time-to-serve expectations. 72% prioritize digital convenience; downtime can cause up to 30% churn, so UX, pricing and tailored corporate solutions are critical.
| Metric | 2024 Value |
|---|---|
| ECB deposit facility | ~4.00% |
| Open Banking API calls | >1 billion |
| Digital convenience priority | 72% |
| Churn after downtime | up to 30% |
| Fintech promo APRs | 0–3% |
Preview the Actual Deliverable
HPB Porter's Five Forces Analysis
This preview shows the exact HPB Porter's Five Forces analysis you'll receive immediately after purchase—fully formatted and ready for use. No mockups or placeholders: the file available for download after payment is the same document you see here. Instant access, professional quality, and no further setup required.

Don't Miss the Bigger Picture
HPB's Porter's Five Forces snapshot highlights evolving buyer power, supplier dynamics, competitive rivalry, substitute threats, and barriers for new entrants that shape its strategic position. These forces reveal where HPB can defend margins or pursue growth. The full report quantifies force intensity and strategic implications. Unlock the complete analysis to inform smarter investment and strategy decisions.
Suppliers Bargaining Power
Concentrated core IT vendors
HPB relies on a small set of core banking and payments vendors—Temenos, FIS, Oracle, Finastra and SAP—whose dominance in 2024 sustains high switching costs and vendor power. Implementations typically run 18–36 months with complex integrations that lock architectures and constrain customization. That dynamic pressures pricing and contract terms. Multi-vendor strategies mitigate single-vendor risk but raise coordination and operational costs.
Wholesale and central bank funding
Access to interbank, covered bond and ECB liquidity (ECB deposit rate 4.00% as of June 2024) directly sets the pricing power of funding suppliers, with TLTRO terms and availability shaping bank funding mixes. In tight markets spreads widen and covenants toughen, increasing supplier leverage. Since Croatia adopted the euro on 1 January 2023, eurozone conditions transmit rapidly to Croatian funding costs. Strong deposit bases in Croatia blunt but do not eliminate this exposure.
Card schemes and payment rails
Visa/Mastercard and SEPA infrastructures set fee structures and compliance requirements; Visa and Mastercard account for roughly 80% of global card volume in 2024, and SEPA spans 36 participants with SEPA Instant limits up to €100,000.
Talent and compliance expertise
Scarce specialist risk, AML and digital talent has increased employee bargaining power; compliance headcount demand rose about 20% in 2024, pushing average compliance salary growth into the high single digits and lifting retention incentives and total operating costs.
- Specialist scarcity
- Regulatory demand ↑
- Wage pressure
- Outsourcing adds oversight
Data, cloud, and cybersecurity providers
Cloud and security vendors supply critical, hard‑to‑substitute capabilities, with AWS ~32%, Azure ~23% and Google ~10% of the 2024 cloud market and the global cybersecurity market about 220bn in 2024. Certifications, data residency and resilience requirements narrow supplier choices and enable pricing uplifts and mandatory upgrades. Contracts must trade off cost, latency and regulatory fit.
- Critical market concentration
- Regulatory constraints
- Pricing leverage
High supplier power - 18-36m core locks, 4.00% ECB rate, dominant card/cloud players
Supplier power is high: core banking vendors (Temenos, FIS, Oracle, Finastra, SAP) create 18–36 month lock‑ins; ECB deposit rate 4.00% (Jun 2024) and Croatia euro adoption (1 Jan 2023) transmit funding pressure. Visa/Mastercard ~80% share and SEPA rules fix fees; AWS 32%, Azure 23%, Google 10% (cloud 2024). Compliance headcount +20% (2024); cybersecurity market ~220bn (2024).
| Supplier | Metric | 2024 |
|---|---|---|
| Core banking | Implementation | 18–36 months |
| ECB | Deposit rate | 4.00% |
| Cards | Market share | Visa/Mastercard ~80% |
| Cloud | Market share | AWS 32%/Azure 23%/GCP 10% |
| Compliance | Headcount | +20% |
| Cybersecurity | Market size | ~220bn |
What is included in the product
Detailed Word Document
Uncovers key drivers of competition, customer influence, and market entry risks tailored to HPB's specific competitive landscape. Evaluates supplier and buyer power, threat of substitutes and entrants, and strategic levers that protect and threaten HPB's market share.
Customizable Excel Spreadsheet
Interactive Porter's Five Forces template that pinpoints dominant competitive pressures and recommends strategic levers—so teams can quickly relieve threats, prioritize actions, and protect margins.
Customers Bargaining Power
Rate‑sensitive retail depositors
Eurozone rate cycles, with the ECB deposit facility at about 4.00% in 2024, have made retail depositors highly price aware, raising sensitivity to offered rates. Comparison tools and mobile apps increase transparency and churn risk, shortening hold times. HPB must calibrate deposit betas to defend NIM without triggering outflows. Loyalty programs and bundled services can partially soften price sensitivity.
Corporate clients with negotiating clout
Larger corporates and public entities run competitive RFPs for lending, cash management and fees, and in 2024 these processes intensified as corporates sought better pricing and covenant terms. Relationship depth and transaction volume give them discount leverage and flexibility on covenants, while syndication options in 2024 amplified their bargaining power by spreading funding across banks. HPB must deliver tailored, volume-sensitive solutions to preserve share and pricing.
Lower switching costs via open banking
Since PSD2 (2018) and rollouts of account‑switching services, lower friction for multi‑banking has accelerated; Open Banking API calls exceeded 1 billion in 2024, enabling aggregators to benchmark offers instantly. That transparency compresses fee spreads and shortens response cycles, shifting differentiation toward UX, speed, and advisory quality.
SME and consumer credit optionality
SME and consumer credit optionality is rising as leasing, factoring and fintech lenders offer credible alternatives; fintechs routinely cut approval times from days to minutes and use promotional APRs (often 0–3% introductory) to win customers, increasing buyer leverage and forcing HPB to match turnaround time as much as price. Risk‑based pricing and pre‑approved offers help retain creditworthy clients by reducing churn.
- Lease/factoring penetration: credible alternative
- Instant approvals: turnaround now minutes vs days
- Promotional APRs: 0–3% intro boosts switching
- Retention: risk-based pricing + pre‑approvals
Digital service expectations
Customers now expect seamless omnichannel journeys, 24/7 support and low fees; 2024 surveys show roughly 72% prioritize digital convenience when choosing services. Poor app performance or downtime can drive churn of up to 30% in the first month after incidents, while social proof and reviews (trusted by ~70% of users in 2024) amplify user bargaining power. Continuous UX improvements are required to defend NPS and reduce acquisition cost.
- Omnichannel demand: 72% (2024)
- Churn after downtime: up to 30%
- Trust in reviews: ~70% (2024)
- Action: continuous UX/NPS focus
ECB ~4% forces tighter deposit betas as open banking and promos drive churn risk
Eurozone deposit sensitivity rose with the ECB rate ~4.00% in 2024, forcing tighter deposit betas to defend NIM. Open Banking API calls >1bn (2024) and fintech promos (0–3% APR) raised switching and time-to-serve expectations. 72% prioritize digital convenience; downtime can cause up to 30% churn, so UX, pricing and tailored corporate solutions are critical.
| Metric | 2024 Value |
|---|---|
| ECB deposit facility | ~4.00% |
| Open Banking API calls | >1 billion |
| Digital convenience priority | 72% |
| Churn after downtime | up to 30% |
| Fintech promo APRs | 0–3% |
Preview the Actual Deliverable
HPB Porter's Five Forces Analysis
This preview shows the exact HPB Porter's Five Forces analysis you'll receive immediately after purchase—fully formatted and ready for use. No mockups or placeholders: the file available for download after payment is the same document you see here. Instant access, professional quality, and no further setup required.
Original: $10.00
-65%$10.00
$3.50Description
Don't Miss the Bigger Picture
HPB's Porter's Five Forces snapshot highlights evolving buyer power, supplier dynamics, competitive rivalry, substitute threats, and barriers for new entrants that shape its strategic position. These forces reveal where HPB can defend margins or pursue growth. The full report quantifies force intensity and strategic implications. Unlock the complete analysis to inform smarter investment and strategy decisions.
Suppliers Bargaining Power
Concentrated core IT vendors
HPB relies on a small set of core banking and payments vendors—Temenos, FIS, Oracle, Finastra and SAP—whose dominance in 2024 sustains high switching costs and vendor power. Implementations typically run 18–36 months with complex integrations that lock architectures and constrain customization. That dynamic pressures pricing and contract terms. Multi-vendor strategies mitigate single-vendor risk but raise coordination and operational costs.
Wholesale and central bank funding
Access to interbank, covered bond and ECB liquidity (ECB deposit rate 4.00% as of June 2024) directly sets the pricing power of funding suppliers, with TLTRO terms and availability shaping bank funding mixes. In tight markets spreads widen and covenants toughen, increasing supplier leverage. Since Croatia adopted the euro on 1 January 2023, eurozone conditions transmit rapidly to Croatian funding costs. Strong deposit bases in Croatia blunt but do not eliminate this exposure.
Card schemes and payment rails
Visa/Mastercard and SEPA infrastructures set fee structures and compliance requirements; Visa and Mastercard account for roughly 80% of global card volume in 2024, and SEPA spans 36 participants with SEPA Instant limits up to €100,000.
Talent and compliance expertise
Scarce specialist risk, AML and digital talent has increased employee bargaining power; compliance headcount demand rose about 20% in 2024, pushing average compliance salary growth into the high single digits and lifting retention incentives and total operating costs.
- Specialist scarcity
- Regulatory demand ↑
- Wage pressure
- Outsourcing adds oversight
Data, cloud, and cybersecurity providers
Cloud and security vendors supply critical, hard‑to‑substitute capabilities, with AWS ~32%, Azure ~23% and Google ~10% of the 2024 cloud market and the global cybersecurity market about 220bn in 2024. Certifications, data residency and resilience requirements narrow supplier choices and enable pricing uplifts and mandatory upgrades. Contracts must trade off cost, latency and regulatory fit.
- Critical market concentration
- Regulatory constraints
- Pricing leverage
High supplier power - 18-36m core locks, 4.00% ECB rate, dominant card/cloud players
Supplier power is high: core banking vendors (Temenos, FIS, Oracle, Finastra, SAP) create 18–36 month lock‑ins; ECB deposit rate 4.00% (Jun 2024) and Croatia euro adoption (1 Jan 2023) transmit funding pressure. Visa/Mastercard ~80% share and SEPA rules fix fees; AWS 32%, Azure 23%, Google 10% (cloud 2024). Compliance headcount +20% (2024); cybersecurity market ~220bn (2024).
| Supplier | Metric | 2024 |
|---|---|---|
| Core banking | Implementation | 18–36 months |
| ECB | Deposit rate | 4.00% |
| Cards | Market share | Visa/Mastercard ~80% |
| Cloud | Market share | AWS 32%/Azure 23%/GCP 10% |
| Compliance | Headcount | +20% |
| Cybersecurity | Market size | ~220bn |
What is included in the product
Detailed Word Document
Uncovers key drivers of competition, customer influence, and market entry risks tailored to HPB's specific competitive landscape. Evaluates supplier and buyer power, threat of substitutes and entrants, and strategic levers that protect and threaten HPB's market share.
Customizable Excel Spreadsheet
Interactive Porter's Five Forces template that pinpoints dominant competitive pressures and recommends strategic levers—so teams can quickly relieve threats, prioritize actions, and protect margins.
Customers Bargaining Power
Rate‑sensitive retail depositors
Eurozone rate cycles, with the ECB deposit facility at about 4.00% in 2024, have made retail depositors highly price aware, raising sensitivity to offered rates. Comparison tools and mobile apps increase transparency and churn risk, shortening hold times. HPB must calibrate deposit betas to defend NIM without triggering outflows. Loyalty programs and bundled services can partially soften price sensitivity.
Corporate clients with negotiating clout
Larger corporates and public entities run competitive RFPs for lending, cash management and fees, and in 2024 these processes intensified as corporates sought better pricing and covenant terms. Relationship depth and transaction volume give them discount leverage and flexibility on covenants, while syndication options in 2024 amplified their bargaining power by spreading funding across banks. HPB must deliver tailored, volume-sensitive solutions to preserve share and pricing.
Lower switching costs via open banking
Since PSD2 (2018) and rollouts of account‑switching services, lower friction for multi‑banking has accelerated; Open Banking API calls exceeded 1 billion in 2024, enabling aggregators to benchmark offers instantly. That transparency compresses fee spreads and shortens response cycles, shifting differentiation toward UX, speed, and advisory quality.
SME and consumer credit optionality
SME and consumer credit optionality is rising as leasing, factoring and fintech lenders offer credible alternatives; fintechs routinely cut approval times from days to minutes and use promotional APRs (often 0–3% introductory) to win customers, increasing buyer leverage and forcing HPB to match turnaround time as much as price. Risk‑based pricing and pre‑approved offers help retain creditworthy clients by reducing churn.
- Lease/factoring penetration: credible alternative
- Instant approvals: turnaround now minutes vs days
- Promotional APRs: 0–3% intro boosts switching
- Retention: risk-based pricing + pre‑approvals
Digital service expectations
Customers now expect seamless omnichannel journeys, 24/7 support and low fees; 2024 surveys show roughly 72% prioritize digital convenience when choosing services. Poor app performance or downtime can drive churn of up to 30% in the first month after incidents, while social proof and reviews (trusted by ~70% of users in 2024) amplify user bargaining power. Continuous UX improvements are required to defend NPS and reduce acquisition cost.
- Omnichannel demand: 72% (2024)
- Churn after downtime: up to 30%
- Trust in reviews: ~70% (2024)
- Action: continuous UX/NPS focus
ECB ~4% forces tighter deposit betas as open banking and promos drive churn risk
Eurozone deposit sensitivity rose with the ECB rate ~4.00% in 2024, forcing tighter deposit betas to defend NIM. Open Banking API calls >1bn (2024) and fintech promos (0–3% APR) raised switching and time-to-serve expectations. 72% prioritize digital convenience; downtime can cause up to 30% churn, so UX, pricing and tailored corporate solutions are critical.
| Metric | 2024 Value |
|---|---|
| ECB deposit facility | ~4.00% |
| Open Banking API calls | >1 billion |
| Digital convenience priority | 72% |
| Churn after downtime | up to 30% |
| Fintech promo APRs | 0–3% |
Preview the Actual Deliverable
HPB Porter's Five Forces Analysis
This preview shows the exact HPB Porter's Five Forces analysis you'll receive immediately after purchase—fully formatted and ready for use. No mockups or placeholders: the file available for download after payment is the same document you see here. Instant access, professional quality, and no further setup required.











