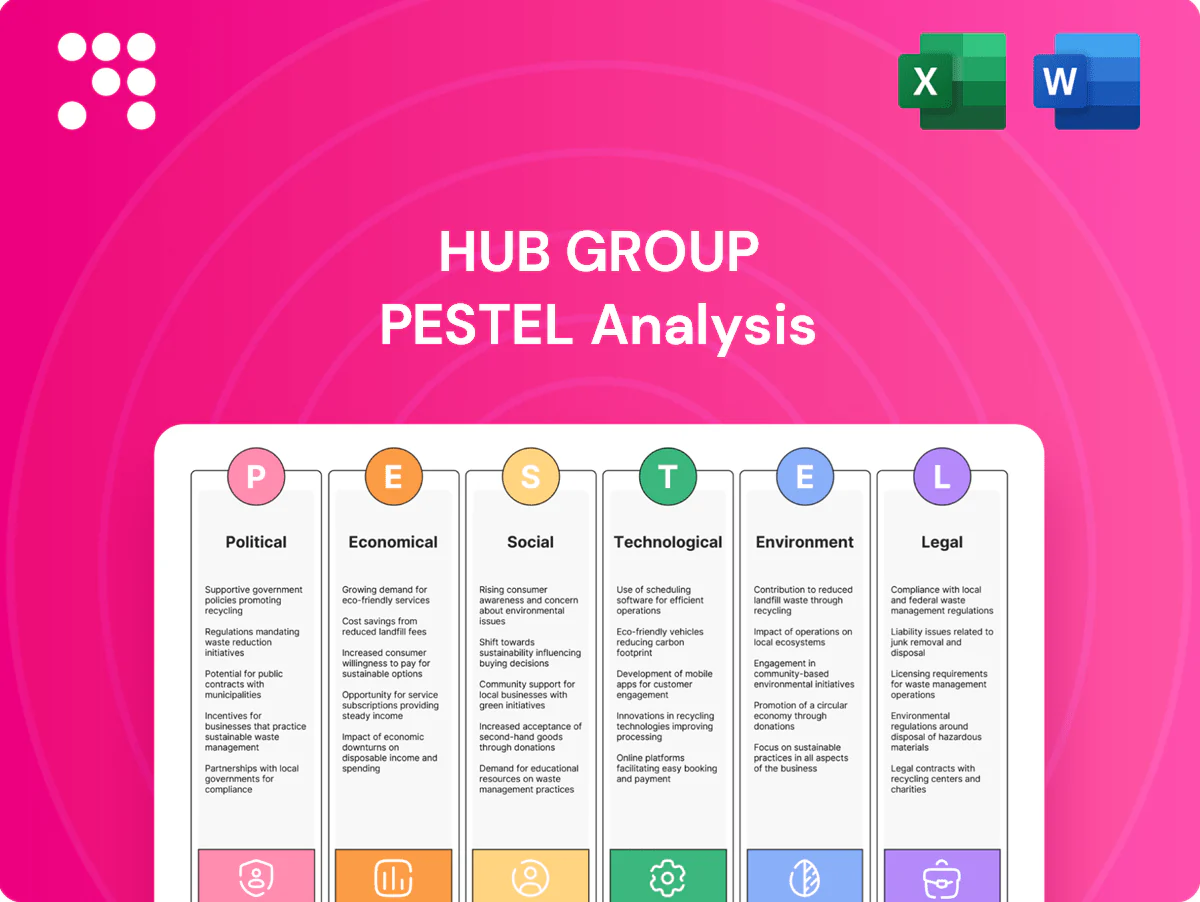
Hub Group PESTLE Analysis

Your Shortcut to Market Insight Starts Here
Gain a competitive edge with our PESTLE Analysis of Hub Group—three to five sentence summary won’t cut it: this report maps political, economic, social, technological, legal and environmental forces shaping the company’s future. Ideal for investors and strategists, it’s fully researched and ready to use. Purchase the full analysis now for actionable, boardroom-ready insights.
Political factors

Trade and tariffs
USMCA stability supports North American freight flows, underpinning $1.7T+ in goods trade in 2023. Tariff shifts or policy changes on China or Mexico can rapidly alter lane demand and import volumes, changing the rail versus intermodal mix. Hub Group must hedge exposure by diversifying customers and transportation modes and actively monitor markets to rebalance networks quickly.
Infrastructure funding
Federal and state capital allocations under the IIJA (roughly $1.2 trillion total with about $110 billion for roads/bridges and $66 billion for rail) reshape transit times and per-mile costs for carriers like Hub Group. Large-scale projects should reduce congestion and improve reliability over multi-year horizons, but active construction phases often create short-term bottlenecks and delays. Hub Group must dynamically adjust routing and scheduling, use real-time telematics and modal flexibility to contain cost and preserve on-time performance.

Transportation policy
FMCSA hours-of-service rules (11‑hour driving limit, 14‑hour duty window, 30‑minute break, 34‑hour restart) plus safety/CAB/CSA ratings and mandated equipment investments directly constrain carrier capacity and raise compliance costs. US truck freight historically accounts for roughly 70%+ of freight value, keeping mode competitiveness central. Surface Transportation Board and FRA rail oversight shape intermodal reliability and service levels. Continuous compliance programs and policy advocacy reduce regulatory and operational risk.

Cross-border logistics
Cross-border logistics face political swings: heightened border security drives longer dwell and inspections that reduce driver utilization, while customs modernization and pre-clearance can speed throughput; CBP reports CTPAT enrollment exceeds 11,000 partners (2024), underscoring trusted-trader value for resilience.
- Border inspections → higher dwell, lower utilization
- Customs modernization → faster throughput
- Robust brokerage/documentation required
- Pre-clearance/CTPAT (>11,000) increase resilience
Energy and climate policy
Energy and climate policy shapes Hub Group economics: federal diesel tax is 24.3 cents per gallon, while state low‑carbon rules—CARB Advanced Clean Fleets adopted in 2023—drive ZEV equipment and network redesign. Federal incentives from the Inflation Reduction Act are accelerating alternative‑fuel adoption across trucking. Proactive fleet strategy lowers regulatory exposure and total cost of ownership.
- Diesel tax: 24.3 cents/gal (federal)
- CARB: Advanced Clean Fleets adopted 2023
- IRA: federal incentives accelerating alt‑fuel uptake
- Proactive fleet strategy reduces policy risk and costs
USMCA $1.7T & IIJA $1.2T reshape lanes; HOS, diesel tax, ZEV incentives shift capacity
USMCA supports $1.7T+ trade (2023) but tariff shifts can reroute lanes and volumes. IIJA ~$1.2T (≈$110B roads, $66B rail) alters transit times; construction causes short-term delays. FMCSA HOS rules (11h/14h/30min/34h restart) plus CTPAT >11,000 (2024) affect capacity and dwell. Diesel tax 24.3¢/gal, CARB ACF (2023) and IRA incentives accelerate zero‑emission investments.
| Factor | Key metric |
|---|---|
| Trade | $1.7T+ (2023) |
| Infrastructure | $1.2T IIJA; $110B roads; $66B rail |
| Regulation/Energy | HOS 11/14/30/34; diesel 24.3¢; CTPAT 11k+ |
What is included in the product
 Detailed Word Document
Explores how Political, Economic, Social, Technological, Environmental, and Legal forces uniquely affect Hub Group’s intermodal and logistics operations, with data-driven subpoints and region-specific examples to highlight risks and opportunities for executives, investors, and strategists.

 Customizable Excel Spreadsheet
Condensed, visually segmented PESTLE summary for Hub Group that’s easy to drop into presentations or meeting packs, enabling quick alignment across teams and clearer discussion of external risks and market positioning.
Economic factors

Freight cycles
Freight cycles swing between soft and tight markets, directly compressing or expanding Hub Group's pricing power and operating margins during 2024–2025 market moves.
Retail inventories, U.S. industrial output and import volumes drove volume volatility in 2024, forcing variable demand across Hub's intermodal and brokerage lanes.
Hub Group (HUBG) must balance contract versus spot mix to stabilize revenue; a higher contract mix cushions downside while spot captures upside in tight markets.
Agile capacity management — reassigning assets and flexing carrier partnerships — preserves yield and mitigates margin leakage during cycle turns.
Fuel price volatility
Diesel price volatility (EIA peak ~$5.80/gal in Aug 2022; U.S. retail diesel averaged ~$3.90/gal in 2024) drives linehaul cost swings and creates periodic gaps in fuel surcharge recovery, often lagging 4–8 weeks. Effective FSC programs protect margins but timing mismatches persist. High fuel makes intermodal relatively more attractive, and hedging plus fuel-efficiency initiatives materially reduce carrier exposure.

Interest and capital
With the federal funds target at 5.25–5.50% in 2024–25, rate levels raise leasing and fleet financing costs, slowing equipment acquisition and customer volume growth. Higher financing costs compress returns on containers and chassis and can extend payback periods. In tight credit environments customers delay projects, making prudent capex and high asset turns essential for margin protection.

Nearshoring trends
Nearshoring to Mexico is reconfiguring lanes and cross-border flows; U.S.-Mexico goods trade exceeded $800 billion in 2023, driving higher truck and rail demand across border corridors. Intermodal and drayage volumes are poised to rise along I-35, Laredo and El Paso gateways. Hub Group can capture growth by expanding MX capacity, scaling brokerage services and forming strategic partnerships to enhance coverage.
- Impact: rerouted lanes, higher cross-border freight
- Opportunity: intermodal/drayage demand growth on key corridors
- Action: MX capacity + brokerage + partnerships = market share gains
Labor market dynamics
Labor availability for drivers and warehouse staff directly affects Hub Group service levels and costs; U.S. unemployment near 3.8% (mid‑2025) tightens the pool while driver shortages persist. Wage inflation—roughly 4%–6% annual pressure in transportation roles in 2024–2025—raises carrier costs, with brokers absorbing margin compression. Productivity tech (TMS, automation) offsets shortages by raising throughput per worker. Strong carrier relations secure dependable capacity during tight markets.
- Driver/warehouse availability: tight, unemployment ~3.8%
- Wage inflation: ~4%–6% in transport (2024–2025)
- Tech offset: TMS/automation raises productivity
- Carrier relations: key for dependable capacity
USMCA $1.7T & IIJA $1.2T reshape lanes; HOS, diesel tax, ZEV incentives shift capacity
Freight cycles drive pricing and margins; intermodal/brokerage volumes swung in 2024–25 with spot/contract mix key to revenue stability. Diesel averaged ~$3.90/gal in 2024, pressuring linehaul and FSC timing; Fed funds 5.25–5.50% raises financing costs. Nearshoring (US‑Mexico trade >$800B in 2023) and tight labor (unemployment ~3.8% mid‑2025; wage inflation 4–6%) reshape lanes and cost base.
| Metric | 2023–2025 | Impact |
|---|---|---|
| Freight cycle | High volatility | Price/margin swings |
| Diesel | ~$3.90/gal (2024) | Linehaul cost pressure |
| Fed funds | 5.25–5.50% | Higher financing |
| US‑MX trade | >$800B (2023) | Cross‑border demand↑ |
| Unemployment | ~3.8% (mid‑2025) | Tight labor |
| Wage inflation | 4–6% | Carrier cost pressure |
Full Version Awaits
Hub Group PESTLE Analysis
The preview shown here is the exact Hub Group PESTLE Analysis you’ll receive after purchase—fully formatted and ready to use. It contains the complete political, economic, social, technological, legal and environmental assessment tailored to Hub Group with actionable insights. No placeholders or teasers—this is the final, professionally structured file you’ll download immediately after payment.

Your Shortcut to Market Insight Starts Here
Gain a competitive edge with our PESTLE Analysis of Hub Group—three to five sentence summary won’t cut it: this report maps political, economic, social, technological, legal and environmental forces shaping the company’s future. Ideal for investors and strategists, it’s fully researched and ready to use. Purchase the full analysis now for actionable, boardroom-ready insights.
Political factors
Trade and tariffs
USMCA stability supports North American freight flows, underpinning $1.7T+ in goods trade in 2023. Tariff shifts or policy changes on China or Mexico can rapidly alter lane demand and import volumes, changing the rail versus intermodal mix. Hub Group must hedge exposure by diversifying customers and transportation modes and actively monitor markets to rebalance networks quickly.
Infrastructure funding
Federal and state capital allocations under the IIJA (roughly $1.2 trillion total with about $110 billion for roads/bridges and $66 billion for rail) reshape transit times and per-mile costs for carriers like Hub Group. Large-scale projects should reduce congestion and improve reliability over multi-year horizons, but active construction phases often create short-term bottlenecks and delays. Hub Group must dynamically adjust routing and scheduling, use real-time telematics and modal flexibility to contain cost and preserve on-time performance.
Transportation policy
FMCSA hours-of-service rules (11‑hour driving limit, 14‑hour duty window, 30‑minute break, 34‑hour restart) plus safety/CAB/CSA ratings and mandated equipment investments directly constrain carrier capacity and raise compliance costs. US truck freight historically accounts for roughly 70%+ of freight value, keeping mode competitiveness central. Surface Transportation Board and FRA rail oversight shape intermodal reliability and service levels. Continuous compliance programs and policy advocacy reduce regulatory and operational risk.
Cross-border logistics
Cross-border logistics face political swings: heightened border security drives longer dwell and inspections that reduce driver utilization, while customs modernization and pre-clearance can speed throughput; CBP reports CTPAT enrollment exceeds 11,000 partners (2024), underscoring trusted-trader value for resilience.
- Border inspections → higher dwell, lower utilization
- Customs modernization → faster throughput
- Robust brokerage/documentation required
- Pre-clearance/CTPAT (>11,000) increase resilience
Energy and climate policy
Energy and climate policy shapes Hub Group economics: federal diesel tax is 24.3 cents per gallon, while state low‑carbon rules—CARB Advanced Clean Fleets adopted in 2023—drive ZEV equipment and network redesign. Federal incentives from the Inflation Reduction Act are accelerating alternative‑fuel adoption across trucking. Proactive fleet strategy lowers regulatory exposure and total cost of ownership.
- Diesel tax: 24.3 cents/gal (federal)
- CARB: Advanced Clean Fleets adopted 2023
- IRA: federal incentives accelerating alt‑fuel uptake
- Proactive fleet strategy reduces policy risk and costs
USMCA $1.7T & IIJA $1.2T reshape lanes; HOS, diesel tax, ZEV incentives shift capacity
USMCA supports $1.7T+ trade (2023) but tariff shifts can reroute lanes and volumes. IIJA ~$1.2T (≈$110B roads, $66B rail) alters transit times; construction causes short-term delays. FMCSA HOS rules (11h/14h/30min/34h restart) plus CTPAT >11,000 (2024) affect capacity and dwell. Diesel tax 24.3¢/gal, CARB ACF (2023) and IRA incentives accelerate zero‑emission investments.
| Factor | Key metric |
|---|---|
| Trade | $1.7T+ (2023) |
| Infrastructure | $1.2T IIJA; $110B roads; $66B rail |
| Regulation/Energy | HOS 11/14/30/34; diesel 24.3¢; CTPAT 11k+ |
What is included in the product
Detailed Word Document
Explores how Political, Economic, Social, Technological, Environmental, and Legal forces uniquely affect Hub Group’s intermodal and logistics operations, with data-driven subpoints and region-specific examples to highlight risks and opportunities for executives, investors, and strategists.
Customizable Excel Spreadsheet
Condensed, visually segmented PESTLE summary for Hub Group that’s easy to drop into presentations or meeting packs, enabling quick alignment across teams and clearer discussion of external risks and market positioning.
Economic factors
Freight cycles
Freight cycles swing between soft and tight markets, directly compressing or expanding Hub Group's pricing power and operating margins during 2024–2025 market moves.
Retail inventories, U.S. industrial output and import volumes drove volume volatility in 2024, forcing variable demand across Hub's intermodal and brokerage lanes.
Hub Group (HUBG) must balance contract versus spot mix to stabilize revenue; a higher contract mix cushions downside while spot captures upside in tight markets.
Agile capacity management — reassigning assets and flexing carrier partnerships — preserves yield and mitigates margin leakage during cycle turns.
Fuel price volatility
Diesel price volatility (EIA peak ~$5.80/gal in Aug 2022; U.S. retail diesel averaged ~$3.90/gal in 2024) drives linehaul cost swings and creates periodic gaps in fuel surcharge recovery, often lagging 4–8 weeks. Effective FSC programs protect margins but timing mismatches persist. High fuel makes intermodal relatively more attractive, and hedging plus fuel-efficiency initiatives materially reduce carrier exposure.
Interest and capital
With the federal funds target at 5.25–5.50% in 2024–25, rate levels raise leasing and fleet financing costs, slowing equipment acquisition and customer volume growth. Higher financing costs compress returns on containers and chassis and can extend payback periods. In tight credit environments customers delay projects, making prudent capex and high asset turns essential for margin protection.
Nearshoring trends
Nearshoring to Mexico is reconfiguring lanes and cross-border flows; U.S.-Mexico goods trade exceeded $800 billion in 2023, driving higher truck and rail demand across border corridors. Intermodal and drayage volumes are poised to rise along I-35, Laredo and El Paso gateways. Hub Group can capture growth by expanding MX capacity, scaling brokerage services and forming strategic partnerships to enhance coverage.
- Impact: rerouted lanes, higher cross-border freight
- Opportunity: intermodal/drayage demand growth on key corridors
- Action: MX capacity + brokerage + partnerships = market share gains
Labor market dynamics
Labor availability for drivers and warehouse staff directly affects Hub Group service levels and costs; U.S. unemployment near 3.8% (mid‑2025) tightens the pool while driver shortages persist. Wage inflation—roughly 4%–6% annual pressure in transportation roles in 2024–2025—raises carrier costs, with brokers absorbing margin compression. Productivity tech (TMS, automation) offsets shortages by raising throughput per worker. Strong carrier relations secure dependable capacity during tight markets.
- Driver/warehouse availability: tight, unemployment ~3.8%
- Wage inflation: ~4%–6% in transport (2024–2025)
- Tech offset: TMS/automation raises productivity
- Carrier relations: key for dependable capacity
USMCA $1.7T & IIJA $1.2T reshape lanes; HOS, diesel tax, ZEV incentives shift capacity
Freight cycles drive pricing and margins; intermodal/brokerage volumes swung in 2024–25 with spot/contract mix key to revenue stability. Diesel averaged ~$3.90/gal in 2024, pressuring linehaul and FSC timing; Fed funds 5.25–5.50% raises financing costs. Nearshoring (US‑Mexico trade >$800B in 2023) and tight labor (unemployment ~3.8% mid‑2025; wage inflation 4–6%) reshape lanes and cost base.
| Metric | 2023–2025 | Impact |
|---|---|---|
| Freight cycle | High volatility | Price/margin swings |
| Diesel | ~$3.90/gal (2024) | Linehaul cost pressure |
| Fed funds | 5.25–5.50% | Higher financing |
| US‑MX trade | >$800B (2023) | Cross‑border demand↑ |
| Unemployment | ~3.8% (mid‑2025) | Tight labor |
| Wage inflation | 4–6% | Carrier cost pressure |
Full Version Awaits
Hub Group PESTLE Analysis
The preview shown here is the exact Hub Group PESTLE Analysis you’ll receive after purchase—fully formatted and ready to use. It contains the complete political, economic, social, technological, legal and environmental assessment tailored to Hub Group with actionable insights. No placeholders or teasers—this is the final, professionally structured file you’ll download immediately after payment.
Original: $10.00
-65%$10.00
$3.50Description
Your Shortcut to Market Insight Starts Here
Gain a competitive edge with our PESTLE Analysis of Hub Group—three to five sentence summary won’t cut it: this report maps political, economic, social, technological, legal and environmental forces shaping the company’s future. Ideal for investors and strategists, it’s fully researched and ready to use. Purchase the full analysis now for actionable, boardroom-ready insights.
Political factors
Trade and tariffs
USMCA stability supports North American freight flows, underpinning $1.7T+ in goods trade in 2023. Tariff shifts or policy changes on China or Mexico can rapidly alter lane demand and import volumes, changing the rail versus intermodal mix. Hub Group must hedge exposure by diversifying customers and transportation modes and actively monitor markets to rebalance networks quickly.
Infrastructure funding
Federal and state capital allocations under the IIJA (roughly $1.2 trillion total with about $110 billion for roads/bridges and $66 billion for rail) reshape transit times and per-mile costs for carriers like Hub Group. Large-scale projects should reduce congestion and improve reliability over multi-year horizons, but active construction phases often create short-term bottlenecks and delays. Hub Group must dynamically adjust routing and scheduling, use real-time telematics and modal flexibility to contain cost and preserve on-time performance.
Transportation policy
FMCSA hours-of-service rules (11‑hour driving limit, 14‑hour duty window, 30‑minute break, 34‑hour restart) plus safety/CAB/CSA ratings and mandated equipment investments directly constrain carrier capacity and raise compliance costs. US truck freight historically accounts for roughly 70%+ of freight value, keeping mode competitiveness central. Surface Transportation Board and FRA rail oversight shape intermodal reliability and service levels. Continuous compliance programs and policy advocacy reduce regulatory and operational risk.
Cross-border logistics
Cross-border logistics face political swings: heightened border security drives longer dwell and inspections that reduce driver utilization, while customs modernization and pre-clearance can speed throughput; CBP reports CTPAT enrollment exceeds 11,000 partners (2024), underscoring trusted-trader value for resilience.
- Border inspections → higher dwell, lower utilization
- Customs modernization → faster throughput
- Robust brokerage/documentation required
- Pre-clearance/CTPAT (>11,000) increase resilience
Energy and climate policy
Energy and climate policy shapes Hub Group economics: federal diesel tax is 24.3 cents per gallon, while state low‑carbon rules—CARB Advanced Clean Fleets adopted in 2023—drive ZEV equipment and network redesign. Federal incentives from the Inflation Reduction Act are accelerating alternative‑fuel adoption across trucking. Proactive fleet strategy lowers regulatory exposure and total cost of ownership.
- Diesel tax: 24.3 cents/gal (federal)
- CARB: Advanced Clean Fleets adopted 2023
- IRA: federal incentives accelerating alt‑fuel uptake
- Proactive fleet strategy reduces policy risk and costs
USMCA $1.7T & IIJA $1.2T reshape lanes; HOS, diesel tax, ZEV incentives shift capacity
USMCA supports $1.7T+ trade (2023) but tariff shifts can reroute lanes and volumes. IIJA ~$1.2T (≈$110B roads, $66B rail) alters transit times; construction causes short-term delays. FMCSA HOS rules (11h/14h/30min/34h restart) plus CTPAT >11,000 (2024) affect capacity and dwell. Diesel tax 24.3¢/gal, CARB ACF (2023) and IRA incentives accelerate zero‑emission investments.
| Factor | Key metric |
|---|---|
| Trade | $1.7T+ (2023) |
| Infrastructure | $1.2T IIJA; $110B roads; $66B rail |
| Regulation/Energy | HOS 11/14/30/34; diesel 24.3¢; CTPAT 11k+ |
What is included in the product
Detailed Word Document
Explores how Political, Economic, Social, Technological, Environmental, and Legal forces uniquely affect Hub Group’s intermodal and logistics operations, with data-driven subpoints and region-specific examples to highlight risks and opportunities for executives, investors, and strategists.
Customizable Excel Spreadsheet
Condensed, visually segmented PESTLE summary for Hub Group that’s easy to drop into presentations or meeting packs, enabling quick alignment across teams and clearer discussion of external risks and market positioning.
Economic factors
Freight cycles
Freight cycles swing between soft and tight markets, directly compressing or expanding Hub Group's pricing power and operating margins during 2024–2025 market moves.
Retail inventories, U.S. industrial output and import volumes drove volume volatility in 2024, forcing variable demand across Hub's intermodal and brokerage lanes.
Hub Group (HUBG) must balance contract versus spot mix to stabilize revenue; a higher contract mix cushions downside while spot captures upside in tight markets.
Agile capacity management — reassigning assets and flexing carrier partnerships — preserves yield and mitigates margin leakage during cycle turns.
Fuel price volatility
Diesel price volatility (EIA peak ~$5.80/gal in Aug 2022; U.S. retail diesel averaged ~$3.90/gal in 2024) drives linehaul cost swings and creates periodic gaps in fuel surcharge recovery, often lagging 4–8 weeks. Effective FSC programs protect margins but timing mismatches persist. High fuel makes intermodal relatively more attractive, and hedging plus fuel-efficiency initiatives materially reduce carrier exposure.
Interest and capital
With the federal funds target at 5.25–5.50% in 2024–25, rate levels raise leasing and fleet financing costs, slowing equipment acquisition and customer volume growth. Higher financing costs compress returns on containers and chassis and can extend payback periods. In tight credit environments customers delay projects, making prudent capex and high asset turns essential for margin protection.
Nearshoring trends
Nearshoring to Mexico is reconfiguring lanes and cross-border flows; U.S.-Mexico goods trade exceeded $800 billion in 2023, driving higher truck and rail demand across border corridors. Intermodal and drayage volumes are poised to rise along I-35, Laredo and El Paso gateways. Hub Group can capture growth by expanding MX capacity, scaling brokerage services and forming strategic partnerships to enhance coverage.
- Impact: rerouted lanes, higher cross-border freight
- Opportunity: intermodal/drayage demand growth on key corridors
- Action: MX capacity + brokerage + partnerships = market share gains
Labor market dynamics
Labor availability for drivers and warehouse staff directly affects Hub Group service levels and costs; U.S. unemployment near 3.8% (mid‑2025) tightens the pool while driver shortages persist. Wage inflation—roughly 4%–6% annual pressure in transportation roles in 2024–2025—raises carrier costs, with brokers absorbing margin compression. Productivity tech (TMS, automation) offsets shortages by raising throughput per worker. Strong carrier relations secure dependable capacity during tight markets.
- Driver/warehouse availability: tight, unemployment ~3.8%
- Wage inflation: ~4%–6% in transport (2024–2025)
- Tech offset: TMS/automation raises productivity
- Carrier relations: key for dependable capacity
USMCA $1.7T & IIJA $1.2T reshape lanes; HOS, diesel tax, ZEV incentives shift capacity
Freight cycles drive pricing and margins; intermodal/brokerage volumes swung in 2024–25 with spot/contract mix key to revenue stability. Diesel averaged ~$3.90/gal in 2024, pressuring linehaul and FSC timing; Fed funds 5.25–5.50% raises financing costs. Nearshoring (US‑Mexico trade >$800B in 2023) and tight labor (unemployment ~3.8% mid‑2025; wage inflation 4–6%) reshape lanes and cost base.
| Metric | 2023–2025 | Impact |
|---|---|---|
| Freight cycle | High volatility | Price/margin swings |
| Diesel | ~$3.90/gal (2024) | Linehaul cost pressure |
| Fed funds | 5.25–5.50% | Higher financing |
| US‑MX trade | >$800B (2023) | Cross‑border demand↑ |
| Unemployment | ~3.8% (mid‑2025) | Tight labor |
| Wage inflation | 4–6% | Carrier cost pressure |
Full Version Awaits
Hub Group PESTLE Analysis
The preview shown here is the exact Hub Group PESTLE Analysis you’ll receive after purchase—fully formatted and ready to use. It contains the complete political, economic, social, technological, legal and environmental assessment tailored to Hub Group with actionable insights. No placeholders or teasers—this is the final, professionally structured file you’ll download immediately after payment.











