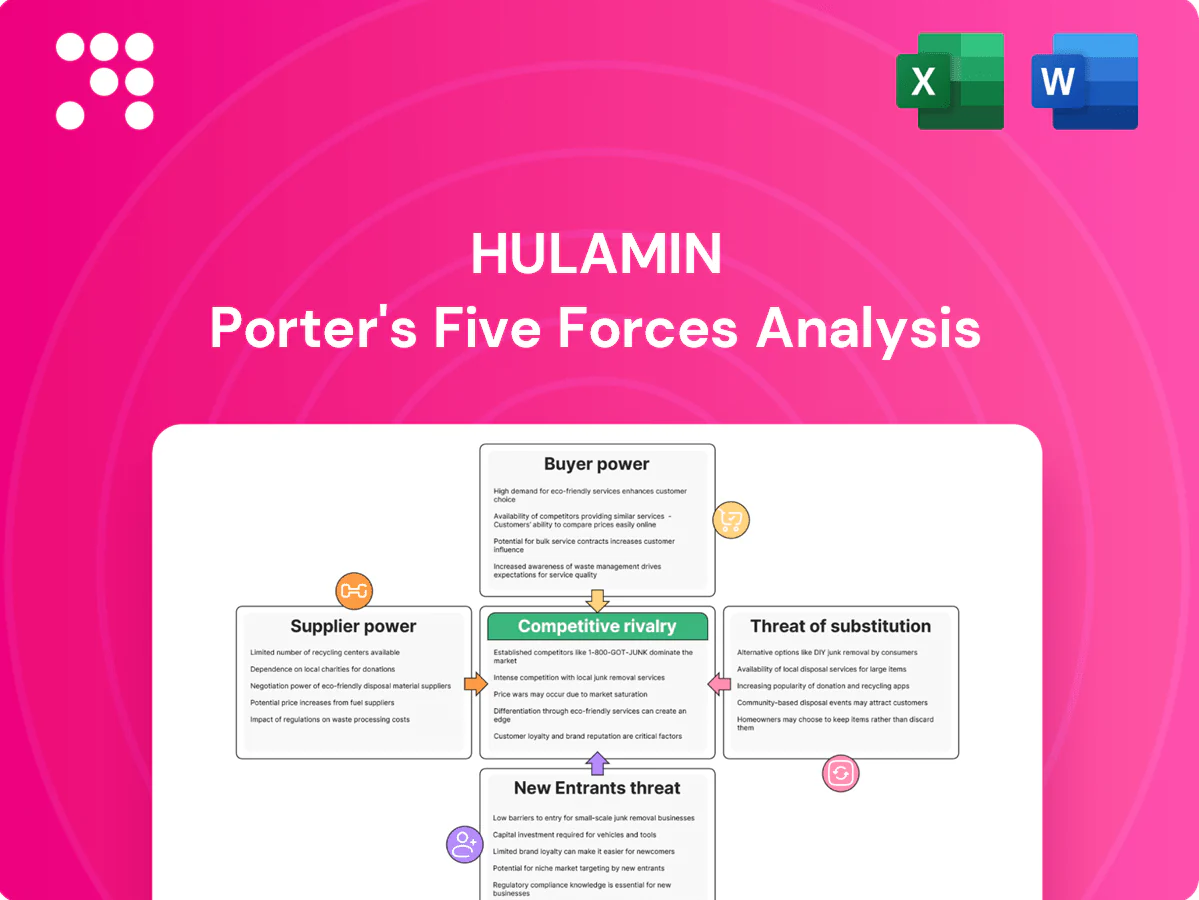
Hulamin Porter's Five Forces Analysis

A Must-Have Tool for Decision-Makers
Hulamin’s Porter's Five Forces snapshot highlights concentrated buyer power, supplier bargaining in aluminium inputs, moderate substitute threats, and barriers that temper new entrants. Strategic positioning and cost pressures are key themes. This brief teases force-by-force ratings and implications. Unlock the full Porter's Five Forces Analysis to access detailed ratings, visuals, and actionable strategy.
Suppliers Bargaining Power

Concentrated primary aluminum sources
Primary aluminum supply is highly concentrated, with China supplying about 60% of global primary production in 2024 and LME benchmarks anchoring trade and premiums. This concentration gives smelters and traders leverage over premiums, payment terms and allocations during tight markets, and curtailments or export controls can rapidly tighten availability. Hulamin’s dual feedstock model (primary plus scrap) provides a meaningful partial hedge but does not fully insulate the company from primary supply shocks.
Energy and Eskom dependency
Electricity is a critical input for Hulamin’s rolling and annealing, with recent double-digit Eskom tariff hikes and over 1,000 hours of load shedding in 2024 materially shaping its cost base and uptime. Price hikes and curtailments raise supplier bargaining power through pass-through costs and downtime risk. Limited alternative baseload options constrain negotiation leverage; onsite efficiency and PPAs mitigate but do not eliminate exposure.

Scrap metal availability and quality
Recycled aluminum supply hinges on regional collection rates, alloy segregation, and global scrap flows; secondary production was about 23 million tonnes in 2023, roughly one-third of total supply. Scrap merchants gain leverage when demand for high‑grade segregated scrap rises. Quality variability increases melt loss and rework costs, strengthening supplier influence. Long‑term contracts and in‑house sorting reduce volatility.

Alloying elements and specialty inputs
Logistics and port constraints
Port congestion, freight-rate swings and container shortages act as quasi-suppliers of capacity, increasing shipping lines and logistics providers bargaining power during disruptions; global spot rates eased to about 1,200 USD/FEU on the SCFI in 2024 but spikes remain localised. Higher inland transport costs in South Africa — logistics costs near 11% of GDP in 2024 — amplify supplier leverage, though forward-booked capacity and multimodal options partially mitigate exposure.
- Port congestion: local queues raise lead times
- Freight rates: SCFI ~1,200 USD/FEU (2024)
- Container availability: intermittent shortages
- Inland costs: logistics ~11% of GDP (2024)
- Mitigation: forward-booking, multimodal routing
China 60% primary, >1,000 hrs outages and SCFI ~1,200 USD/FEU amplify supplier leverage
Primary aluminum concentration (China ~60% of primary production, 2024) gives upstream suppliers allocation and premium leverage; Hulamin offsets partly with scrap. Electricity (Eskom: double‑digit tariff hikes; >1,000 hrs load shedding, 2024) and logistics (SCFI ~1,200 USD/FEU; logistics ~11% of GDP, 2024) amplify supplier power.
| Risk | 2024 metric | Impact |
|---|---|---|
| Primary supply | China ~60% | Price/allocations |
| Electricity | >1,000 hrs load shedding | Costs/uptime |
| Logistics | SCFI ~1,200 USD/FEU | Lead times/costs |
What is included in the product
 Detailed Word Document
Tailored Porter's Five Forces for Hulamin that uncovers competitive drivers, supplier and buyer power, threats from substitutes and new entrants, intensity of rivalry, and disruptive risks—delivered with strategic insights ready for integration into reports or presentations.

 Customizable Excel Spreadsheet
Hulamin Porter's Five Forces template distills competitive risks into a one-sheet view—quickly revealing supplier, buyer, and substitute pressures to guide strategic actions.
Customers Bargaining Power

Large OEMs and canmakers
Automotive OEMs and beverage-can producers buy at scale and enforce tight specs, with global light-vehicle production ~78 million units in 2024 and the aluminum can market exceeding 400 billion cans annually, boosting buyers’ leverage. Consolidation among OEMs and leading canmakers (Ball, Crown, Ardagh) concentrates purchasing power and forces aggressive cost-downs tied to volume commitments. Vendor qualification creates stickiness but buyers commonly dual-source globally, pressuring margins and service levels.
Commodity-linked pricing
Contracts typically reference LME (average ~USD 2,400/t in 2024) plus regional conversion premiums, letting buyers push to cap conversion margins and transfer LME price risk back to producers. Transparent LME benchmarks strengthen buyer leverage in negotiations. Hulamin relies on value-added aluminium grades to defend margins, where premiums can be materially higher than standard coil prices.

Import alternatives and global supply
Customers can switch to international mills for standard gauges and alloys, and 2024's average USD/ZAR ~18.5 tightened import parity, capping Hulamin's local pricing when freight and duties were favorable. Currency swings in 2024 caused rapid shifts in import attractiveness, sometimes altering landed costs by double-digit percentages month-to-month. Superior service, shorter lead times, and technical support remain key levers to retain contracts despite import options.

Specification and quality demands
Automotive and foil customers demand tolerances often as tight as ±0.02 mm and OEM-grade surface quality; strict PPAP-like approvals and non-conformance penalties (commonly up to 2–5% of order value) increase switching costs while giving buyers leverage to extract price or lead-time concessions; continuous improvement mandates squeeze margins; technical collaboration can embed Hulamin into platforms, supporting recurring revenue.
- Tolerances ±0.02 mm
- Penalties 2–5% of order value
- PPAP-like approvals raise switching costs
- Continuous improvement trims margins
- Technical collaboration = platform embedding
Sustainability and recycled content
- Verified low‑carbon product premiums — reduces buyer power
- Recycled content lowers emissions (~0.5–1 vs 12 tCO2/t)
- ESG mandates drive supplier selection
- Compliance expands markets but increases input costs
OEMs and canmakers squeeze margins as LME at USD 2,400/t
Large OEMs and canmakers (78m vehicles; 400bn cans in 2024) concentrate buying power, enforcing specs, dual-sourcing and price caps linked to LME (~USD 2,400/t in 2024) plus low-carbon premiums. Strict tolerances (±0.02 mm) and penalties (2–5%) raise switching costs but transparent LME and import parity (USD/ZAR ~18.5) constrain margins.
| Metric | 2024 Value |
|---|---|
| LME benchmark | ~USD 2,400/t |
| Light vehicles | ~78m units |
| Aluminum cans | ~400bn |
| USD/ZAR | ~18.5 |
| Emissions (smelt vs recycled) | ~12 vs 0.5–1 tCO2/t |
| Tolerances / penalties | ±0.02 mm / 2–5% |
Full Version Awaits
Hulamin Porter's Five Forces Analysis
This preview shows the exact Hulamin Porter's Five Forces Analysis you'll receive—no surprises or placeholders. It covers competitive rivalry, supplier and buyer power, threat of substitutes and new entrants, with concise implications for Hulamin's strategic positioning. The document is fully formatted and ready for immediate download upon purchase.

A Must-Have Tool for Decision-Makers
Hulamin’s Porter's Five Forces snapshot highlights concentrated buyer power, supplier bargaining in aluminium inputs, moderate substitute threats, and barriers that temper new entrants. Strategic positioning and cost pressures are key themes. This brief teases force-by-force ratings and implications. Unlock the full Porter's Five Forces Analysis to access detailed ratings, visuals, and actionable strategy.
Suppliers Bargaining Power
Concentrated primary aluminum sources
Primary aluminum supply is highly concentrated, with China supplying about 60% of global primary production in 2024 and LME benchmarks anchoring trade and premiums. This concentration gives smelters and traders leverage over premiums, payment terms and allocations during tight markets, and curtailments or export controls can rapidly tighten availability. Hulamin’s dual feedstock model (primary plus scrap) provides a meaningful partial hedge but does not fully insulate the company from primary supply shocks.
Energy and Eskom dependency
Electricity is a critical input for Hulamin’s rolling and annealing, with recent double-digit Eskom tariff hikes and over 1,000 hours of load shedding in 2024 materially shaping its cost base and uptime. Price hikes and curtailments raise supplier bargaining power through pass-through costs and downtime risk. Limited alternative baseload options constrain negotiation leverage; onsite efficiency and PPAs mitigate but do not eliminate exposure.
Scrap metal availability and quality
Recycled aluminum supply hinges on regional collection rates, alloy segregation, and global scrap flows; secondary production was about 23 million tonnes in 2023, roughly one-third of total supply. Scrap merchants gain leverage when demand for high‑grade segregated scrap rises. Quality variability increases melt loss and rework costs, strengthening supplier influence. Long‑term contracts and in‑house sorting reduce volatility.
Alloying elements and specialty inputs
Logistics and port constraints
Port congestion, freight-rate swings and container shortages act as quasi-suppliers of capacity, increasing shipping lines and logistics providers bargaining power during disruptions; global spot rates eased to about 1,200 USD/FEU on the SCFI in 2024 but spikes remain localised. Higher inland transport costs in South Africa — logistics costs near 11% of GDP in 2024 — amplify supplier leverage, though forward-booked capacity and multimodal options partially mitigate exposure.
- Port congestion: local queues raise lead times
- Freight rates: SCFI ~1,200 USD/FEU (2024)
- Container availability: intermittent shortages
- Inland costs: logistics ~11% of GDP (2024)
- Mitigation: forward-booking, multimodal routing
China 60% primary, >1,000 hrs outages and SCFI ~1,200 USD/FEU amplify supplier leverage
Primary aluminum concentration (China ~60% of primary production, 2024) gives upstream suppliers allocation and premium leverage; Hulamin offsets partly with scrap. Electricity (Eskom: double‑digit tariff hikes; >1,000 hrs load shedding, 2024) and logistics (SCFI ~1,200 USD/FEU; logistics ~11% of GDP, 2024) amplify supplier power.
| Risk | 2024 metric | Impact |
|---|---|---|
| Primary supply | China ~60% | Price/allocations |
| Electricity | >1,000 hrs load shedding | Costs/uptime |
| Logistics | SCFI ~1,200 USD/FEU | Lead times/costs |
What is included in the product
Detailed Word Document
Tailored Porter's Five Forces for Hulamin that uncovers competitive drivers, supplier and buyer power, threats from substitutes and new entrants, intensity of rivalry, and disruptive risks—delivered with strategic insights ready for integration into reports or presentations.
Customizable Excel Spreadsheet
Hulamin Porter's Five Forces template distills competitive risks into a one-sheet view—quickly revealing supplier, buyer, and substitute pressures to guide strategic actions.
Customers Bargaining Power
Large OEMs and canmakers
Automotive OEMs and beverage-can producers buy at scale and enforce tight specs, with global light-vehicle production ~78 million units in 2024 and the aluminum can market exceeding 400 billion cans annually, boosting buyers’ leverage. Consolidation among OEMs and leading canmakers (Ball, Crown, Ardagh) concentrates purchasing power and forces aggressive cost-downs tied to volume commitments. Vendor qualification creates stickiness but buyers commonly dual-source globally, pressuring margins and service levels.
Commodity-linked pricing
Contracts typically reference LME (average ~USD 2,400/t in 2024) plus regional conversion premiums, letting buyers push to cap conversion margins and transfer LME price risk back to producers. Transparent LME benchmarks strengthen buyer leverage in negotiations. Hulamin relies on value-added aluminium grades to defend margins, where premiums can be materially higher than standard coil prices.
Import alternatives and global supply
Customers can switch to international mills for standard gauges and alloys, and 2024's average USD/ZAR ~18.5 tightened import parity, capping Hulamin's local pricing when freight and duties were favorable. Currency swings in 2024 caused rapid shifts in import attractiveness, sometimes altering landed costs by double-digit percentages month-to-month. Superior service, shorter lead times, and technical support remain key levers to retain contracts despite import options.
Specification and quality demands
Automotive and foil customers demand tolerances often as tight as ±0.02 mm and OEM-grade surface quality; strict PPAP-like approvals and non-conformance penalties (commonly up to 2–5% of order value) increase switching costs while giving buyers leverage to extract price or lead-time concessions; continuous improvement mandates squeeze margins; technical collaboration can embed Hulamin into platforms, supporting recurring revenue.
- Tolerances ±0.02 mm
- Penalties 2–5% of order value
- PPAP-like approvals raise switching costs
- Continuous improvement trims margins
- Technical collaboration = platform embedding
Sustainability and recycled content
- Verified low‑carbon product premiums — reduces buyer power
- Recycled content lowers emissions (~0.5–1 vs 12 tCO2/t)
- ESG mandates drive supplier selection
- Compliance expands markets but increases input costs
OEMs and canmakers squeeze margins as LME at USD 2,400/t
Large OEMs and canmakers (78m vehicles; 400bn cans in 2024) concentrate buying power, enforcing specs, dual-sourcing and price caps linked to LME (~USD 2,400/t in 2024) plus low-carbon premiums. Strict tolerances (±0.02 mm) and penalties (2–5%) raise switching costs but transparent LME and import parity (USD/ZAR ~18.5) constrain margins.
| Metric | 2024 Value |
|---|---|
| LME benchmark | ~USD 2,400/t |
| Light vehicles | ~78m units |
| Aluminum cans | ~400bn |
| USD/ZAR | ~18.5 |
| Emissions (smelt vs recycled) | ~12 vs 0.5–1 tCO2/t |
| Tolerances / penalties | ±0.02 mm / 2–5% |
Full Version Awaits
Hulamin Porter's Five Forces Analysis
This preview shows the exact Hulamin Porter's Five Forces Analysis you'll receive—no surprises or placeholders. It covers competitive rivalry, supplier and buyer power, threat of substitutes and new entrants, with concise implications for Hulamin's strategic positioning. The document is fully formatted and ready for immediate download upon purchase.
Description
A Must-Have Tool for Decision-Makers
Hulamin’s Porter's Five Forces snapshot highlights concentrated buyer power, supplier bargaining in aluminium inputs, moderate substitute threats, and barriers that temper new entrants. Strategic positioning and cost pressures are key themes. This brief teases force-by-force ratings and implications. Unlock the full Porter's Five Forces Analysis to access detailed ratings, visuals, and actionable strategy.
Suppliers Bargaining Power
Concentrated primary aluminum sources
Primary aluminum supply is highly concentrated, with China supplying about 60% of global primary production in 2024 and LME benchmarks anchoring trade and premiums. This concentration gives smelters and traders leverage over premiums, payment terms and allocations during tight markets, and curtailments or export controls can rapidly tighten availability. Hulamin’s dual feedstock model (primary plus scrap) provides a meaningful partial hedge but does not fully insulate the company from primary supply shocks.
Energy and Eskom dependency
Electricity is a critical input for Hulamin’s rolling and annealing, with recent double-digit Eskom tariff hikes and over 1,000 hours of load shedding in 2024 materially shaping its cost base and uptime. Price hikes and curtailments raise supplier bargaining power through pass-through costs and downtime risk. Limited alternative baseload options constrain negotiation leverage; onsite efficiency and PPAs mitigate but do not eliminate exposure.
Scrap metal availability and quality
Recycled aluminum supply hinges on regional collection rates, alloy segregation, and global scrap flows; secondary production was about 23 million tonnes in 2023, roughly one-third of total supply. Scrap merchants gain leverage when demand for high‑grade segregated scrap rises. Quality variability increases melt loss and rework costs, strengthening supplier influence. Long‑term contracts and in‑house sorting reduce volatility.
Alloying elements and specialty inputs
Logistics and port constraints
Port congestion, freight-rate swings and container shortages act as quasi-suppliers of capacity, increasing shipping lines and logistics providers bargaining power during disruptions; global spot rates eased to about 1,200 USD/FEU on the SCFI in 2024 but spikes remain localised. Higher inland transport costs in South Africa — logistics costs near 11% of GDP in 2024 — amplify supplier leverage, though forward-booked capacity and multimodal options partially mitigate exposure.
- Port congestion: local queues raise lead times
- Freight rates: SCFI ~1,200 USD/FEU (2024)
- Container availability: intermittent shortages
- Inland costs: logistics ~11% of GDP (2024)
- Mitigation: forward-booking, multimodal routing
China 60% primary, >1,000 hrs outages and SCFI ~1,200 USD/FEU amplify supplier leverage
Primary aluminum concentration (China ~60% of primary production, 2024) gives upstream suppliers allocation and premium leverage; Hulamin offsets partly with scrap. Electricity (Eskom: double‑digit tariff hikes; >1,000 hrs load shedding, 2024) and logistics (SCFI ~1,200 USD/FEU; logistics ~11% of GDP, 2024) amplify supplier power.
| Risk | 2024 metric | Impact |
|---|---|---|
| Primary supply | China ~60% | Price/allocations |
| Electricity | >1,000 hrs load shedding | Costs/uptime |
| Logistics | SCFI ~1,200 USD/FEU | Lead times/costs |
What is included in the product
Detailed Word Document
Tailored Porter's Five Forces for Hulamin that uncovers competitive drivers, supplier and buyer power, threats from substitutes and new entrants, intensity of rivalry, and disruptive risks—delivered with strategic insights ready for integration into reports or presentations.
Customizable Excel Spreadsheet
Hulamin Porter's Five Forces template distills competitive risks into a one-sheet view—quickly revealing supplier, buyer, and substitute pressures to guide strategic actions.
Customers Bargaining Power
Large OEMs and canmakers
Automotive OEMs and beverage-can producers buy at scale and enforce tight specs, with global light-vehicle production ~78 million units in 2024 and the aluminum can market exceeding 400 billion cans annually, boosting buyers’ leverage. Consolidation among OEMs and leading canmakers (Ball, Crown, Ardagh) concentrates purchasing power and forces aggressive cost-downs tied to volume commitments. Vendor qualification creates stickiness but buyers commonly dual-source globally, pressuring margins and service levels.
Commodity-linked pricing
Contracts typically reference LME (average ~USD 2,400/t in 2024) plus regional conversion premiums, letting buyers push to cap conversion margins and transfer LME price risk back to producers. Transparent LME benchmarks strengthen buyer leverage in negotiations. Hulamin relies on value-added aluminium grades to defend margins, where premiums can be materially higher than standard coil prices.
Import alternatives and global supply
Customers can switch to international mills for standard gauges and alloys, and 2024's average USD/ZAR ~18.5 tightened import parity, capping Hulamin's local pricing when freight and duties were favorable. Currency swings in 2024 caused rapid shifts in import attractiveness, sometimes altering landed costs by double-digit percentages month-to-month. Superior service, shorter lead times, and technical support remain key levers to retain contracts despite import options.
Specification and quality demands
Automotive and foil customers demand tolerances often as tight as ±0.02 mm and OEM-grade surface quality; strict PPAP-like approvals and non-conformance penalties (commonly up to 2–5% of order value) increase switching costs while giving buyers leverage to extract price or lead-time concessions; continuous improvement mandates squeeze margins; technical collaboration can embed Hulamin into platforms, supporting recurring revenue.
- Tolerances ±0.02 mm
- Penalties 2–5% of order value
- PPAP-like approvals raise switching costs
- Continuous improvement trims margins
- Technical collaboration = platform embedding
Sustainability and recycled content
- Verified low‑carbon product premiums — reduces buyer power
- Recycled content lowers emissions (~0.5–1 vs 12 tCO2/t)
- ESG mandates drive supplier selection
- Compliance expands markets but increases input costs
OEMs and canmakers squeeze margins as LME at USD 2,400/t
Large OEMs and canmakers (78m vehicles; 400bn cans in 2024) concentrate buying power, enforcing specs, dual-sourcing and price caps linked to LME (~USD 2,400/t in 2024) plus low-carbon premiums. Strict tolerances (±0.02 mm) and penalties (2–5%) raise switching costs but transparent LME and import parity (USD/ZAR ~18.5) constrain margins.
| Metric | 2024 Value |
|---|---|
| LME benchmark | ~USD 2,400/t |
| Light vehicles | ~78m units |
| Aluminum cans | ~400bn |
| USD/ZAR | ~18.5 |
| Emissions (smelt vs recycled) | ~12 vs 0.5–1 tCO2/t |
| Tolerances / penalties | ±0.02 mm / 2–5% |
Full Version Awaits
Hulamin Porter's Five Forces Analysis
This preview shows the exact Hulamin Porter's Five Forces Analysis you'll receive—no surprises or placeholders. It covers competitive rivalry, supplier and buyer power, threat of substitutes and new entrants, with concise implications for Hulamin's strategic positioning. The document is fully formatted and ready for immediate download upon purchase.











