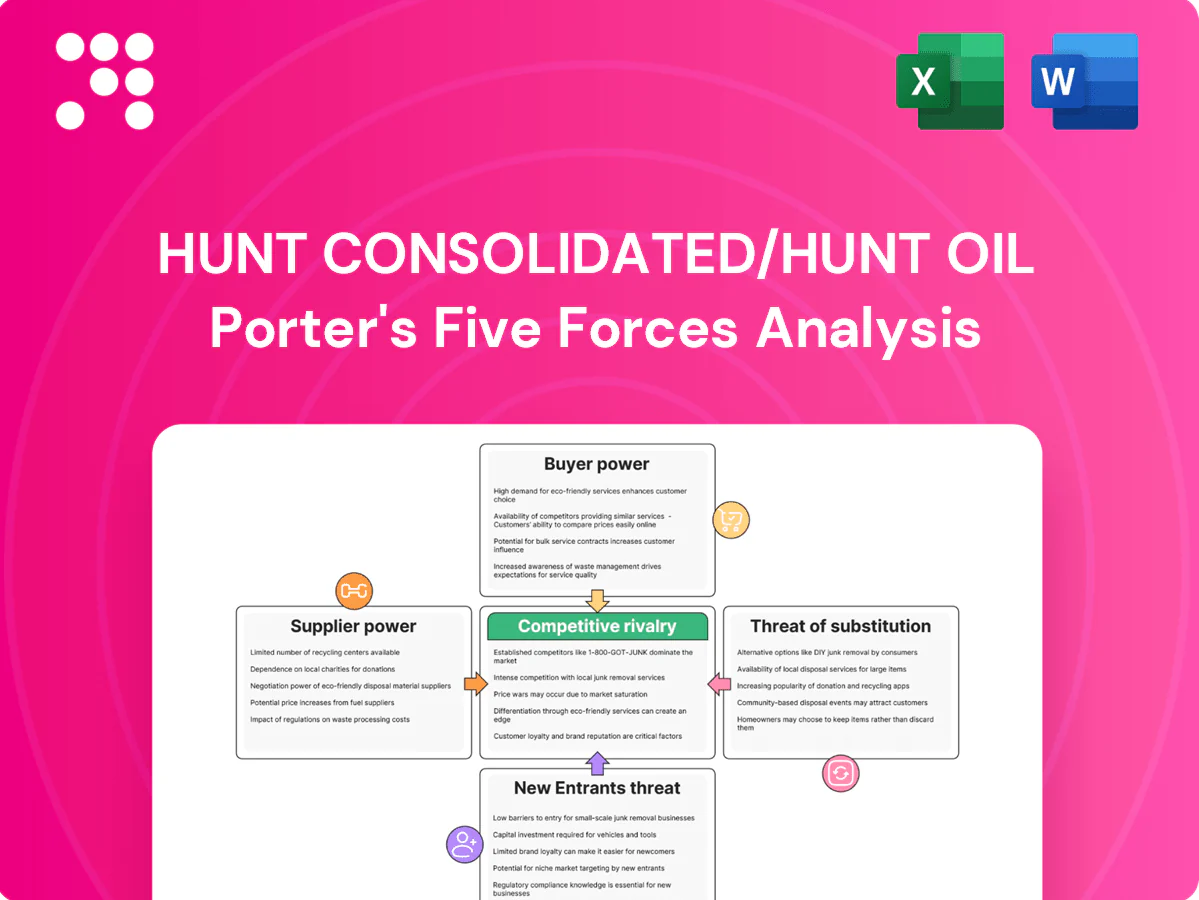
Hunt Consolidated/Hunt Oil Porter's Five Forces Analysis

A Must-Have Tool for Decision-Makers
Hunt Consolidated/Hunt Oil faces strong supplier and regulatory pressures, commodity-price volatility, differentiated buyer leverage in refined markets, and competitive intensity mitigated by scale and diversified assets. This snapshot hints at strategic hotspots—unlock the full Porter's Five Forces Analysis for force-by-force ratings, visuals, and actionable insights to inform investment or strategy.
Suppliers Bargaining Power

Concentrated oilfield services
Oilfield service and rig contractors are concentrated—top three players (Schlumberger, Halliburton, Baker Hughes) command roughly 50–60% of key service markets in 2024—giving pricing leverage in tight cycles. Hunt’s global E&P footprint needs specialized drilling, completion and seismic vendors, and day rates can jump 20–50% during upcycles. Long-term framework agreements and preferred-vendor deals mitigate but do not eliminate cost spikes.
Access to acreage and minerals
Governments, NOCs and private mineral owners act as critical suppliers of subsurface rights, with NOCs controlling roughly 80% of global proved oil reserves; fiscal terms, royalties (commonly 12.5–25%) and bonus bids materially affect project economics. Competitive bid rounds, especially in high-price cycles, can push upfront bonus obligations into the hundreds of millions per tract. Hunt’s operator track record since 1934 improves access and bid competitiveness but cannot fully offset acreage scarcity and sovereign allocation policies.

Pipelines and processing capacity
Pipelines and processing are essential for monetizing Hunt volumes, and regional takeaway constraints can force basis discounts or flaring curtailments, increasing supplier leverage. Midstream take-or-pay contracts create material fixed costs and counterparty exposure; major US midstream firms reported fee-based revenue around 60–70% in 2024. Strategic midstream partnerships reduce regional dependence and mitigate price and operational risk.

Specialized equipment and technology
Energy, chemicals, and steel inputs
Diesel, proppant, tubulars and chemicals are volatile and cyclical, and input inflation squeezes margins when oil prices lag, with completion inputs often accounting for up to half of per-well CAPEX in major US basins.
Multi-sourcing and hedging provide partial relief; localizing supply chains in Permian and Eagle Ford basins reduces logistics cost and downtime, cutting haul costs by double-digit percentages in operator reports.
- Supplier volatility: high
- Input share: up to 50% of well CAPEX
- Mitigants: multi-source, hedging, local supply hubs
Supply bottlenecks, NOC control and high completion costs squeeze E&P margins
Suppliers exert material leverage: top three oilfield service firms held ~50–60% of key markets in 2024, pushing day rates 20–50% in upcycles. NOCs control ~80% of proved reserves and royalties (12.5–25%) and bid bonuses raise upfront costs. Midstream take-or-pay contracts and OEM lead times (up to 18 months) plus inputs (completion = ~50% well CAPEX) increase cost and schedule risk.
| Factor | 2024 metric | Impact on Hunt |
|---|---|---|
| Oilfield services | Top3: 50–60% | Pricing leverage |
| NOCs/acreage | Reserves control ~80% | Fiscal/bonus pressure |
| Midstream | Take-or-pay; fees 60–70% | Tightened cashflow |
| OEM lead times | Up to 18 months | Capex/schedule risk |
| Completion inputs | ~50% well CAPEX | Margin sensitivity |
What is included in the product
 Detailed Word Document
Tailored Porter’s Five Forces analysis of Hunt Consolidated/Hunt Oil that uncovers competitive drivers, supplier and buyer bargaining power, and barriers to entry, highlighting disruptive substitutes and regulatory threats to market share and profitability.

 Customizable Excel Spreadsheet
A concise one-sheet Porter's Five Forces for Hunt Consolidated/Hunt Oil that highlights supplier/customer bargaining, barriers to entry, substitutes, and competitive rivalry—quickly pinpointing strategic pressure points and actionable remedies for deal teams and management.
Customers Bargaining Power

Commodity price takers
Crude and gas are largely sold into transparent Brent and WTI benchmarks, limiting Hunt’s pricing discretion; global oil demand reached about 101.9 mb/d in 2024 (IEA), sustaining benchmark-led pricing. Fungibility and active spot markets allow buyers to switch suppliers easily, weakening bilateral leverage. Netbacks depend on quality differentials and transport costs, which can materially alter realized margins. Deep market liquidity dilutes individual buyer power but enforces price discipline.
Refiners and utilities concentration
Large refiners, gas utilities and LNG offtakers are few and sophisticated, enabling demands on specs, reliability and risk-shifting contract terms; US crude distillation capacity was about 18.9 million b/d in 2024 (EIA), concentrating negotiating power. Creditworthy buyers extract better pricing and flexibility. Hunt can diversify counterparties across regions and product types to balance buyer leverage.

Contract versus spot dynamics
Long-term contracts for gas/LNG and power (often 10–20 years) stabilize offtake but lock in indexation and pricing formulas; take-or-pay commitments commonly cover 70–90% of contracted volumes. In 2024 spot LNG accounted for roughly 40% of global cargoes, enabling buyers to push for discounts in gluts while premiums narrowed to single digits during tightness. Hunt’s mix of spot and term sales reduces exposure to such cyclical buyer bargaining.

Product quality and blending
Product quality drives buyer leverage: API gravity (light >31.1°API, heavy <22.3°API) and sulfur (sweet ≤0.5% S, sour >0.5% S) materially affect realizations; contaminants invite discounts or rejection. Blending and conditioning can restore value but incur processing and logistics costs. Hunt’s asset mix and marketing capability determine average netbacks.
- API gravity thresholds: light/medium/heavy
- Sulfur cutoff: sweet ≤0.5% S
- Off-spec = discounts or rejection
- Blending recovers value at added cost
Access to alternative sources
Buyers can source crude and products from global producers, storage hubs or via financial instruments, and the IEA estimated 2024 world oil demand at about 101.1 million barrels per day, which amplifies cross-border optionality and buyer leverage. Practical alternatives are constrained by regional pipeline, rail and export capacity, and Hunt’s multi-basin and international footprint helps maintain offtake continuity across cycles.
- Global demand: IEA 2024 ~101.1 mb/d
- Optionality: physical, storage, financial
- Constraints: regional infrastructure/basis
- Hunt advantage: multi-basin + international reach
Benchmark pricing and ~40% spot LNG give buyers leverage despite multi-basin term mix
Buyers face benchmark-driven pricing (Brent/WTI) limiting Hunt’s price flexibility; global oil demand ~101.9 mb/d (IEA 2024) and US distillation ~18.9 mb/d (EIA 2024) shape market depth. Large refiners/LNG offtakers concentrate bargaining power; spot LNG ~40% of cargoes (2024) boosts buyer optionality. Hunt’s multi-basin portfolio and term/spot mix mitigate but do not eliminate buyer leverage.
| Metric | 2024 |
|---|---|
| Global oil demand | 101.9 mb/d (IEA) |
| US crude capacity | 18.9 mb/d (EIA) |
| Spot LNG share | ~40% |
Same Document Delivered
Hunt Consolidated/Hunt Oil Porter's Five Forces Analysis
This Porter's Five Forces analysis of Hunt Consolidated/Hunt Oil evaluates competitive rivalry, supplier and buyer power, threat of substitutes, and barriers to entry specific to the company's oil and diversified energy operations. The preview you see is the exact, professionally formatted document you'll receive immediately after purchase. No placeholders, no mockups—ready for download and use.

A Must-Have Tool for Decision-Makers
Hunt Consolidated/Hunt Oil faces strong supplier and regulatory pressures, commodity-price volatility, differentiated buyer leverage in refined markets, and competitive intensity mitigated by scale and diversified assets. This snapshot hints at strategic hotspots—unlock the full Porter's Five Forces Analysis for force-by-force ratings, visuals, and actionable insights to inform investment or strategy.
Suppliers Bargaining Power
Concentrated oilfield services
Oilfield service and rig contractors are concentrated—top three players (Schlumberger, Halliburton, Baker Hughes) command roughly 50–60% of key service markets in 2024—giving pricing leverage in tight cycles. Hunt’s global E&P footprint needs specialized drilling, completion and seismic vendors, and day rates can jump 20–50% during upcycles. Long-term framework agreements and preferred-vendor deals mitigate but do not eliminate cost spikes.
Access to acreage and minerals
Governments, NOCs and private mineral owners act as critical suppliers of subsurface rights, with NOCs controlling roughly 80% of global proved oil reserves; fiscal terms, royalties (commonly 12.5–25%) and bonus bids materially affect project economics. Competitive bid rounds, especially in high-price cycles, can push upfront bonus obligations into the hundreds of millions per tract. Hunt’s operator track record since 1934 improves access and bid competitiveness but cannot fully offset acreage scarcity and sovereign allocation policies.
Pipelines and processing capacity
Pipelines and processing are essential for monetizing Hunt volumes, and regional takeaway constraints can force basis discounts or flaring curtailments, increasing supplier leverage. Midstream take-or-pay contracts create material fixed costs and counterparty exposure; major US midstream firms reported fee-based revenue around 60–70% in 2024. Strategic midstream partnerships reduce regional dependence and mitigate price and operational risk.
Specialized equipment and technology
Energy, chemicals, and steel inputs
Diesel, proppant, tubulars and chemicals are volatile and cyclical, and input inflation squeezes margins when oil prices lag, with completion inputs often accounting for up to half of per-well CAPEX in major US basins.
Multi-sourcing and hedging provide partial relief; localizing supply chains in Permian and Eagle Ford basins reduces logistics cost and downtime, cutting haul costs by double-digit percentages in operator reports.
- Supplier volatility: high
- Input share: up to 50% of well CAPEX
- Mitigants: multi-source, hedging, local supply hubs
Supply bottlenecks, NOC control and high completion costs squeeze E&P margins
Suppliers exert material leverage: top three oilfield service firms held ~50–60% of key markets in 2024, pushing day rates 20–50% in upcycles. NOCs control ~80% of proved reserves and royalties (12.5–25%) and bid bonuses raise upfront costs. Midstream take-or-pay contracts and OEM lead times (up to 18 months) plus inputs (completion = ~50% well CAPEX) increase cost and schedule risk.
| Factor | 2024 metric | Impact on Hunt |
|---|---|---|
| Oilfield services | Top3: 50–60% | Pricing leverage |
| NOCs/acreage | Reserves control ~80% | Fiscal/bonus pressure |
| Midstream | Take-or-pay; fees 60–70% | Tightened cashflow |
| OEM lead times | Up to 18 months | Capex/schedule risk |
| Completion inputs | ~50% well CAPEX | Margin sensitivity |
What is included in the product
Detailed Word Document
Tailored Porter’s Five Forces analysis of Hunt Consolidated/Hunt Oil that uncovers competitive drivers, supplier and buyer bargaining power, and barriers to entry, highlighting disruptive substitutes and regulatory threats to market share and profitability.
Customizable Excel Spreadsheet
A concise one-sheet Porter's Five Forces for Hunt Consolidated/Hunt Oil that highlights supplier/customer bargaining, barriers to entry, substitutes, and competitive rivalry—quickly pinpointing strategic pressure points and actionable remedies for deal teams and management.
Customers Bargaining Power
Commodity price takers
Crude and gas are largely sold into transparent Brent and WTI benchmarks, limiting Hunt’s pricing discretion; global oil demand reached about 101.9 mb/d in 2024 (IEA), sustaining benchmark-led pricing. Fungibility and active spot markets allow buyers to switch suppliers easily, weakening bilateral leverage. Netbacks depend on quality differentials and transport costs, which can materially alter realized margins. Deep market liquidity dilutes individual buyer power but enforces price discipline.
Refiners and utilities concentration
Large refiners, gas utilities and LNG offtakers are few and sophisticated, enabling demands on specs, reliability and risk-shifting contract terms; US crude distillation capacity was about 18.9 million b/d in 2024 (EIA), concentrating negotiating power. Creditworthy buyers extract better pricing and flexibility. Hunt can diversify counterparties across regions and product types to balance buyer leverage.
Contract versus spot dynamics
Long-term contracts for gas/LNG and power (often 10–20 years) stabilize offtake but lock in indexation and pricing formulas; take-or-pay commitments commonly cover 70–90% of contracted volumes. In 2024 spot LNG accounted for roughly 40% of global cargoes, enabling buyers to push for discounts in gluts while premiums narrowed to single digits during tightness. Hunt’s mix of spot and term sales reduces exposure to such cyclical buyer bargaining.
Product quality and blending
Product quality drives buyer leverage: API gravity (light >31.1°API, heavy <22.3°API) and sulfur (sweet ≤0.5% S, sour >0.5% S) materially affect realizations; contaminants invite discounts or rejection. Blending and conditioning can restore value but incur processing and logistics costs. Hunt’s asset mix and marketing capability determine average netbacks.
- API gravity thresholds: light/medium/heavy
- Sulfur cutoff: sweet ≤0.5% S
- Off-spec = discounts or rejection
- Blending recovers value at added cost
Access to alternative sources
Buyers can source crude and products from global producers, storage hubs or via financial instruments, and the IEA estimated 2024 world oil demand at about 101.1 million barrels per day, which amplifies cross-border optionality and buyer leverage. Practical alternatives are constrained by regional pipeline, rail and export capacity, and Hunt’s multi-basin and international footprint helps maintain offtake continuity across cycles.
- Global demand: IEA 2024 ~101.1 mb/d
- Optionality: physical, storage, financial
- Constraints: regional infrastructure/basis
- Hunt advantage: multi-basin + international reach
Benchmark pricing and ~40% spot LNG give buyers leverage despite multi-basin term mix
Buyers face benchmark-driven pricing (Brent/WTI) limiting Hunt’s price flexibility; global oil demand ~101.9 mb/d (IEA 2024) and US distillation ~18.9 mb/d (EIA 2024) shape market depth. Large refiners/LNG offtakers concentrate bargaining power; spot LNG ~40% of cargoes (2024) boosts buyer optionality. Hunt’s multi-basin portfolio and term/spot mix mitigate but do not eliminate buyer leverage.
| Metric | 2024 |
|---|---|
| Global oil demand | 101.9 mb/d (IEA) |
| US crude capacity | 18.9 mb/d (EIA) |
| Spot LNG share | ~40% |
Same Document Delivered
Hunt Consolidated/Hunt Oil Porter's Five Forces Analysis
This Porter's Five Forces analysis of Hunt Consolidated/Hunt Oil evaluates competitive rivalry, supplier and buyer power, threat of substitutes, and barriers to entry specific to the company's oil and diversified energy operations. The preview you see is the exact, professionally formatted document you'll receive immediately after purchase. No placeholders, no mockups—ready for download and use.
Original: $10.00
-65%$10.00
$3.50Description
A Must-Have Tool for Decision-Makers
Hunt Consolidated/Hunt Oil faces strong supplier and regulatory pressures, commodity-price volatility, differentiated buyer leverage in refined markets, and competitive intensity mitigated by scale and diversified assets. This snapshot hints at strategic hotspots—unlock the full Porter's Five Forces Analysis for force-by-force ratings, visuals, and actionable insights to inform investment or strategy.
Suppliers Bargaining Power
Concentrated oilfield services
Oilfield service and rig contractors are concentrated—top three players (Schlumberger, Halliburton, Baker Hughes) command roughly 50–60% of key service markets in 2024—giving pricing leverage in tight cycles. Hunt’s global E&P footprint needs specialized drilling, completion and seismic vendors, and day rates can jump 20–50% during upcycles. Long-term framework agreements and preferred-vendor deals mitigate but do not eliminate cost spikes.
Access to acreage and minerals
Governments, NOCs and private mineral owners act as critical suppliers of subsurface rights, with NOCs controlling roughly 80% of global proved oil reserves; fiscal terms, royalties (commonly 12.5–25%) and bonus bids materially affect project economics. Competitive bid rounds, especially in high-price cycles, can push upfront bonus obligations into the hundreds of millions per tract. Hunt’s operator track record since 1934 improves access and bid competitiveness but cannot fully offset acreage scarcity and sovereign allocation policies.
Pipelines and processing capacity
Pipelines and processing are essential for monetizing Hunt volumes, and regional takeaway constraints can force basis discounts or flaring curtailments, increasing supplier leverage. Midstream take-or-pay contracts create material fixed costs and counterparty exposure; major US midstream firms reported fee-based revenue around 60–70% in 2024. Strategic midstream partnerships reduce regional dependence and mitigate price and operational risk.
Specialized equipment and technology
Energy, chemicals, and steel inputs
Diesel, proppant, tubulars and chemicals are volatile and cyclical, and input inflation squeezes margins when oil prices lag, with completion inputs often accounting for up to half of per-well CAPEX in major US basins.
Multi-sourcing and hedging provide partial relief; localizing supply chains in Permian and Eagle Ford basins reduces logistics cost and downtime, cutting haul costs by double-digit percentages in operator reports.
- Supplier volatility: high
- Input share: up to 50% of well CAPEX
- Mitigants: multi-source, hedging, local supply hubs
Supply bottlenecks, NOC control and high completion costs squeeze E&P margins
Suppliers exert material leverage: top three oilfield service firms held ~50–60% of key markets in 2024, pushing day rates 20–50% in upcycles. NOCs control ~80% of proved reserves and royalties (12.5–25%) and bid bonuses raise upfront costs. Midstream take-or-pay contracts and OEM lead times (up to 18 months) plus inputs (completion = ~50% well CAPEX) increase cost and schedule risk.
| Factor | 2024 metric | Impact on Hunt |
|---|---|---|
| Oilfield services | Top3: 50–60% | Pricing leverage |
| NOCs/acreage | Reserves control ~80% | Fiscal/bonus pressure |
| Midstream | Take-or-pay; fees 60–70% | Tightened cashflow |
| OEM lead times | Up to 18 months | Capex/schedule risk |
| Completion inputs | ~50% well CAPEX | Margin sensitivity |
What is included in the product
Detailed Word Document
Tailored Porter’s Five Forces analysis of Hunt Consolidated/Hunt Oil that uncovers competitive drivers, supplier and buyer bargaining power, and barriers to entry, highlighting disruptive substitutes and regulatory threats to market share and profitability.
Customizable Excel Spreadsheet
A concise one-sheet Porter's Five Forces for Hunt Consolidated/Hunt Oil that highlights supplier/customer bargaining, barriers to entry, substitutes, and competitive rivalry—quickly pinpointing strategic pressure points and actionable remedies for deal teams and management.
Customers Bargaining Power
Commodity price takers
Crude and gas are largely sold into transparent Brent and WTI benchmarks, limiting Hunt’s pricing discretion; global oil demand reached about 101.9 mb/d in 2024 (IEA), sustaining benchmark-led pricing. Fungibility and active spot markets allow buyers to switch suppliers easily, weakening bilateral leverage. Netbacks depend on quality differentials and transport costs, which can materially alter realized margins. Deep market liquidity dilutes individual buyer power but enforces price discipline.
Refiners and utilities concentration
Large refiners, gas utilities and LNG offtakers are few and sophisticated, enabling demands on specs, reliability and risk-shifting contract terms; US crude distillation capacity was about 18.9 million b/d in 2024 (EIA), concentrating negotiating power. Creditworthy buyers extract better pricing and flexibility. Hunt can diversify counterparties across regions and product types to balance buyer leverage.
Contract versus spot dynamics
Long-term contracts for gas/LNG and power (often 10–20 years) stabilize offtake but lock in indexation and pricing formulas; take-or-pay commitments commonly cover 70–90% of contracted volumes. In 2024 spot LNG accounted for roughly 40% of global cargoes, enabling buyers to push for discounts in gluts while premiums narrowed to single digits during tightness. Hunt’s mix of spot and term sales reduces exposure to such cyclical buyer bargaining.
Product quality and blending
Product quality drives buyer leverage: API gravity (light >31.1°API, heavy <22.3°API) and sulfur (sweet ≤0.5% S, sour >0.5% S) materially affect realizations; contaminants invite discounts or rejection. Blending and conditioning can restore value but incur processing and logistics costs. Hunt’s asset mix and marketing capability determine average netbacks.
- API gravity thresholds: light/medium/heavy
- Sulfur cutoff: sweet ≤0.5% S
- Off-spec = discounts or rejection
- Blending recovers value at added cost
Access to alternative sources
Buyers can source crude and products from global producers, storage hubs or via financial instruments, and the IEA estimated 2024 world oil demand at about 101.1 million barrels per day, which amplifies cross-border optionality and buyer leverage. Practical alternatives are constrained by regional pipeline, rail and export capacity, and Hunt’s multi-basin and international footprint helps maintain offtake continuity across cycles.
- Global demand: IEA 2024 ~101.1 mb/d
- Optionality: physical, storage, financial
- Constraints: regional infrastructure/basis
- Hunt advantage: multi-basin + international reach
Benchmark pricing and ~40% spot LNG give buyers leverage despite multi-basin term mix
Buyers face benchmark-driven pricing (Brent/WTI) limiting Hunt’s price flexibility; global oil demand ~101.9 mb/d (IEA 2024) and US distillation ~18.9 mb/d (EIA 2024) shape market depth. Large refiners/LNG offtakers concentrate bargaining power; spot LNG ~40% of cargoes (2024) boosts buyer optionality. Hunt’s multi-basin portfolio and term/spot mix mitigate but do not eliminate buyer leverage.
| Metric | 2024 |
|---|---|
| Global oil demand | 101.9 mb/d (IEA) |
| US crude capacity | 18.9 mb/d (EIA) |
| Spot LNG share | ~40% |
Same Document Delivered
Hunt Consolidated/Hunt Oil Porter's Five Forces Analysis
This Porter's Five Forces analysis of Hunt Consolidated/Hunt Oil evaluates competitive rivalry, supplier and buyer power, threat of substitutes, and barriers to entry specific to the company's oil and diversified energy operations. The preview you see is the exact, professionally formatted document you'll receive immediately after purchase. No placeholders, no mockups—ready for download and use.











