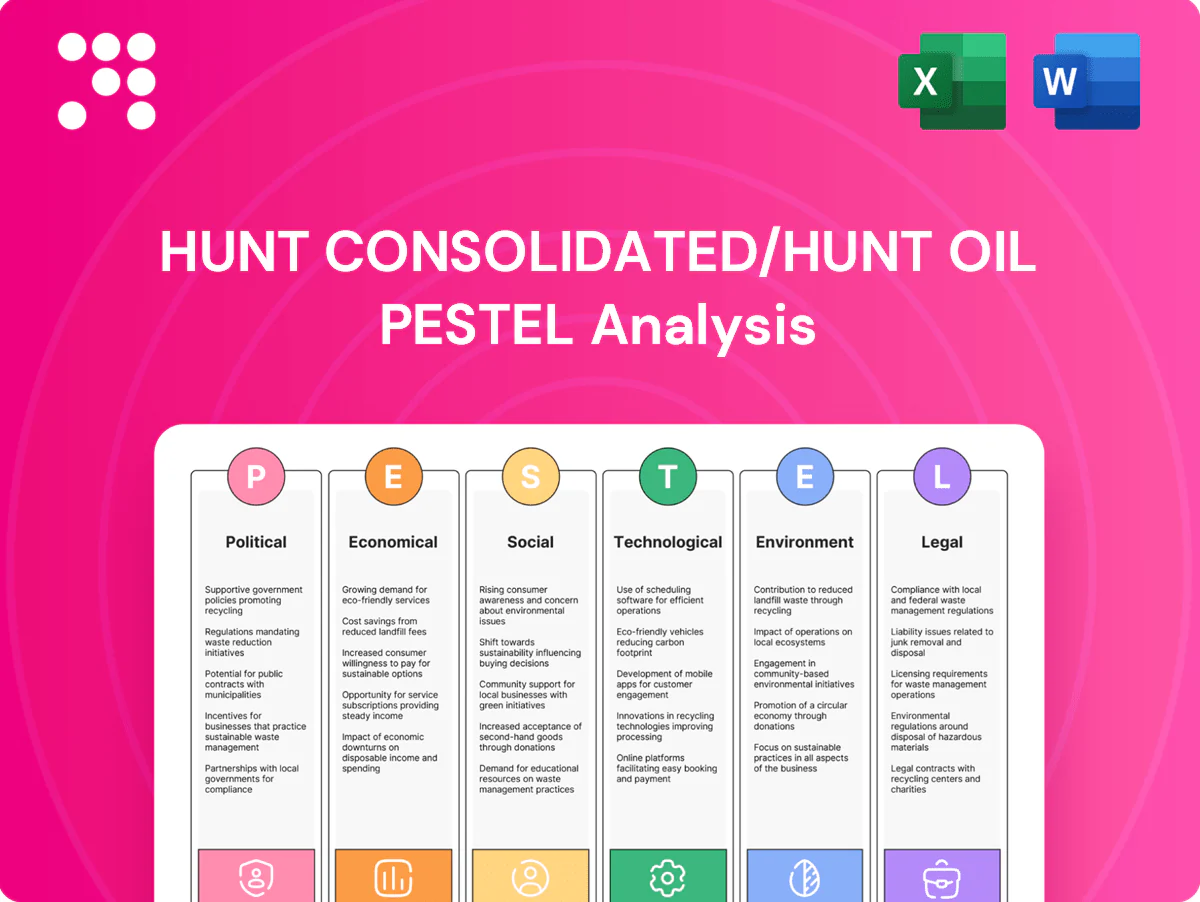
Hunt Consolidated/Hunt Oil PESTLE Analysis

Plan Smarter. Present Sharper. Compete Stronger.
Discover how political, economic, environmental, and technological forces shape Hunt Consolidated/Hunt Oil’s strategy and risk profile. Our concise PESTLE highlights regulatory exposure, market drivers, and sustainability pressures. Perfect for investors and strategists seeking actionable intelligence—purchase the full analysis for the complete, downloadable report.
Political factors

Resource nationalism risk
Host governments can change fiscal terms, royalties and local‑content rules, directly compressing field-level cash flows and project IRRs, so Hunt faces material policy risk across its global E&P exposure.
Hunt’s international footprint heightens sensitivity to election cycles and regime shifts, making proactive stakeholder engagement and stabilization clauses critical to mitigate expropriation or contract‑revision risk.
Maintaining portfolio diversification across jurisdictions reduces concentration risk and preserves optionality when individual countries tighten resource‑nationalism measures.
Geopolitical supply disruptions
Conflicts, sanctions and chokepoint tensions constrain exports and raise price volatility — about 20% of seaborne oil transits the Strait of Hormuz and disruptions drove notable spot swings in 2024. Upstream Hunt operations face operational security and logistics challenges, from force majeure to rerouting. Hedging and contingency sourcing mitigate impacts. Hunt's power and real estate segments provide partial counter‑cyclical revenue buffers.

Energy policy transitions
National net-zero strategies (most major economies target net-zero by 2050) are reshaping licensing, subsidies and grid interconnection priorities, with clean-energy investment rising to roughly $1.7 trillion globally in 2023. Policy incentives increasingly favor gas, CCUS and renewables over new oil developments, shifting subsidy and permitting windows. Aligning Hunt’s capital toward transition-aligned investments preserves optionality; active policy monitoring refines timing of upstream versus CCUS/renewables spend.

US federal and state dynamics
Trade and investment regimes
Tariffs, export controls and FDI screening can delay equipment imports and JV approvals; FDI reviews have expanded to about 40 jurisdictions since 2018, raising timelines and costs for upstream projects.
Sanctions compliance (US, EU, OFAC) narrows counterparty choice and forces rerouting; structured local partnerships and >30% local procurement can cut exposure, while legal and treasury oversight is essential for cross-border cash repatriation.
- Tariffs/export controls: slower permits, higher capex
- Sanctions: restrict counterparties, force reroutes
- Mitigants: local JVs, >30% local procurement, strict treasury review
Hormuz chokepoint, US permits and net-zero spend squeeze oil cash flows and IRRs
Host fiscal shifts, elections and sanctions materially compress field‑level cash flows; ~20% of seaborne oil transits the Strait of Hormuz and 2024 disruptions drove sharp spot swings. US policy (federal leases, methane rules) and state permitting (TX/NM ≈46% US crude in 2023) directly affect timing and IRR. Global net‑zero pushes — $1.7T clean‑energy spend in 2023 — reallocate subsidies toward gas/CCUS/renewables.
| Risk | Metric | Impact |
|---|---|---|
| Chokepoints | Strait of Hormuz ~20% | Price volatility |
| US exposure | TX/NM ~46% of US crude (2023) | Permit/timing risk |
| Transition policy | $1.7T clean spend (2023) | CAPEX shift |
What is included in the product
 Detailed Word Document
Explores how external macro-environmental factors uniquely affect Hunt Consolidated/Hunt Oil across Political, Economic, Social, Technological, Environmental and Legal dimensions, with data-backed trends, tailored examples and forward-looking insights to help executives, investors and strategists identify threats, opportunities and scenario-driven actions.

 Customizable Excel Spreadsheet
A concise, PESTLE-segmented summary of Hunt Consolidated/Hunt Oil that simplifies external risk, regulatory and market insights for quick reference in meetings or slides; editable notes and clean language make it easily shareable across teams and usable in client reports or planning sessions.
Economic factors

Hydrocarbon price cyclicality
Oil and gas price swings directly drive E&P cash generation and capex flexibility for Hunt, with Brent averaging about 86 USD/bbl in 2024 and swings materially affecting free cash flow. Downturns compress margins and can limit reserves booking, while upcycles enable accelerated development and M&A. Disciplined hedging programs and variable cost structures have historically stabilized returns, and cash flows from Hunt’s real estate and power businesses smooth earnings through cycles.
Interest rates and financing
Higher interest rates raise WACC and compress DCF valuations for Hunt’s long‑lived oil, pipeline and property projects. As a private company, Hunt Consolidated lacks public equity access, so debt pricing and covenants are pivotal to project viability. Laddered debt, project finance structures and joint‑venture partnerships can optimize blended capital costs. Rate hedges (swaps/caps) protect development pipelines; US 10‑yr ~4.1% and fed funds ~5.3% (July 2025).

Inflation and supply chain costs
Service inflation across rigs, OCTG and labor has compressed project IRRs at Hunt Oil, increasing operating expenses and lengthening payback periods. Long-lead equipment and grid components continue to face bottlenecks, raising schedule risk and capital carry. Strategic sourcing and multi-year contracts are used to lock in pricing and mitigate margin erosion. Investment in productivity technologies—digital drilling, automation—helps offset cost escalation and improve unit economics.

FX volatility
Multi-country operations expose Hunt to FX swings that can move revenues, capex and opex; BIS reported global FX turnover of about 7.5 trillion USD/day (2022), underscoring market liquidity and volatility risks. Currency mismatches have the potential to distort cash flows and debt service; firms saw EM currency moves of +/-10% vs USD in select 2023–24 episodes. Natural hedges, derivatives and local financing materially reduce mismatch and enhance resilience.
- FX exposure: revenues, capex, opex
- Risk: currency mismatches → cash-flow/debt distortion
- Mitigants: natural hedges + derivatives
- Resilience: local currency financing & cost alignment
Energy demand mix
- Gas share ~24% global primary energy (BP 2023)
- Oil ~31% of primary energy
- Non‑OECD = majority of incremental liquids demand
- Portfolio focus: gas + dispatchable power for durable cash flows
Hormuz chokepoint, US permits and net-zero spend squeeze oil cash flows and IRRs
Oil/gas price swings drive E&P cash generation; Brent averaged ~86 USD/bbl in 2024, dictating capex and FCF timing. Higher rates lift WACC—US 10‑yr ~4.1% and fed funds ~5.3% (Jul 2025)—making debt pricing and covenants pivotal. Service inflation and FX volatility (EM moves ±~10% 2023–24) raise opex/schedule risk; hedges, JV financing and local currency debt mitigate.
| Metric | Value | Impact |
|---|---|---|
| Brent (2024) | ~86 USD/bbl | Drives FCF & capex |
| US 10‑yr (Jul 2025) | ~4.1% | Raises WACC |
| Fed funds (Jul 2025) | ~5.3% | Debt cost/covenants |
| EM FX moves (2023–24) | ±~10% | Cash‑flow volatility |
What You See Is What You Get
Hunt Consolidated/Hunt Oil PESTLE Analysis
The preview shown here is the exact Hunt Consolidated / Hunt Oil PESTLE Analysis you’ll receive after purchase — fully formatted, professionally structured, and ready to use. It contains the same content, layout, and insights visible now. No placeholders or teasers; this is the final downloadable file immediately available after checkout.

Plan Smarter. Present Sharper. Compete Stronger.
Discover how political, economic, environmental, and technological forces shape Hunt Consolidated/Hunt Oil’s strategy and risk profile. Our concise PESTLE highlights regulatory exposure, market drivers, and sustainability pressures. Perfect for investors and strategists seeking actionable intelligence—purchase the full analysis for the complete, downloadable report.
Political factors
Resource nationalism risk
Host governments can change fiscal terms, royalties and local‑content rules, directly compressing field-level cash flows and project IRRs, so Hunt faces material policy risk across its global E&P exposure.
Hunt’s international footprint heightens sensitivity to election cycles and regime shifts, making proactive stakeholder engagement and stabilization clauses critical to mitigate expropriation or contract‑revision risk.
Maintaining portfolio diversification across jurisdictions reduces concentration risk and preserves optionality when individual countries tighten resource‑nationalism measures.
Geopolitical supply disruptions
Conflicts, sanctions and chokepoint tensions constrain exports and raise price volatility — about 20% of seaborne oil transits the Strait of Hormuz and disruptions drove notable spot swings in 2024. Upstream Hunt operations face operational security and logistics challenges, from force majeure to rerouting. Hedging and contingency sourcing mitigate impacts. Hunt's power and real estate segments provide partial counter‑cyclical revenue buffers.
Energy policy transitions
National net-zero strategies (most major economies target net-zero by 2050) are reshaping licensing, subsidies and grid interconnection priorities, with clean-energy investment rising to roughly $1.7 trillion globally in 2023. Policy incentives increasingly favor gas, CCUS and renewables over new oil developments, shifting subsidy and permitting windows. Aligning Hunt’s capital toward transition-aligned investments preserves optionality; active policy monitoring refines timing of upstream versus CCUS/renewables spend.
US federal and state dynamics
Trade and investment regimes
Tariffs, export controls and FDI screening can delay equipment imports and JV approvals; FDI reviews have expanded to about 40 jurisdictions since 2018, raising timelines and costs for upstream projects.
Sanctions compliance (US, EU, OFAC) narrows counterparty choice and forces rerouting; structured local partnerships and >30% local procurement can cut exposure, while legal and treasury oversight is essential for cross-border cash repatriation.
- Tariffs/export controls: slower permits, higher capex
- Sanctions: restrict counterparties, force reroutes
- Mitigants: local JVs, >30% local procurement, strict treasury review
Hormuz chokepoint, US permits and net-zero spend squeeze oil cash flows and IRRs
Host fiscal shifts, elections and sanctions materially compress field‑level cash flows; ~20% of seaborne oil transits the Strait of Hormuz and 2024 disruptions drove sharp spot swings. US policy (federal leases, methane rules) and state permitting (TX/NM ≈46% US crude in 2023) directly affect timing and IRR. Global net‑zero pushes — $1.7T clean‑energy spend in 2023 — reallocate subsidies toward gas/CCUS/renewables.
| Risk | Metric | Impact |
|---|---|---|
| Chokepoints | Strait of Hormuz ~20% | Price volatility |
| US exposure | TX/NM ~46% of US crude (2023) | Permit/timing risk |
| Transition policy | $1.7T clean spend (2023) | CAPEX shift |
What is included in the product
Detailed Word Document
Explores how external macro-environmental factors uniquely affect Hunt Consolidated/Hunt Oil across Political, Economic, Social, Technological, Environmental and Legal dimensions, with data-backed trends, tailored examples and forward-looking insights to help executives, investors and strategists identify threats, opportunities and scenario-driven actions.
Customizable Excel Spreadsheet
A concise, PESTLE-segmented summary of Hunt Consolidated/Hunt Oil that simplifies external risk, regulatory and market insights for quick reference in meetings or slides; editable notes and clean language make it easily shareable across teams and usable in client reports or planning sessions.
Economic factors
Hydrocarbon price cyclicality
Oil and gas price swings directly drive E&P cash generation and capex flexibility for Hunt, with Brent averaging about 86 USD/bbl in 2024 and swings materially affecting free cash flow. Downturns compress margins and can limit reserves booking, while upcycles enable accelerated development and M&A. Disciplined hedging programs and variable cost structures have historically stabilized returns, and cash flows from Hunt’s real estate and power businesses smooth earnings through cycles.
Interest rates and financing
Higher interest rates raise WACC and compress DCF valuations for Hunt’s long‑lived oil, pipeline and property projects. As a private company, Hunt Consolidated lacks public equity access, so debt pricing and covenants are pivotal to project viability. Laddered debt, project finance structures and joint‑venture partnerships can optimize blended capital costs. Rate hedges (swaps/caps) protect development pipelines; US 10‑yr ~4.1% and fed funds ~5.3% (July 2025).
Inflation and supply chain costs
Service inflation across rigs, OCTG and labor has compressed project IRRs at Hunt Oil, increasing operating expenses and lengthening payback periods. Long-lead equipment and grid components continue to face bottlenecks, raising schedule risk and capital carry. Strategic sourcing and multi-year contracts are used to lock in pricing and mitigate margin erosion. Investment in productivity technologies—digital drilling, automation—helps offset cost escalation and improve unit economics.
FX volatility
Multi-country operations expose Hunt to FX swings that can move revenues, capex and opex; BIS reported global FX turnover of about 7.5 trillion USD/day (2022), underscoring market liquidity and volatility risks. Currency mismatches have the potential to distort cash flows and debt service; firms saw EM currency moves of +/-10% vs USD in select 2023–24 episodes. Natural hedges, derivatives and local financing materially reduce mismatch and enhance resilience.
- FX exposure: revenues, capex, opex
- Risk: currency mismatches → cash-flow/debt distortion
- Mitigants: natural hedges + derivatives
- Resilience: local currency financing & cost alignment
Energy demand mix
- Gas share ~24% global primary energy (BP 2023)
- Oil ~31% of primary energy
- Non‑OECD = majority of incremental liquids demand
- Portfolio focus: gas + dispatchable power for durable cash flows
Hormuz chokepoint, US permits and net-zero spend squeeze oil cash flows and IRRs
Oil/gas price swings drive E&P cash generation; Brent averaged ~86 USD/bbl in 2024, dictating capex and FCF timing. Higher rates lift WACC—US 10‑yr ~4.1% and fed funds ~5.3% (Jul 2025)—making debt pricing and covenants pivotal. Service inflation and FX volatility (EM moves ±~10% 2023–24) raise opex/schedule risk; hedges, JV financing and local currency debt mitigate.
| Metric | Value | Impact |
|---|---|---|
| Brent (2024) | ~86 USD/bbl | Drives FCF & capex |
| US 10‑yr (Jul 2025) | ~4.1% | Raises WACC |
| Fed funds (Jul 2025) | ~5.3% | Debt cost/covenants |
| EM FX moves (2023–24) | ±~10% | Cash‑flow volatility |
What You See Is What You Get
Hunt Consolidated/Hunt Oil PESTLE Analysis
The preview shown here is the exact Hunt Consolidated / Hunt Oil PESTLE Analysis you’ll receive after purchase — fully formatted, professionally structured, and ready to use. It contains the same content, layout, and insights visible now. No placeholders or teasers; this is the final downloadable file immediately available after checkout.
Original: $10.00
-65%$10.00
$3.50Description
Plan Smarter. Present Sharper. Compete Stronger.
Discover how political, economic, environmental, and technological forces shape Hunt Consolidated/Hunt Oil’s strategy and risk profile. Our concise PESTLE highlights regulatory exposure, market drivers, and sustainability pressures. Perfect for investors and strategists seeking actionable intelligence—purchase the full analysis for the complete, downloadable report.
Political factors
Resource nationalism risk
Host governments can change fiscal terms, royalties and local‑content rules, directly compressing field-level cash flows and project IRRs, so Hunt faces material policy risk across its global E&P exposure.
Hunt’s international footprint heightens sensitivity to election cycles and regime shifts, making proactive stakeholder engagement and stabilization clauses critical to mitigate expropriation or contract‑revision risk.
Maintaining portfolio diversification across jurisdictions reduces concentration risk and preserves optionality when individual countries tighten resource‑nationalism measures.
Geopolitical supply disruptions
Conflicts, sanctions and chokepoint tensions constrain exports and raise price volatility — about 20% of seaborne oil transits the Strait of Hormuz and disruptions drove notable spot swings in 2024. Upstream Hunt operations face operational security and logistics challenges, from force majeure to rerouting. Hedging and contingency sourcing mitigate impacts. Hunt's power and real estate segments provide partial counter‑cyclical revenue buffers.
Energy policy transitions
National net-zero strategies (most major economies target net-zero by 2050) are reshaping licensing, subsidies and grid interconnection priorities, with clean-energy investment rising to roughly $1.7 trillion globally in 2023. Policy incentives increasingly favor gas, CCUS and renewables over new oil developments, shifting subsidy and permitting windows. Aligning Hunt’s capital toward transition-aligned investments preserves optionality; active policy monitoring refines timing of upstream versus CCUS/renewables spend.
US federal and state dynamics
Trade and investment regimes
Tariffs, export controls and FDI screening can delay equipment imports and JV approvals; FDI reviews have expanded to about 40 jurisdictions since 2018, raising timelines and costs for upstream projects.
Sanctions compliance (US, EU, OFAC) narrows counterparty choice and forces rerouting; structured local partnerships and >30% local procurement can cut exposure, while legal and treasury oversight is essential for cross-border cash repatriation.
- Tariffs/export controls: slower permits, higher capex
- Sanctions: restrict counterparties, force reroutes
- Mitigants: local JVs, >30% local procurement, strict treasury review
Hormuz chokepoint, US permits and net-zero spend squeeze oil cash flows and IRRs
Host fiscal shifts, elections and sanctions materially compress field‑level cash flows; ~20% of seaborne oil transits the Strait of Hormuz and 2024 disruptions drove sharp spot swings. US policy (federal leases, methane rules) and state permitting (TX/NM ≈46% US crude in 2023) directly affect timing and IRR. Global net‑zero pushes — $1.7T clean‑energy spend in 2023 — reallocate subsidies toward gas/CCUS/renewables.
| Risk | Metric | Impact |
|---|---|---|
| Chokepoints | Strait of Hormuz ~20% | Price volatility |
| US exposure | TX/NM ~46% of US crude (2023) | Permit/timing risk |
| Transition policy | $1.7T clean spend (2023) | CAPEX shift |
What is included in the product
Detailed Word Document
Explores how external macro-environmental factors uniquely affect Hunt Consolidated/Hunt Oil across Political, Economic, Social, Technological, Environmental and Legal dimensions, with data-backed trends, tailored examples and forward-looking insights to help executives, investors and strategists identify threats, opportunities and scenario-driven actions.
Customizable Excel Spreadsheet
A concise, PESTLE-segmented summary of Hunt Consolidated/Hunt Oil that simplifies external risk, regulatory and market insights for quick reference in meetings or slides; editable notes and clean language make it easily shareable across teams and usable in client reports or planning sessions.
Economic factors
Hydrocarbon price cyclicality
Oil and gas price swings directly drive E&P cash generation and capex flexibility for Hunt, with Brent averaging about 86 USD/bbl in 2024 and swings materially affecting free cash flow. Downturns compress margins and can limit reserves booking, while upcycles enable accelerated development and M&A. Disciplined hedging programs and variable cost structures have historically stabilized returns, and cash flows from Hunt’s real estate and power businesses smooth earnings through cycles.
Interest rates and financing
Higher interest rates raise WACC and compress DCF valuations for Hunt’s long‑lived oil, pipeline and property projects. As a private company, Hunt Consolidated lacks public equity access, so debt pricing and covenants are pivotal to project viability. Laddered debt, project finance structures and joint‑venture partnerships can optimize blended capital costs. Rate hedges (swaps/caps) protect development pipelines; US 10‑yr ~4.1% and fed funds ~5.3% (July 2025).
Inflation and supply chain costs
Service inflation across rigs, OCTG and labor has compressed project IRRs at Hunt Oil, increasing operating expenses and lengthening payback periods. Long-lead equipment and grid components continue to face bottlenecks, raising schedule risk and capital carry. Strategic sourcing and multi-year contracts are used to lock in pricing and mitigate margin erosion. Investment in productivity technologies—digital drilling, automation—helps offset cost escalation and improve unit economics.
FX volatility
Multi-country operations expose Hunt to FX swings that can move revenues, capex and opex; BIS reported global FX turnover of about 7.5 trillion USD/day (2022), underscoring market liquidity and volatility risks. Currency mismatches have the potential to distort cash flows and debt service; firms saw EM currency moves of +/-10% vs USD in select 2023–24 episodes. Natural hedges, derivatives and local financing materially reduce mismatch and enhance resilience.
- FX exposure: revenues, capex, opex
- Risk: currency mismatches → cash-flow/debt distortion
- Mitigants: natural hedges + derivatives
- Resilience: local currency financing & cost alignment
Energy demand mix
- Gas share ~24% global primary energy (BP 2023)
- Oil ~31% of primary energy
- Non‑OECD = majority of incremental liquids demand
- Portfolio focus: gas + dispatchable power for durable cash flows
Hormuz chokepoint, US permits and net-zero spend squeeze oil cash flows and IRRs
Oil/gas price swings drive E&P cash generation; Brent averaged ~86 USD/bbl in 2024, dictating capex and FCF timing. Higher rates lift WACC—US 10‑yr ~4.1% and fed funds ~5.3% (Jul 2025)—making debt pricing and covenants pivotal. Service inflation and FX volatility (EM moves ±~10% 2023–24) raise opex/schedule risk; hedges, JV financing and local currency debt mitigate.
| Metric | Value | Impact |
|---|---|---|
| Brent (2024) | ~86 USD/bbl | Drives FCF & capex |
| US 10‑yr (Jul 2025) | ~4.1% | Raises WACC |
| Fed funds (Jul 2025) | ~5.3% | Debt cost/covenants |
| EM FX moves (2023–24) | ±~10% | Cash‑flow volatility |
What You See Is What You Get
Hunt Consolidated/Hunt Oil PESTLE Analysis
The preview shown here is the exact Hunt Consolidated / Hunt Oil PESTLE Analysis you’ll receive after purchase — fully formatted, professionally structured, and ready to use. It contains the same content, layout, and insights visible now. No placeholders or teasers; this is the final downloadable file immediately available after checkout.











