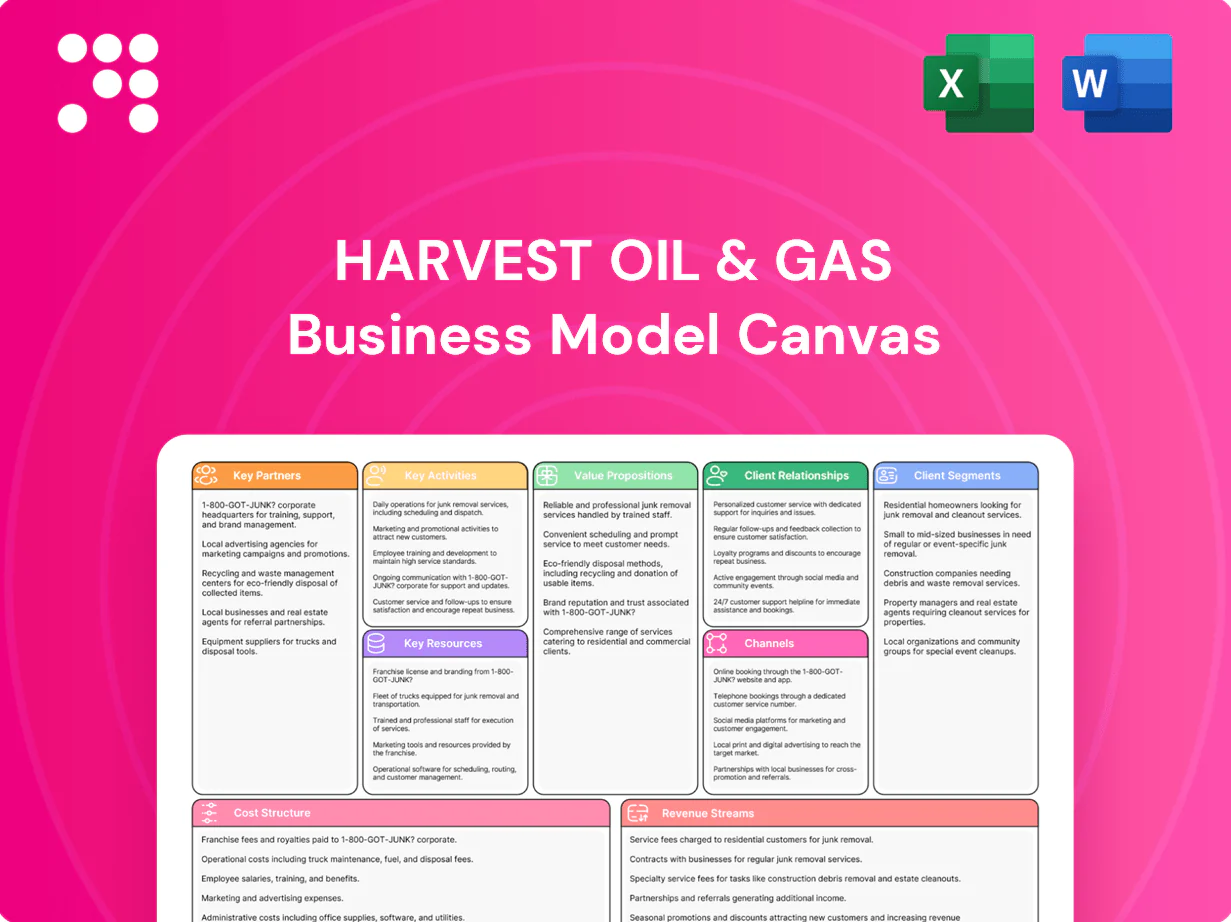
Harvest Oil & Gas Business Model Canvas

Business Model Canvas: Strategic Blueprint for Oil and Gas Investors
Unlock the strategic blueprint behind Harvest Oil & Gas with our Business Model Canvas. This concise map reveals value propositions, key partnerships, revenue streams and cost drivers. Ideal for investors and strategists seeking actionable insights. Download the full, editable Canvas to benchmark and scale results.
Partnerships

Midstream and pipeline operators
Gathering, processing and transportation partners ensure flow assurance and market access for oil, gas and NGLs, leveraging the U.S. pipeline network of over 2.6 million miles (PHMSA, 2024). Strong midstream ties reduce bottlenecks and can shrink basis differentials that have widened past $10/bbl in constrained markets. Contracts align specifications, nominations and take-or-pay obligations to secure cashflow. Strategic connections in proven basins unlock incremental netbacks via improved realizations.
Oilfield services and drilling contractors
Drilling, workover, completions and artificial-lift vendors execute Harvest's development and optimization plans, supporting refracs, recompletions and ESP/rod-lift upgrades to sustain production. Preferred vendors improve cycle time, safety and costs through standardized crews and contracts. Baker Hughes reported a U.S. rig count averaging about 610 in 2024, while EIA U.S. crude production averaged roughly 12.5 million b/d, enabling rapid response to commodity price signals.

Financial institutions and hedge counterparties
Reserve-based lenders (typical LTV 60–75%) plus private capital and ISDA hedge counterparties supply liquidity and price stability; with Brent averaging about $86/bbl in 2024, hedging programs (often 1–3 year collars/swaps) de-risk cash flows and support covenant compliance. Capital partners funded bolt-on producing acquisitions in 2024, while flexible financing structures are tailored to decline profiles and development cadence.

Regulators and local stakeholders
Regulatory compliance with state and federal agencies underpins Harvest Oil & Gas license to operate and enabled timely access to acreage as US crude production averaged about 12.5 million b/d in 2024, stressing the need for predictable approvals. Constructive regulator and stakeholder relationships expedite permits, spacing and facility approvals, while proactive community engagement reduces surface conflicts and operational downtime. Alignment on HSE standards preserves reputation and business continuity.
- Compliance: license to operate
- Permitting: faster approvals
- Community: fewer surface conflicts
- HSE: protects reputation
Data, tech, and analytics vendors
Data, tech, and analytics vendors — subsurface software, production analytics, and SCADA providers — enhance reservoir and asset understanding; real-time data informs optimization and failure prediction, with leading operators reporting up to 30% lower unplanned downtime in 2024.
- Subsurface software: reservoir mapping & A&D screening
- Production analytics: throughput & recovery gains
- SCADA: real-time control & failure alerts
- Cloud workflows: field-to-office decisions
Midstream, drilling & finance align: pipelines 2.6M mi, rigs ~610
Midstream, drilling, finance, regulators and tech partners secure market access, execution and cashflow; US pipeline network 2.6M miles, Brent avg $86/bbl (2024). Preferred service vendors shorten cycle times amid ~610 US rigs and 12.5M b/d crude production. Lenders (LTV 60–75%), hedges and analytics reduce volatility and cut unplanned downtime ~30%.
| Partner | Role | 2024 metric |
|---|---|---|
| Midstream | Transport/processing | 2.6M mi pipelines |
| Drilling | Execution | ~610 rigs |
| Finance | Liquidity/hedges | LTV 60–75%, Brent $86 |
| Tech | Analytics/SCADA | -30% downtime |
What is included in the product
 Detailed Word Document
A comprehensive, pre-written Business Model Canvas tailored to Harvest Oil & Gas, detailing customer segments, value propositions, channels, revenue streams and cost structure across the 9 BMC blocks; includes competitive advantages, SWOT-linked insights and practical validation points for presentations, investor due diligence and strategic decision-making.

 Customizable Excel Spreadsheet
High-level, editable one-page Business Model Canvas that condenses Harvest Oil & Gas’s strategy into a clean, shareable format—relieving pain by accelerating team alignment, saving hours on structuring, and enabling quick comparison or iteration for boardrooms and operational planning.
Activities

Acquire producing properties
Systematically source, underwrite, and close producing assets in proven basins (Permian, Bakken, Eagle Ford), prioritizing cash-flowing properties with low‑risk development upside and operational lift. Perform rigorous technical and commercial DD on reserves, facilities, and contracts to validate NAV and cash flow. Integrate quickly to capture early efficiencies and synergies. Finance planning assumes Fed funds 5.25–5.50% baseline for 2024.
Optimize production operations
Optimize production operations by reducing lease operating expenses and deferments through continuous surveillance, targeted workovers, and artificial lift tuning to restore nodal performance and lower downtime. Implement chemical treatments, compression optimization, and leak mitigation programs while using data-driven diagnostics and predictive analytics to increase uptime. Prioritize high-return interventions across the asset portfolio to maximize capital efficiency and cash flow.

Targeted development and recompletions
Drill infill wells and execute recompletions in low-risk intervals to arrest typical shale first-year declines of ~60–70% (EIA industry observations) by sequencing projects to smooth declines and cash flow; apply modern completions to legacy inventory where returns exceed disciplined hurdle rates (commonly ~20%) and maintain tight cycle-time control (recompletion campaigns often 30–90 days) to maximize capital efficiency.

HSE and regulatory compliance
Maintain strict safety, environmental and reporting standards aligned with OSHA, EPA 40 CFR Part 60 and ISO 14001/45001; integrate field reporting into EHS dashboards for real-time compliance.
Execute integrity management across wells, tanks and pipelines, control water, emissions and waste within regulatory frameworks, and train personnel with routine audits and KPI reviews.
- OSHA, EPA, ISO-aligned
- Integrity programs: wells/tanks/pipelines
- Water, emissions, waste controls
- Routine training & audits
Marketing and hedging
Marketing and hedging secure offtake agreements and optimize pricing differentials, using 2024 market benchmarks (WTI ~ $80/bbl, Henry Hub ~ $2.6/MMBtu, Midland basis ~ -$6/bbl) to set floor pricing and capture basis upside. Derivative programs balance exposure to WTI/HH and regional basis swaps; nominations and logistics scheduling ensure timely deliveries. Hedge profiles are aligned with field development and PDP decline curves to protect cash flow and debt covenants.
- Offtake terms: fixed vs indexed
- Hedges: swaps, collars, basis swaps
- Logistics: nominations, trucking, pipeline slots
- Alignment: hedge tenor vs PDP decline
Permian/Bakken/Eagle Ford cash-flow focus; WTI $80, HH $2.6, 20%+ hurdle
Source and close producing assets in Permian/Bakken/Eagle Ford prioritizing cash-flowing, low‑risk upside; Fed funds 5.25–5.50% (2024), WTI ~$80/bbl, HH ~$2.6/MMBtu. Optimize LOE via predictive maintenance, artificial lift and workovers; target high-return recompletions (30–90 days) and 20%+ hurdle. Hedge WTI/HH and basis to protect PDP-linked cash flow; maintain OSHA/EPA/ISO EHS standards.
| Metric | 2024 Value |
|---|---|
| WTI | $80/bbl |
| Henry Hub | $2.6/MMBtu |
| Fed funds | 5.25–5.50% |
| 1st-yr decline | 60–70% |
| Hurdle | >20% |
What You See Is What You Get
Business Model Canvas
The Harvest Oil & Gas Business Model Canvas you see here is the exact document you’ll receive after purchase, not a mockup or teaser. Upon completing your order you’ll gain immediate access to the full, ready-to-edit file—structured and formatted the same way shown here. It’s delivered complete for presentation, analysis, and editing in Word and Excel.

Business Model Canvas: Strategic Blueprint for Oil and Gas Investors
Unlock the strategic blueprint behind Harvest Oil & Gas with our Business Model Canvas. This concise map reveals value propositions, key partnerships, revenue streams and cost drivers. Ideal for investors and strategists seeking actionable insights. Download the full, editable Canvas to benchmark and scale results.
Partnerships
Midstream and pipeline operators
Gathering, processing and transportation partners ensure flow assurance and market access for oil, gas and NGLs, leveraging the U.S. pipeline network of over 2.6 million miles (PHMSA, 2024). Strong midstream ties reduce bottlenecks and can shrink basis differentials that have widened past $10/bbl in constrained markets. Contracts align specifications, nominations and take-or-pay obligations to secure cashflow. Strategic connections in proven basins unlock incremental netbacks via improved realizations.
Oilfield services and drilling contractors
Drilling, workover, completions and artificial-lift vendors execute Harvest's development and optimization plans, supporting refracs, recompletions and ESP/rod-lift upgrades to sustain production. Preferred vendors improve cycle time, safety and costs through standardized crews and contracts. Baker Hughes reported a U.S. rig count averaging about 610 in 2024, while EIA U.S. crude production averaged roughly 12.5 million b/d, enabling rapid response to commodity price signals.
Financial institutions and hedge counterparties
Reserve-based lenders (typical LTV 60–75%) plus private capital and ISDA hedge counterparties supply liquidity and price stability; with Brent averaging about $86/bbl in 2024, hedging programs (often 1–3 year collars/swaps) de-risk cash flows and support covenant compliance. Capital partners funded bolt-on producing acquisitions in 2024, while flexible financing structures are tailored to decline profiles and development cadence.
Regulators and local stakeholders
Regulatory compliance with state and federal agencies underpins Harvest Oil & Gas license to operate and enabled timely access to acreage as US crude production averaged about 12.5 million b/d in 2024, stressing the need for predictable approvals. Constructive regulator and stakeholder relationships expedite permits, spacing and facility approvals, while proactive community engagement reduces surface conflicts and operational downtime. Alignment on HSE standards preserves reputation and business continuity.
- Compliance: license to operate
- Permitting: faster approvals
- Community: fewer surface conflicts
- HSE: protects reputation
Data, tech, and analytics vendors
Data, tech, and analytics vendors — subsurface software, production analytics, and SCADA providers — enhance reservoir and asset understanding; real-time data informs optimization and failure prediction, with leading operators reporting up to 30% lower unplanned downtime in 2024.
- Subsurface software: reservoir mapping & A&D screening
- Production analytics: throughput & recovery gains
- SCADA: real-time control & failure alerts
- Cloud workflows: field-to-office decisions
Midstream, drilling & finance align: pipelines 2.6M mi, rigs ~610
Midstream, drilling, finance, regulators and tech partners secure market access, execution and cashflow; US pipeline network 2.6M miles, Brent avg $86/bbl (2024). Preferred service vendors shorten cycle times amid ~610 US rigs and 12.5M b/d crude production. Lenders (LTV 60–75%), hedges and analytics reduce volatility and cut unplanned downtime ~30%.
| Partner | Role | 2024 metric |
|---|---|---|
| Midstream | Transport/processing | 2.6M mi pipelines |
| Drilling | Execution | ~610 rigs |
| Finance | Liquidity/hedges | LTV 60–75%, Brent $86 |
| Tech | Analytics/SCADA | -30% downtime |
What is included in the product
Detailed Word Document
A comprehensive, pre-written Business Model Canvas tailored to Harvest Oil & Gas, detailing customer segments, value propositions, channels, revenue streams and cost structure across the 9 BMC blocks; includes competitive advantages, SWOT-linked insights and practical validation points for presentations, investor due diligence and strategic decision-making.
Customizable Excel Spreadsheet
High-level, editable one-page Business Model Canvas that condenses Harvest Oil & Gas’s strategy into a clean, shareable format—relieving pain by accelerating team alignment, saving hours on structuring, and enabling quick comparison or iteration for boardrooms and operational planning.
Activities
Acquire producing properties
Systematically source, underwrite, and close producing assets in proven basins (Permian, Bakken, Eagle Ford), prioritizing cash-flowing properties with low‑risk development upside and operational lift. Perform rigorous technical and commercial DD on reserves, facilities, and contracts to validate NAV and cash flow. Integrate quickly to capture early efficiencies and synergies. Finance planning assumes Fed funds 5.25–5.50% baseline for 2024.
Optimize production operations
Optimize production operations by reducing lease operating expenses and deferments through continuous surveillance, targeted workovers, and artificial lift tuning to restore nodal performance and lower downtime. Implement chemical treatments, compression optimization, and leak mitigation programs while using data-driven diagnostics and predictive analytics to increase uptime. Prioritize high-return interventions across the asset portfolio to maximize capital efficiency and cash flow.
Targeted development and recompletions
Drill infill wells and execute recompletions in low-risk intervals to arrest typical shale first-year declines of ~60–70% (EIA industry observations) by sequencing projects to smooth declines and cash flow; apply modern completions to legacy inventory where returns exceed disciplined hurdle rates (commonly ~20%) and maintain tight cycle-time control (recompletion campaigns often 30–90 days) to maximize capital efficiency.
HSE and regulatory compliance
Maintain strict safety, environmental and reporting standards aligned with OSHA, EPA 40 CFR Part 60 and ISO 14001/45001; integrate field reporting into EHS dashboards for real-time compliance.
Execute integrity management across wells, tanks and pipelines, control water, emissions and waste within regulatory frameworks, and train personnel with routine audits and KPI reviews.
- OSHA, EPA, ISO-aligned
- Integrity programs: wells/tanks/pipelines
- Water, emissions, waste controls
- Routine training & audits
Marketing and hedging
Marketing and hedging secure offtake agreements and optimize pricing differentials, using 2024 market benchmarks (WTI ~ $80/bbl, Henry Hub ~ $2.6/MMBtu, Midland basis ~ -$6/bbl) to set floor pricing and capture basis upside. Derivative programs balance exposure to WTI/HH and regional basis swaps; nominations and logistics scheduling ensure timely deliveries. Hedge profiles are aligned with field development and PDP decline curves to protect cash flow and debt covenants.
- Offtake terms: fixed vs indexed
- Hedges: swaps, collars, basis swaps
- Logistics: nominations, trucking, pipeline slots
- Alignment: hedge tenor vs PDP decline
Permian/Bakken/Eagle Ford cash-flow focus; WTI $80, HH $2.6, 20%+ hurdle
Source and close producing assets in Permian/Bakken/Eagle Ford prioritizing cash-flowing, low‑risk upside; Fed funds 5.25–5.50% (2024), WTI ~$80/bbl, HH ~$2.6/MMBtu. Optimize LOE via predictive maintenance, artificial lift and workovers; target high-return recompletions (30–90 days) and 20%+ hurdle. Hedge WTI/HH and basis to protect PDP-linked cash flow; maintain OSHA/EPA/ISO EHS standards.
| Metric | 2024 Value |
|---|---|
| WTI | $80/bbl |
| Henry Hub | $2.6/MMBtu |
| Fed funds | 5.25–5.50% |
| 1st-yr decline | 60–70% |
| Hurdle | >20% |
What You See Is What You Get
Business Model Canvas
The Harvest Oil & Gas Business Model Canvas you see here is the exact document you’ll receive after purchase, not a mockup or teaser. Upon completing your order you’ll gain immediate access to the full, ready-to-edit file—structured and formatted the same way shown here. It’s delivered complete for presentation, analysis, and editing in Word and Excel.
Original: $10.00
-65%$10.00
$3.50Description
Business Model Canvas: Strategic Blueprint for Oil and Gas Investors
Unlock the strategic blueprint behind Harvest Oil & Gas with our Business Model Canvas. This concise map reveals value propositions, key partnerships, revenue streams and cost drivers. Ideal for investors and strategists seeking actionable insights. Download the full, editable Canvas to benchmark and scale results.
Partnerships
Midstream and pipeline operators
Gathering, processing and transportation partners ensure flow assurance and market access for oil, gas and NGLs, leveraging the U.S. pipeline network of over 2.6 million miles (PHMSA, 2024). Strong midstream ties reduce bottlenecks and can shrink basis differentials that have widened past $10/bbl in constrained markets. Contracts align specifications, nominations and take-or-pay obligations to secure cashflow. Strategic connections in proven basins unlock incremental netbacks via improved realizations.
Oilfield services and drilling contractors
Drilling, workover, completions and artificial-lift vendors execute Harvest's development and optimization plans, supporting refracs, recompletions and ESP/rod-lift upgrades to sustain production. Preferred vendors improve cycle time, safety and costs through standardized crews and contracts. Baker Hughes reported a U.S. rig count averaging about 610 in 2024, while EIA U.S. crude production averaged roughly 12.5 million b/d, enabling rapid response to commodity price signals.
Financial institutions and hedge counterparties
Reserve-based lenders (typical LTV 60–75%) plus private capital and ISDA hedge counterparties supply liquidity and price stability; with Brent averaging about $86/bbl in 2024, hedging programs (often 1–3 year collars/swaps) de-risk cash flows and support covenant compliance. Capital partners funded bolt-on producing acquisitions in 2024, while flexible financing structures are tailored to decline profiles and development cadence.
Regulators and local stakeholders
Regulatory compliance with state and federal agencies underpins Harvest Oil & Gas license to operate and enabled timely access to acreage as US crude production averaged about 12.5 million b/d in 2024, stressing the need for predictable approvals. Constructive regulator and stakeholder relationships expedite permits, spacing and facility approvals, while proactive community engagement reduces surface conflicts and operational downtime. Alignment on HSE standards preserves reputation and business continuity.
- Compliance: license to operate
- Permitting: faster approvals
- Community: fewer surface conflicts
- HSE: protects reputation
Data, tech, and analytics vendors
Data, tech, and analytics vendors — subsurface software, production analytics, and SCADA providers — enhance reservoir and asset understanding; real-time data informs optimization and failure prediction, with leading operators reporting up to 30% lower unplanned downtime in 2024.
- Subsurface software: reservoir mapping & A&D screening
- Production analytics: throughput & recovery gains
- SCADA: real-time control & failure alerts
- Cloud workflows: field-to-office decisions
Midstream, drilling & finance align: pipelines 2.6M mi, rigs ~610
Midstream, drilling, finance, regulators and tech partners secure market access, execution and cashflow; US pipeline network 2.6M miles, Brent avg $86/bbl (2024). Preferred service vendors shorten cycle times amid ~610 US rigs and 12.5M b/d crude production. Lenders (LTV 60–75%), hedges and analytics reduce volatility and cut unplanned downtime ~30%.
| Partner | Role | 2024 metric |
|---|---|---|
| Midstream | Transport/processing | 2.6M mi pipelines |
| Drilling | Execution | ~610 rigs |
| Finance | Liquidity/hedges | LTV 60–75%, Brent $86 |
| Tech | Analytics/SCADA | -30% downtime |
What is included in the product
Detailed Word Document
A comprehensive, pre-written Business Model Canvas tailored to Harvest Oil & Gas, detailing customer segments, value propositions, channels, revenue streams and cost structure across the 9 BMC blocks; includes competitive advantages, SWOT-linked insights and practical validation points for presentations, investor due diligence and strategic decision-making.
Customizable Excel Spreadsheet
High-level, editable one-page Business Model Canvas that condenses Harvest Oil & Gas’s strategy into a clean, shareable format—relieving pain by accelerating team alignment, saving hours on structuring, and enabling quick comparison or iteration for boardrooms and operational planning.
Activities
Acquire producing properties
Systematically source, underwrite, and close producing assets in proven basins (Permian, Bakken, Eagle Ford), prioritizing cash-flowing properties with low‑risk development upside and operational lift. Perform rigorous technical and commercial DD on reserves, facilities, and contracts to validate NAV and cash flow. Integrate quickly to capture early efficiencies and synergies. Finance planning assumes Fed funds 5.25–5.50% baseline for 2024.
Optimize production operations
Optimize production operations by reducing lease operating expenses and deferments through continuous surveillance, targeted workovers, and artificial lift tuning to restore nodal performance and lower downtime. Implement chemical treatments, compression optimization, and leak mitigation programs while using data-driven diagnostics and predictive analytics to increase uptime. Prioritize high-return interventions across the asset portfolio to maximize capital efficiency and cash flow.
Targeted development and recompletions
Drill infill wells and execute recompletions in low-risk intervals to arrest typical shale first-year declines of ~60–70% (EIA industry observations) by sequencing projects to smooth declines and cash flow; apply modern completions to legacy inventory where returns exceed disciplined hurdle rates (commonly ~20%) and maintain tight cycle-time control (recompletion campaigns often 30–90 days) to maximize capital efficiency.
HSE and regulatory compliance
Maintain strict safety, environmental and reporting standards aligned with OSHA, EPA 40 CFR Part 60 and ISO 14001/45001; integrate field reporting into EHS dashboards for real-time compliance.
Execute integrity management across wells, tanks and pipelines, control water, emissions and waste within regulatory frameworks, and train personnel with routine audits and KPI reviews.
- OSHA, EPA, ISO-aligned
- Integrity programs: wells/tanks/pipelines
- Water, emissions, waste controls
- Routine training & audits
Marketing and hedging
Marketing and hedging secure offtake agreements and optimize pricing differentials, using 2024 market benchmarks (WTI ~ $80/bbl, Henry Hub ~ $2.6/MMBtu, Midland basis ~ -$6/bbl) to set floor pricing and capture basis upside. Derivative programs balance exposure to WTI/HH and regional basis swaps; nominations and logistics scheduling ensure timely deliveries. Hedge profiles are aligned with field development and PDP decline curves to protect cash flow and debt covenants.
- Offtake terms: fixed vs indexed
- Hedges: swaps, collars, basis swaps
- Logistics: nominations, trucking, pipeline slots
- Alignment: hedge tenor vs PDP decline
Permian/Bakken/Eagle Ford cash-flow focus; WTI $80, HH $2.6, 20%+ hurdle
Source and close producing assets in Permian/Bakken/Eagle Ford prioritizing cash-flowing, low‑risk upside; Fed funds 5.25–5.50% (2024), WTI ~$80/bbl, HH ~$2.6/MMBtu. Optimize LOE via predictive maintenance, artificial lift and workovers; target high-return recompletions (30–90 days) and 20%+ hurdle. Hedge WTI/HH and basis to protect PDP-linked cash flow; maintain OSHA/EPA/ISO EHS standards.
| Metric | 2024 Value |
|---|---|
| WTI | $80/bbl |
| Henry Hub | $2.6/MMBtu |
| Fed funds | 5.25–5.50% |
| 1st-yr decline | 60–70% |
| Hurdle | >20% |
What You See Is What You Get
Business Model Canvas
The Harvest Oil & Gas Business Model Canvas you see here is the exact document you’ll receive after purchase, not a mockup or teaser. Upon completing your order you’ll gain immediate access to the full, ready-to-edit file—structured and formatted the same way shown here. It’s delivered complete for presentation, analysis, and editing in Word and Excel.











